Vehicle Detection Project
The goals / steps of this project are the following:
- Perform a Histogram of Oriented Gradients (HOG) feature extraction on a labeled training set of images and train a classifier Linear SVM classifier.
- Apply a color transform and append binned color features, as well as histograms of color, to your HOG feature vector.
- Normalize your features and randomize a selection for training and testing.
- Implement a sliding-window technique and use your trained classifier to search for vehicles in images.
- Run the pipeline on a video stream and create a heat map of recurring detections frame by frame to reject outliers and follow detected vehicles.
- Estimate a bounding box for vehicles detected.
Functions referenced in this report are contained in the jupyter notebook.
The code extracting HOG features for training images is contained in the get_hog_features() function. This function takes in an image, HOG parameters. It returns HOG features and optionally the hog_image. I started by running a sample non-car and car image through the function with different color space formats to determine which one returns more data.
non-car
car
I implemented functions bin_spatial() to compute binned color features and color_hist() to compute color histogram features.
In order to test parameters for all three feature classes (hog, binned, histogram), I implemented the single_img_features() function which accepts an image and returns a combined feature vector. The extract_features() function takes multiple test images and processes them using the single_img_features() function.
The function get_classifier() takes in car_features and notcar_features, standardizes them using the StandardScaler(), splits the data into training and test data sets, and trains a model using the LinearSvc() algorithm. The function returns the trained classifier along with the standard scaler.
I extracted features from car and non-car training images, storing them in the car_features and notcar_features variables. I ran the extracted features through the get_classifier() function with the following parameters:
- HOG Classifier:
YCrCbcolor space, 9 orientations, 8 pixels per block, 2 cells per block, using all image channels. - Binned Classifier: (32,32) spatial binning dimensions
- Histogram Classifier: 32 histogram bins
I explored several different color spaces in addition to YCrCb. I found that LUV was very close. I tried training with just one color channel, testing all three individually. I found that using all channels improves test accuracy. I tried several orientations (11, 13), pixes per cell (13, 16), though they did not make a significant difference in the training accuracy.
I implemented sliding window search in the find_cars() function. The function takes in an image, a region of interest, a classifier, a standard scaler, along with feature extraction parameters. The function returns a list of boxes found on the image. The function improves search performance for HOG features, extracting features once for the entire region of interest for each channel and sub-sampling that array for each sliding window.
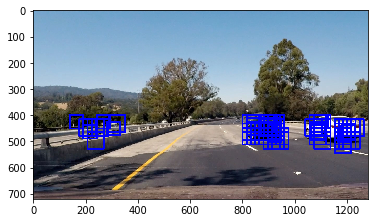
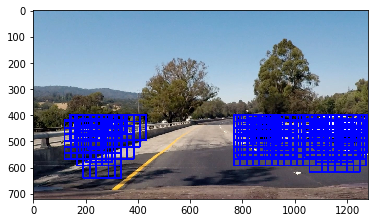
I tried multiple scales (0.8, 1, 1.25, 1.5, 1.75, 2) to detect boxes. Examples of test images at different scales:
Scale 1
Scale 1.5
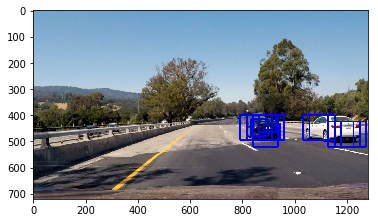
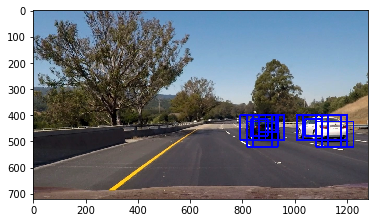
I ended up searching with two scales (1, 1.5) using YCrCb 3-channel HOG features plus spatially binned color and histograms of color in the feature vector. Here are some example images:
Here's a link to my video result
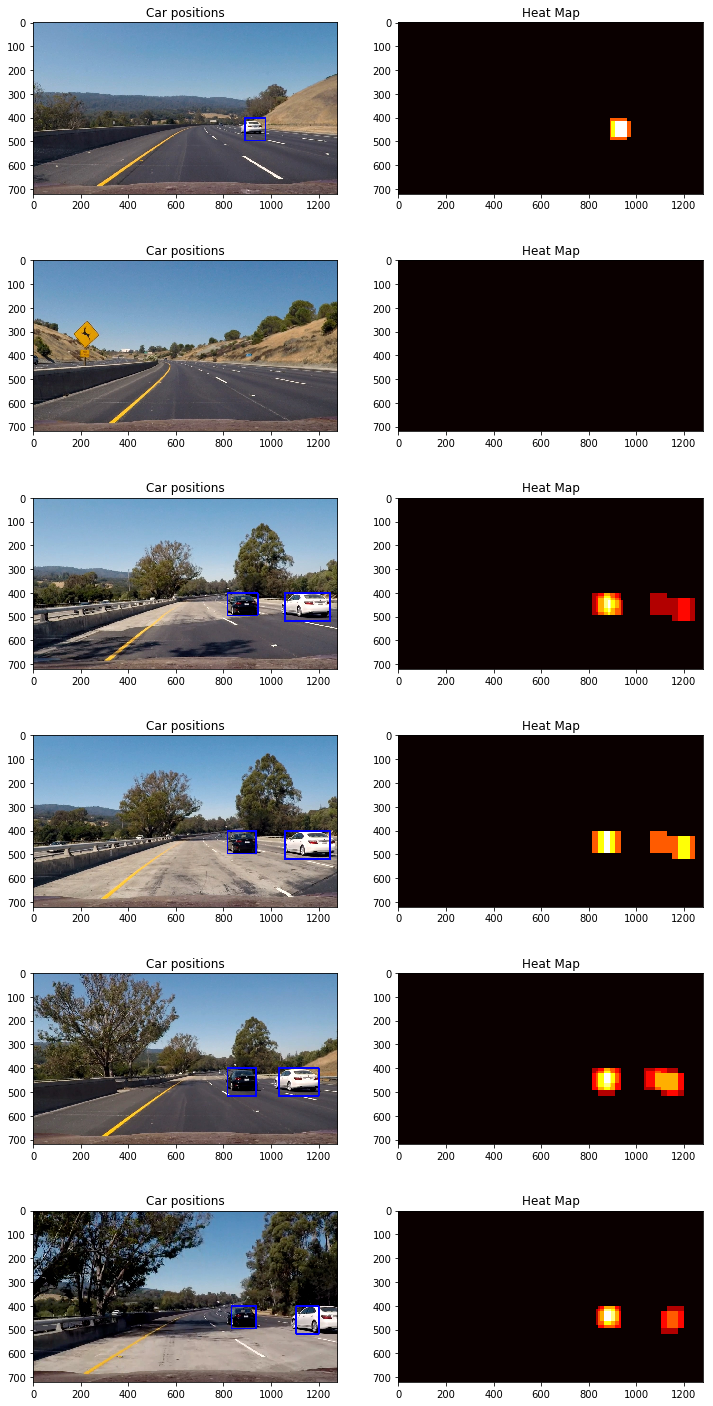
I created the Boxes class to keep track of processed video frames in order to combine box sizes over 10 frames to smooth the video. The process_image() function has the video processing pipeline. The function searches for boxes using two different scales, combines boxes with the boxes from 10 previous frames, creates a heatmap using all boxes, applies a threshold to eliminate false positives, and generates final boxes from heatmap using the scipy.ndimage.measurements.label() function.
Here's an example result showing the heatmap from the test images along with the bounding boxes:
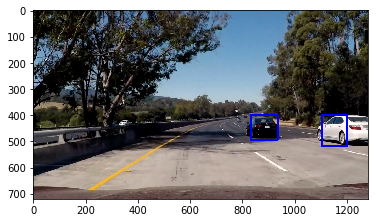
Output of scipy.ndimage.measurements.label() on the heatmap from the last image:

- I initially ran into problems when using the
cv2.imreadfunction, which produces images in theBGRcolor space. Despite using the right conversionBGR2YCrCb, I was not able to consistently detect the boxes. Switching to thematplotlibmpimglibrary addressed the problem. - I found that using
HOGfeatures alone gave me most of the test accuracy - I ran into a problem by using too small and too large of scaling factors, which resulted in too many false positives. I attempted suppresing them with a higher threshold, but was not able to eliminate all of them.
The pipeline still detects false positives, specifically cars on the opposite lane. Fine-tuning my region of interest may help, along with adding more labeled images to the training data set.


