Tool for debugging events/commands from your applications.
The commanded_events_map is tool by which we can see how the commands & events are composed in our app. But we don't see the flows between them as we miss correlations/causations which are available only in runtime. This app is allowing that
In saome way this tool could be also used for remote debugging production deploys via ssh binding to server .... (but I am not sure yet).
This application is still under developing. It is not perfect there are still stuff to improve it and make it better (see TODO section). Feel free to contribute.
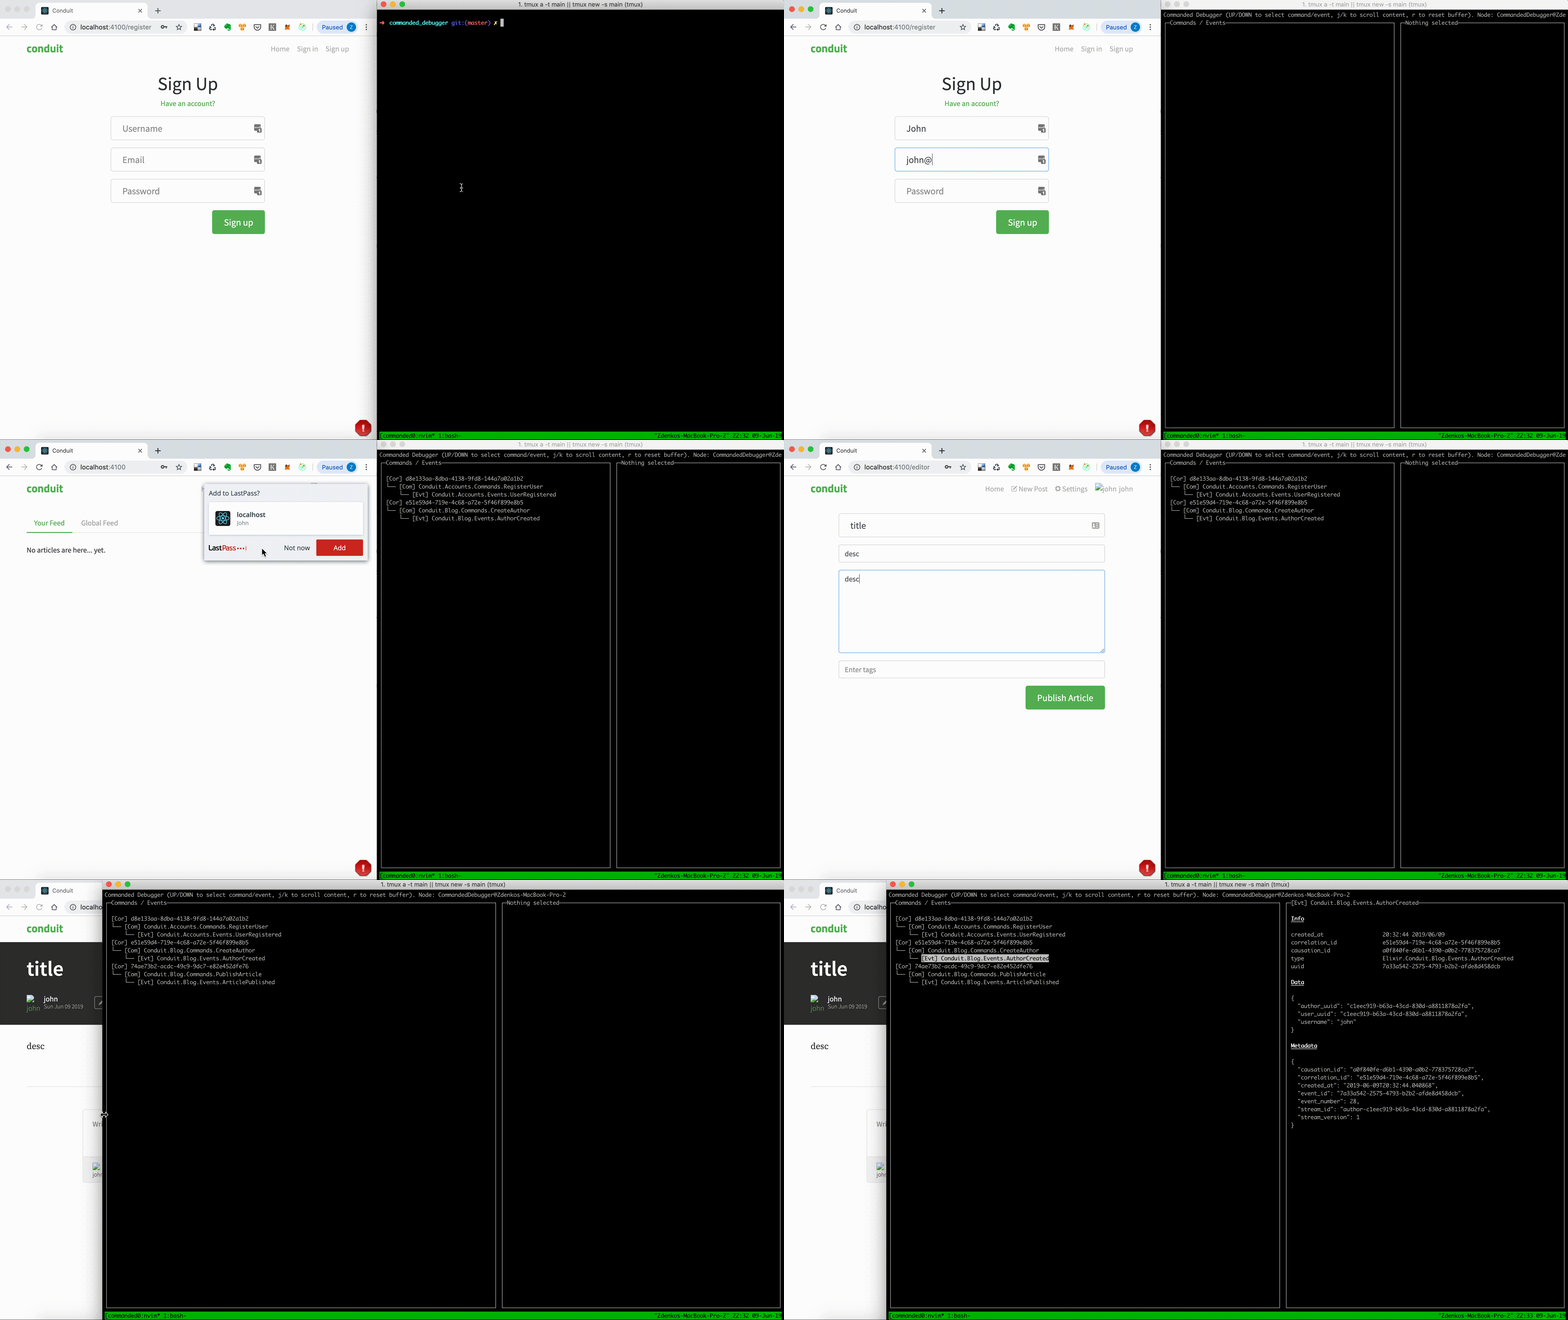
This example is made with https://github.com/slashdotdash/conduit. The commands/events are grouped in tree view by correlation_id and linked by causation_id.
- add
commanded_debuggerto your list of dependencies inmix.exs:
def deps do
  [
    {:commanded_debugger, git: "https://github.com/zdenal/commanded_debugger.git"}
  ]
end
This will be soon moved to hex packages when some details will be solved ..
- add to your routers middleware
middleware(CommandedDebugger.Middleware)which is sending commands to CommandedDebugger buffer
This middleware is logic inspired by commanded-audit-middleware
- run your application with
--snameto run node with correctly set host:elixir --sname app -S mix phx.serveror if you want iteractive modeiex --sname app -S mix phx.server
For first time please wait for while to get CommandedDebugger event handler up to date. If you would have runned CommandedDebugger app in another terminal the app could get stuck w/ a huge amount of events (depends how many events you already have in DB).
- clone CommandedDebugger somewhere to your disk
git clone git@github.com:zdenal/commanded_debugger.git - go to the repository and run
./bin/start
The debugger is getting events/commands from your app and you can see the commands/events flows grouped by correlations and linked by causations. The events/commands are stored only in process state (no persistent layer).
You can also use this tool w/ your integration tests to see the flow of commands/events.
- start CommandedDebugger UI by
./bin/startin CommandedDebugger repository - run your integration test with
--snameeg:elixir --sname app -S mix test test/integrations/registration_test.exs:260
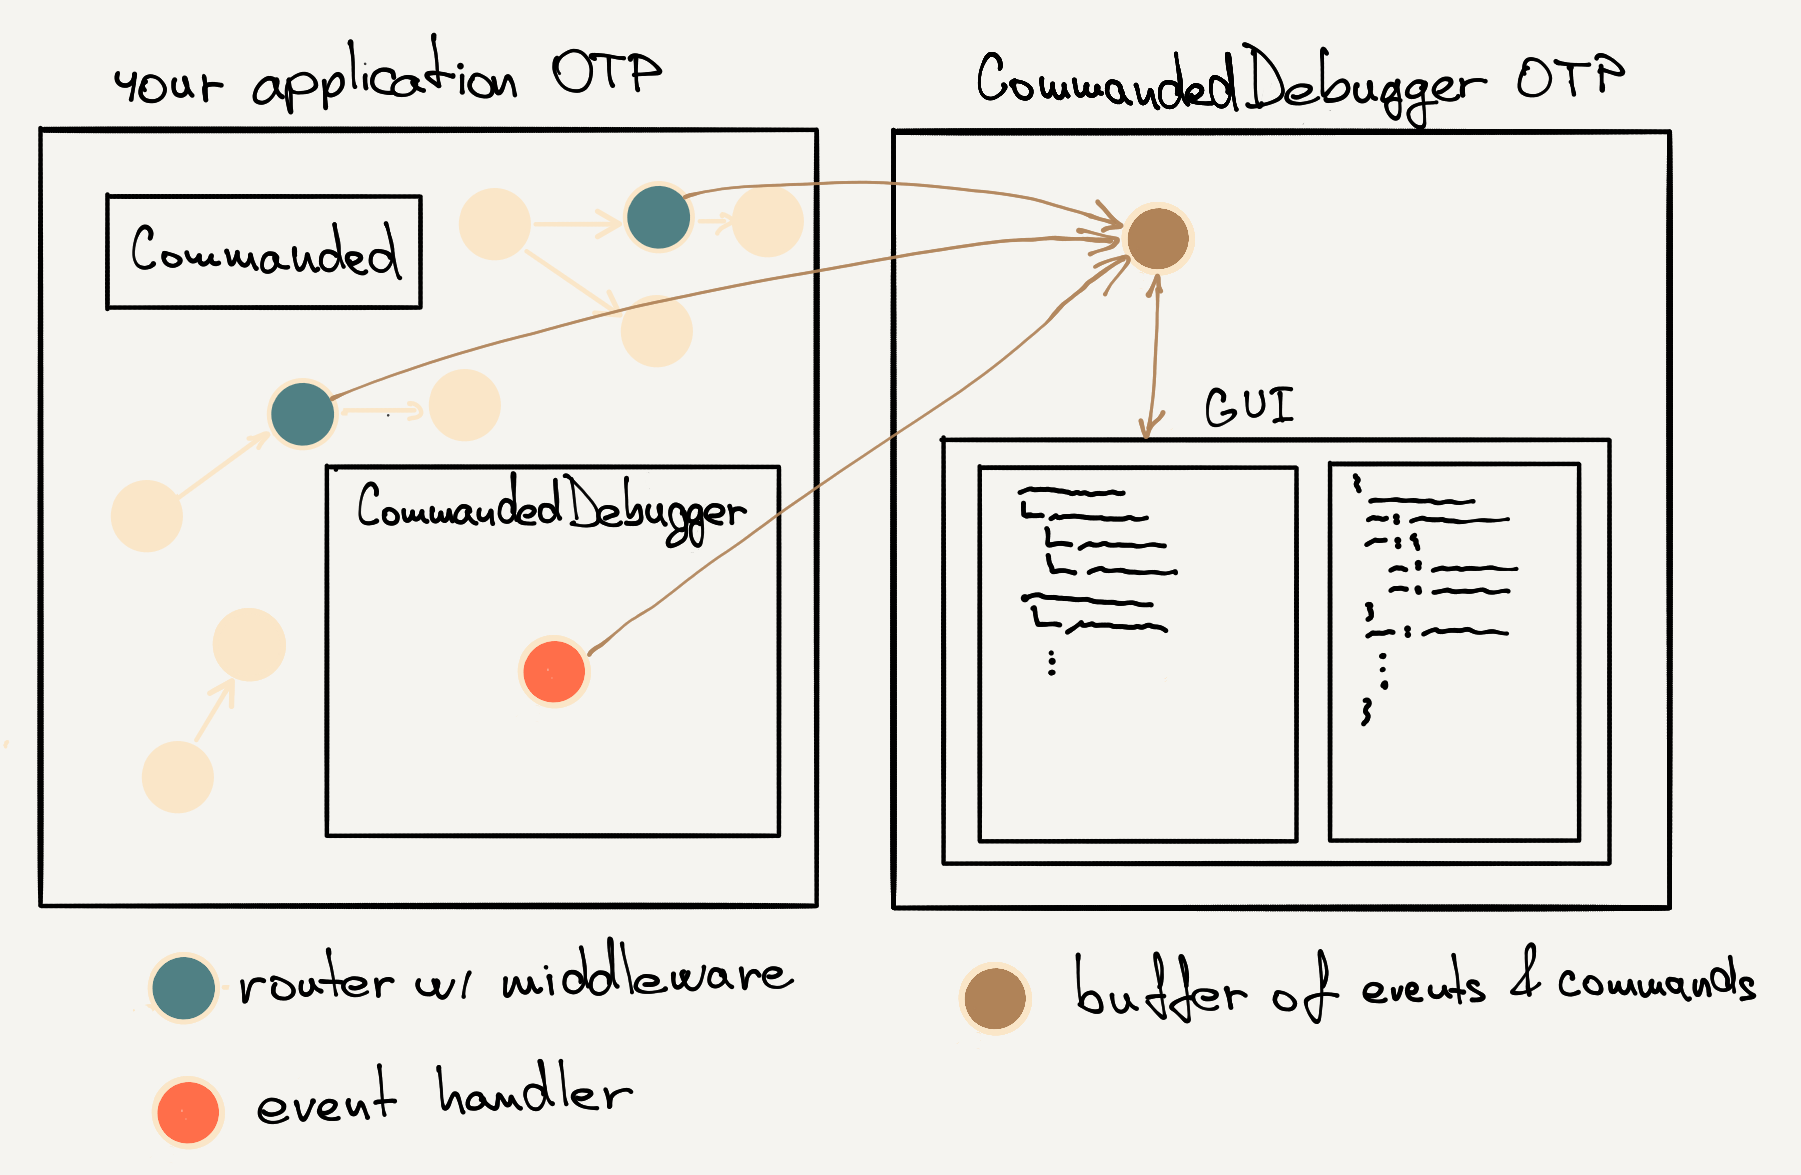
Starting properly your app with --sname will allow to comunnicate with CommandedDebugger UI (runned by ./bin/start from CommandedDebugger repository). The CommandedDebugger will automatically run event handler which
will send each event to CommandedDebugger buffer in UI app. The same with middlewares, they will make
sure the commands from routers will be sent into buffer also.
The buffer is keeping commands/events in process state and they are not saved anywhere, so it is only for debugging purposes.
- handle offset-y for walking trhough tree
- better tree manipulating. Also after getting new events/command the navigating is not working correctly for while as tree was changed.
- better handling new tree structure when new events/commands are comming to not changing so much

