Here is a list of links to some of my presentations:
- SPPPACY - Spring 2021
- DanceMuse - Inspiring Art through AI - Spring 2021
- DefensiveLayer - Defending Against Adversarial Attacks One Layer at a Time - Fall 2020
- Op Amp for Headphone Amplification - Spring 2020
- LTspice Maximum Power Point Tracker - Spring 2020
- Image Denoising with Two-Dimensional Adaptive Filter Algorithms - Paper Report - Summer 2019
- Low Cost Solutions for Diabetes in Soroti, Uganda - Spring 2018
Taken from SPPPACY project:
Visualization of corn yield at each Iowa county from 2011 to 2019. Green indicates high yield while yellow indicates low.
Taken from Remote-Sensing project 2:
Mapping the spatial extent of a dataset to undestand distribution and possible causes of model failure.
Taken from fallback - a system to report accidents in the homes of seniors living alone:
Figure to emphasize hazard of falling for seniors
Taken from Op Amp for Headphone Amplification:
Op-amp design color-coded by transistor role. Not my best visualization, but it was the culmination of a really long project and I wanted to share.
Taken from Low Cost Solutions for Diabetes in Soroti, Uganda:


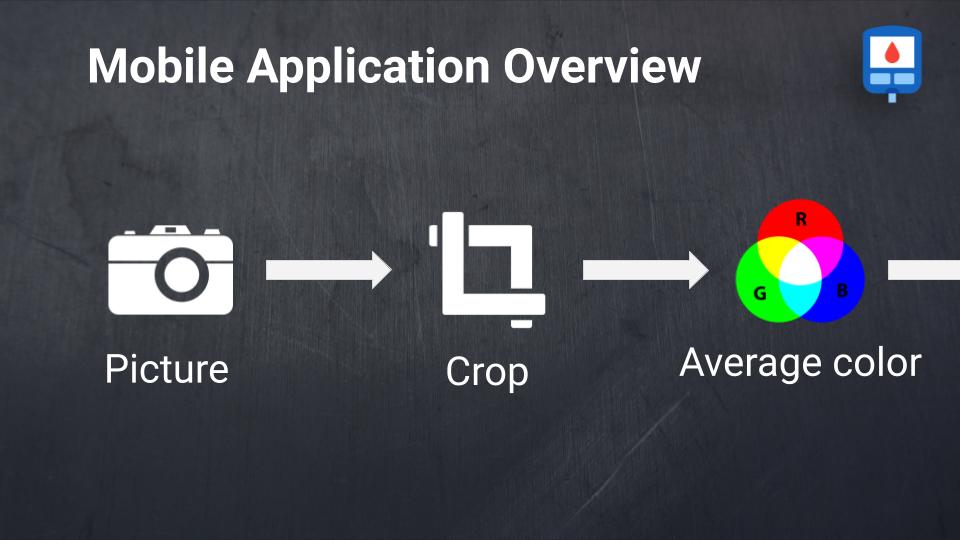
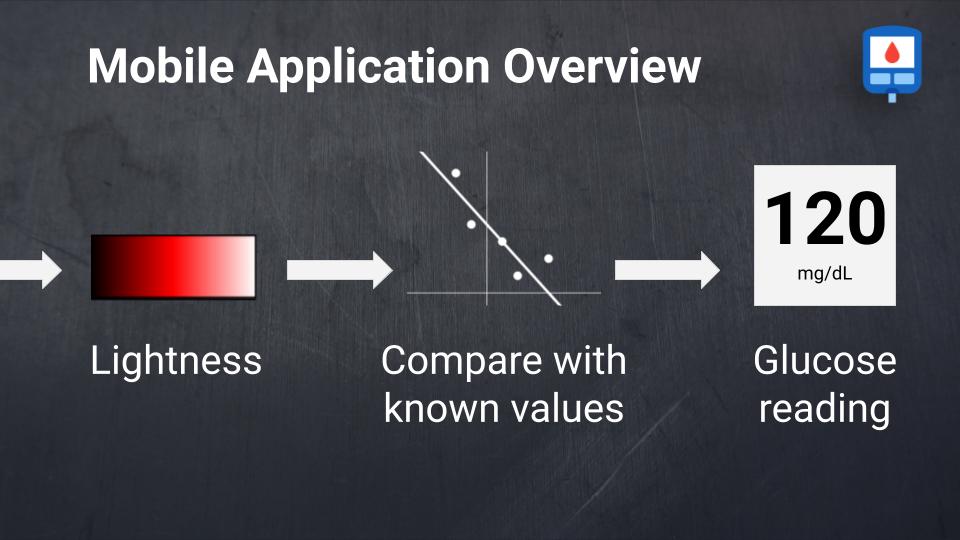
Overview of proposed application for glucose prediction using colored test strips