『次世代シークエンサーDRY解析教本 改訂第2版』「Level 3 応用編 シングルセル RNA-seq で擬時間に対する発現量変動をクラスタリングし、クラスターごとの平均と代表的な遺伝子の発現量を可視化する」(尾崎遼)のサポートページ
English follows after Japanese.
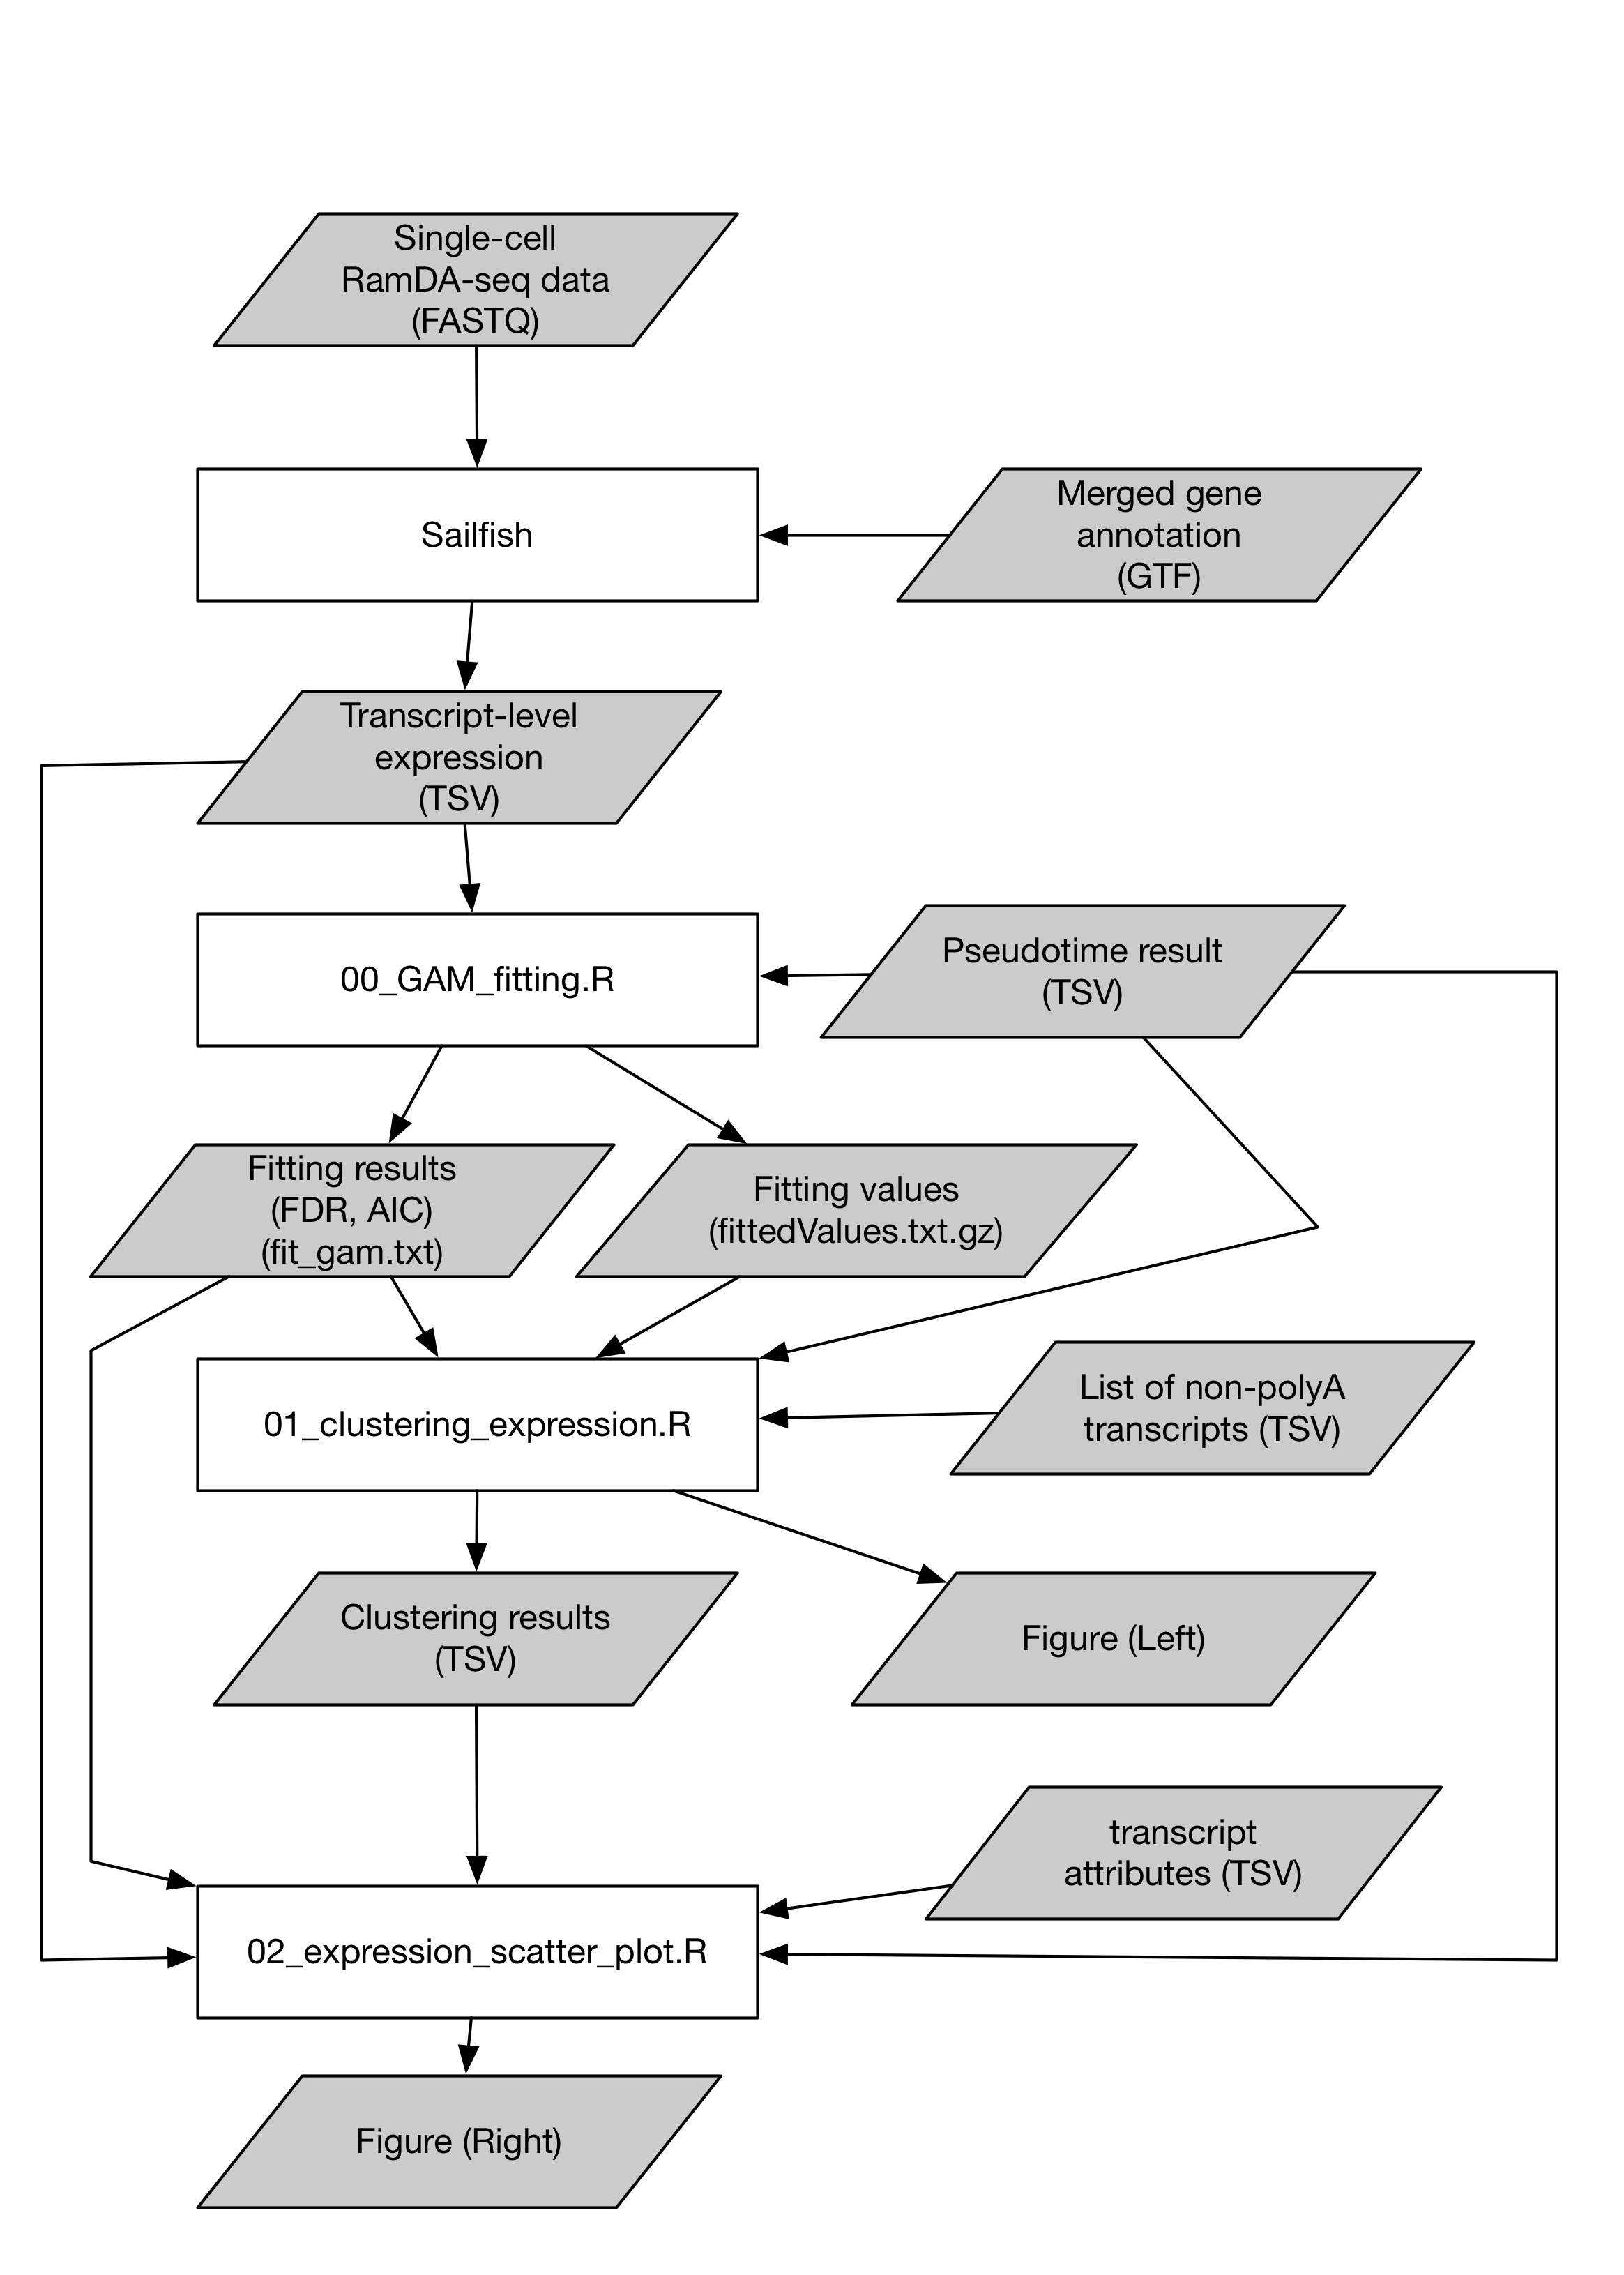
このページでは、Hayashi et al., Nature Communications (2018) https://doi.org/10.1038/s41467-018-02866-0 でのFigure 3cの作図方法のスクリプトを載せています。
今後の更新について: リンクが切れた、バージョンが変わって動かない、ということが起こった場合、コマンドやスクリプトを後からアップデートいたします。「動かない」ということがありましたら、Issueで報告いただくか、harukao.cb[at]gmail.comまでご連絡ください。
- mac OS High Sierra (version 10.13.6), R version 3.6.0
- Linux, Docker
r-base:3.6.0
- R version 3.6.0
- git
- git-lfs(インストール方法は後述)
- ggplot2
- flashClust
- mgcv
- dplyr
- magrittr
- data.table
- dtplyr
- R.utils
- Homebrewの場合、
brew install git-lfsを実行します。 - MacPortsの場合、
port install git-lfsを実行します。
以下のコマンドで、git-lfsがインストールされたことを確認します。
$ git lfs install
> Git LFS initialized.
こちらをご覧ください: https://help.github.com/en/articles/installing-git-large-file-storage.
以下のコマンドで、Rを起動します。
$ R
以下のRのコマンドで、必要なRパッケージをインストールします。
> install.packages(c(
+ 	"ggplot2",
+ 	"flashClust",
+ 	"mgcv",
+ 	"dplyr",
+ 	"magrittr",
+ 	"data.table",
+ 	"dtplyr",
+ 	"R.utils"
+ 	),
+ 	repos="https://cloud.r-project.org/"
+ )
以下のコマンドを実行してください。
$ git clone git@github.com:yuifu/tutorial-RamDA-paper-fugures.git
$ cd tutorial-RamDA-paper-fugures/Figure3c/
以下のコマンドで、data/transcript_expression_matrix.txt.gz というサイズの大きな(178 MB)ファイルが適切にダウンロードされたことを確かめます。
$ du -sh data/transcript_expression_matrix.txt.gz
178M	data/transcript_expression_matrix.txt.gz
まず、tutorial-RamDA-paper-fugures/Figure3c/に移動します。
次に、以下のコマンドで、Rを起動します。
$ R
以下のRコマンドで、図の要素を作成します。
> source("00_GAM_fitting.R")
> source("01_clustering_expression.R")
> source("02_expression_scatter_plot.R")
まず、tutorial-RamDA-paper-fugures/Figure3c/に移動します。
次に、以下のコマンドで、RのDockerイメージを起動します。
$ docker pull r-base:3.6.0
$ docker run -it --rm --name harukao_rbase_test \
-v $PWD:$PWD \
-w=$PWD \
r-base:3.6.0
あとは、"必要なRパッケージのインストール"および"ローカル環境のRで実行する"と同じです。
How to draw Figure 3c in Hayashi et al., Nature Communications (2018)
Hayashi et al., Nature Communications (2018) https://doi.org/10.1038/s41467-018-02866-0
- mac OS High Sierra (version 10.13.6), R version 3.6.0
- Linux, Docker
r-base:3.6.0
- R version 3.6.0
- git
- git-lfs
- ggplot2
- flashClust
- mgcv
- dplyr
- magrittr
- data.table
- dtplyr
- R.utils
- To use Homebrew, run
brew install git-lfs. - To use MacPorts, run
port install git-lfs.
Then, verify that the installation was successful:
$ git lfs install
> Git LFS initialized.
See https://help.github.com/en/articles/installing-git-large-file-storage.
Before run, please install git-lfs (see the above).
Please execute the following command on shell:
$ git clone git@github.com:yuifu/tutorial-RamDA-paper-fugures.git
$ cd tutorial-RamDA-paper-fugures/Figure3c/
Check size of the large file to see if it have been properly downloaded:
$ du -sh data/transcript_expression_matrix.txt.gz
178M	data/transcript_expression_matrix.txt.gz
Run R:
$ R
Execute the following command on R to install required packages:
> install.packages(c(
+ 	"ggplot2",
+ 	"flashClust",
+ 	"mgcv",
+ 	"dplyr",
+ 	"magrittr",
+ 	"data.table",
+ 	"dtplyr",
+ 	"R.utils"
+ 	),
+ 	repos="https://cloud.r-project.org/"
+ )
Then, execute the following command on R:
> source("00_GAM_fitting.R")
> source("01_clustering_expression.R")
> source("02_expression_scatter_plot.R")
Please execute the following command on shell:
$ git clone git@github.com:yuifu/tutorial-RamDA-paper-fugures.git
$ cd tutorial-RamDA-paper-fugures/Figure3c/
Check size of the large file to see if it have been properly downloaded:
$ du -sh data/transcript_expression_matrix.txt.gz
178M	data/transcript_expression_matrix.txt.gz
Run R Docker image:
$ docker pull r-base:3.6.0
$ docker run -it --rm --name harukao_rbase_test \
-v $PWD:$PWD \
-w=$PWD \
r-base:3.6.0
Execute the following command on R to install required packages:
> install.packages(c(
+ 	"ggplot2",
+ 	"flashClust",
+ 	"mgcv",
+ 	"dplyr",
+ 	"magrittr",
+ 	"data.table",
+ 	"dtplyr",
+ 	"R.utils"
+ 	),
+ 	repos="https://cloud.r-project.org/"
+ )
Then, execute the following command on R:
> source("00_GAM_fitting.R")
> source("01_clustering_expression.R")
> source("02_expression_scatter_plot.R")
