A docker solution to monitor Symfony and Apache or Nginx with ELK.
To start building your monitoring dashboards thanks to Kibana, follow these steps:
- Clone this repository or create your own docker-compose.yml file.
elk:
  image: ypereirareis/elk
  ports:
    - 8200:9200
    - 4601:5601

forwarder:
  image: ypereirareis/logstash-forwarder
  links:
    - elk
Change the ports mapping if needed.
The links configuration of the forwarder is very important !
- Add volumes matching your Apache/Nginx and Symfony logs directories to the
forwardercontainer:
forwarder:
  ...
  volumes:
    - APACHE_ACCESS_ERROR_LOG_DIR/:/var/log/forwarder/apache
    - NGING_ACCESS_ERROR_LOG_DIR/:/var/log/forwarder/nginx
- SYMFONY_PROD_DEV_LOG_DIR/:/var/log/forwarder/symfony-
Start the containers with
make startordocker-compose up -d elk forwarder- ELK and logstah-forwarder startup can take a few seconds.
- You can use
make logsto see startup logs.
-
Check elastic(search) status http://127.0.0.1:8200
-
Access the Kibana home page http://127.0.0.1:4601
If you want to persist all your work and configuration even if your remove your containers,
just map a volume to the elk container:
elk:
  image: ypereirareis/elk
  ...
  volumes:
    HOST_PATH_TO_STORE_ELASTICSEARCH_CONF/:/var/lib/elasticsearch
## Docker images
This monitoring project is built thanks to two docker images:
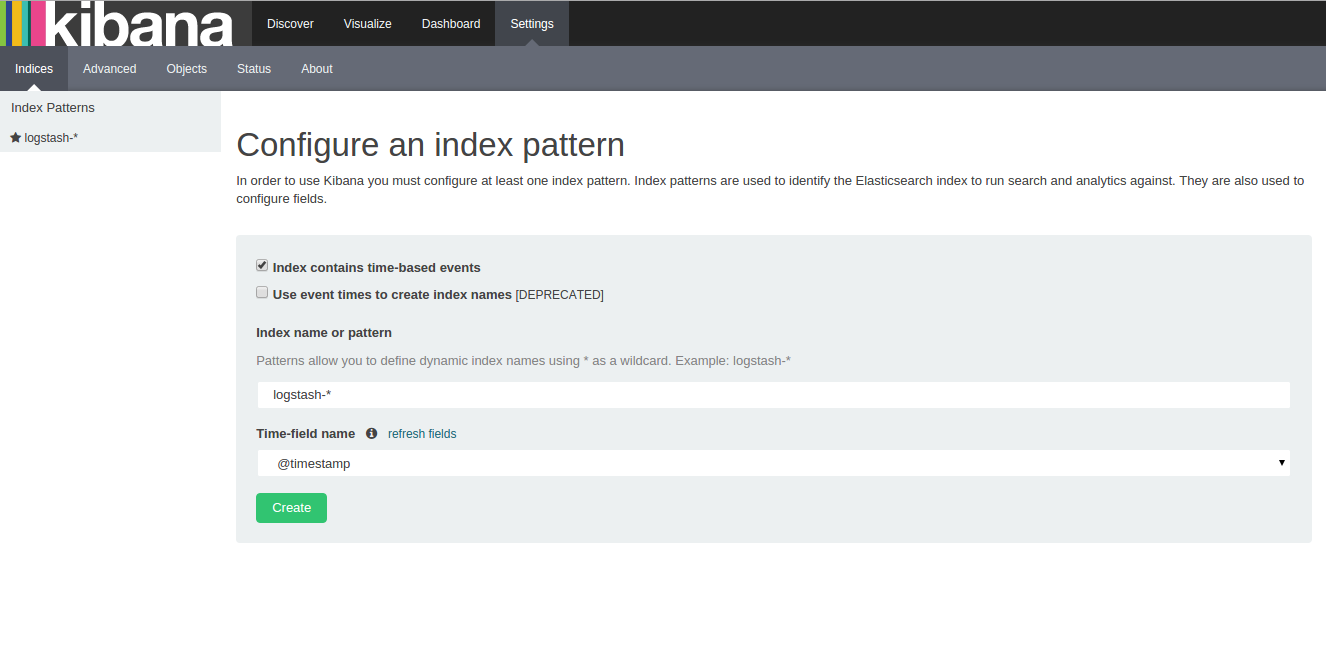
To see the Kibana UI go to http://127.0.0.1:4601 once containers are started. If everything is OK, you'll see this interface:
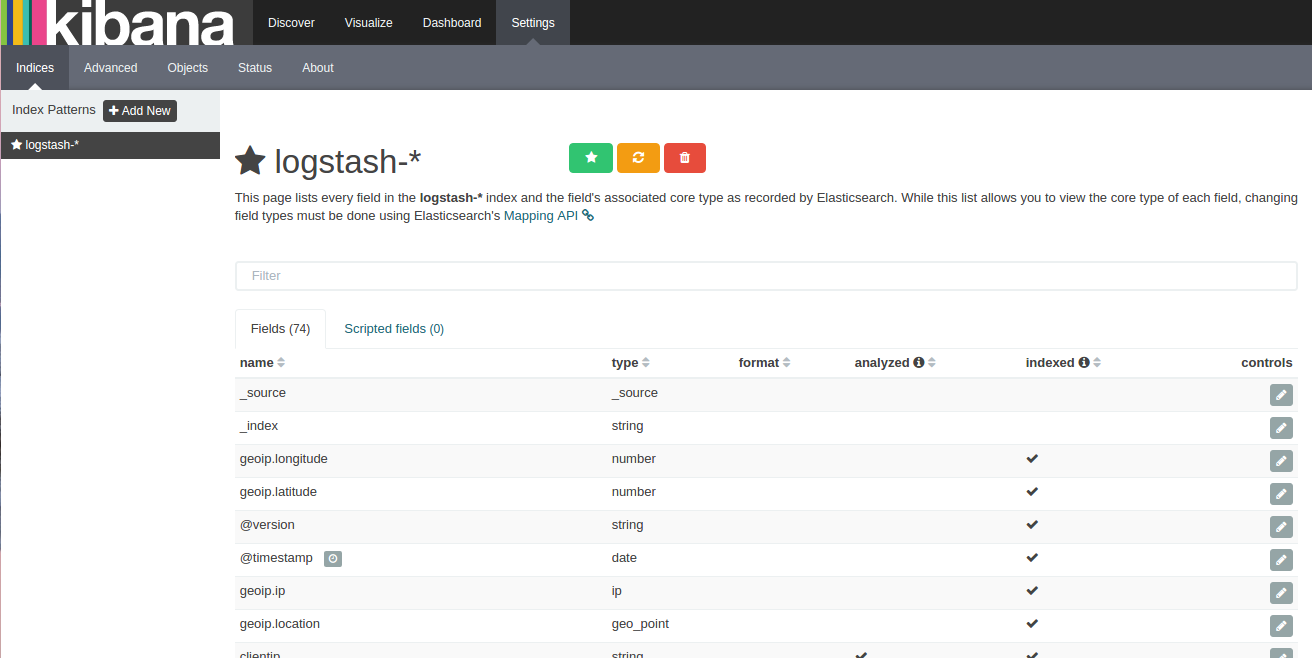
Click on the Create button because default configurations should be OK. You will then arrive on this screen:
You do NOT need to do anything here unless you are an advanced user. Once again default configurations will be OK to start.
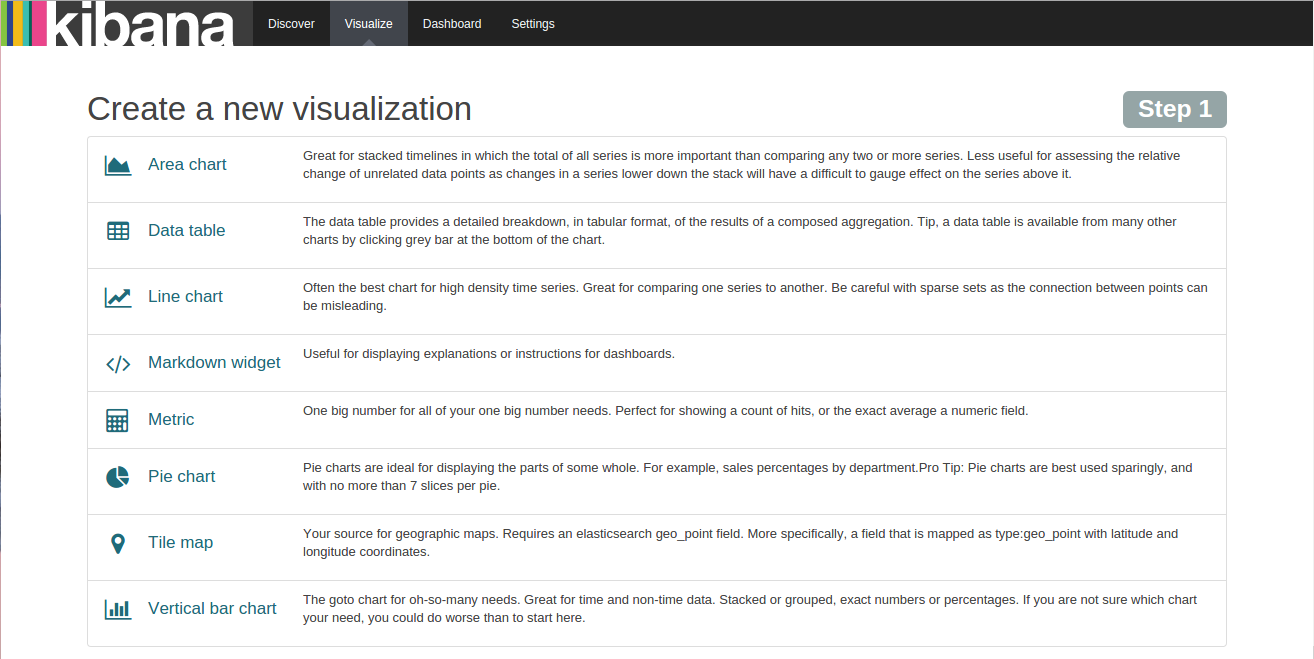
So go create your first visualization by clicking the Visualize section in the header.
I am gonna show you how to build your first (or two) dead simple visualizations here. Then will see how to add it (or them) in a dashboard.
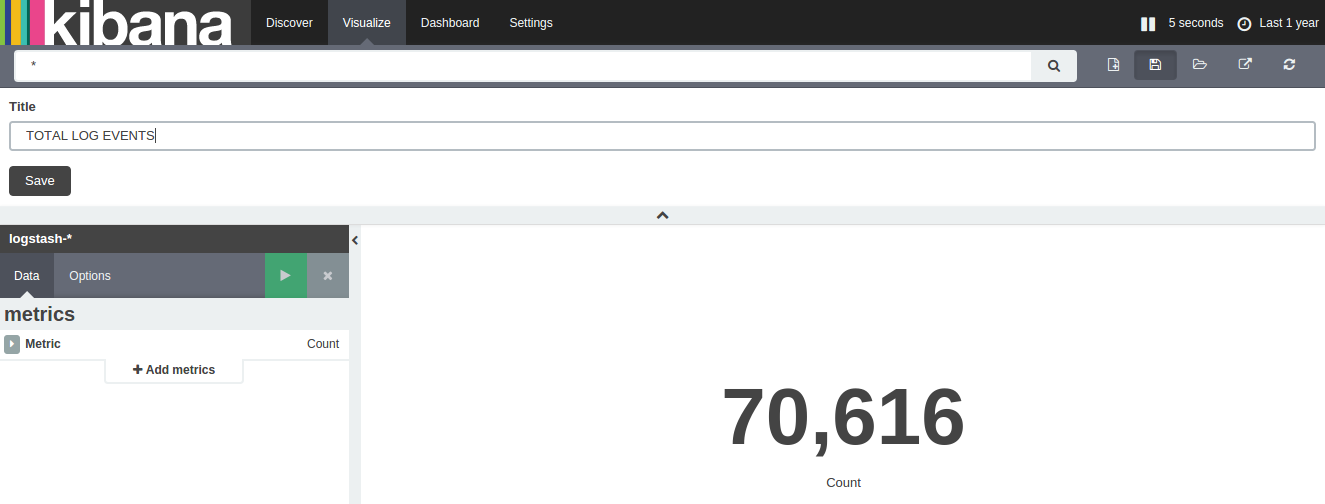
- Choose the type of vsualization you want => Choose Metric
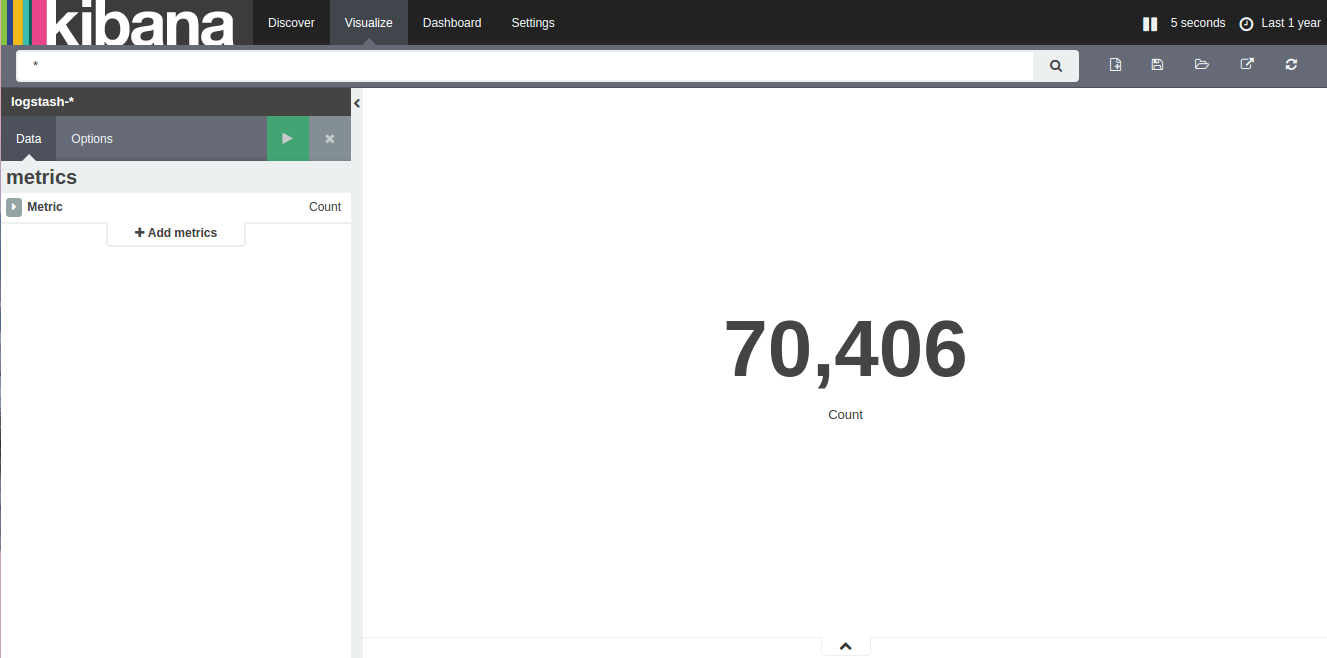
- Select a search source => Select From a new search
- The visualization screen, you can see the total number of log line in your logs files.
- Save this visualization clicking on the save button and give it a name.
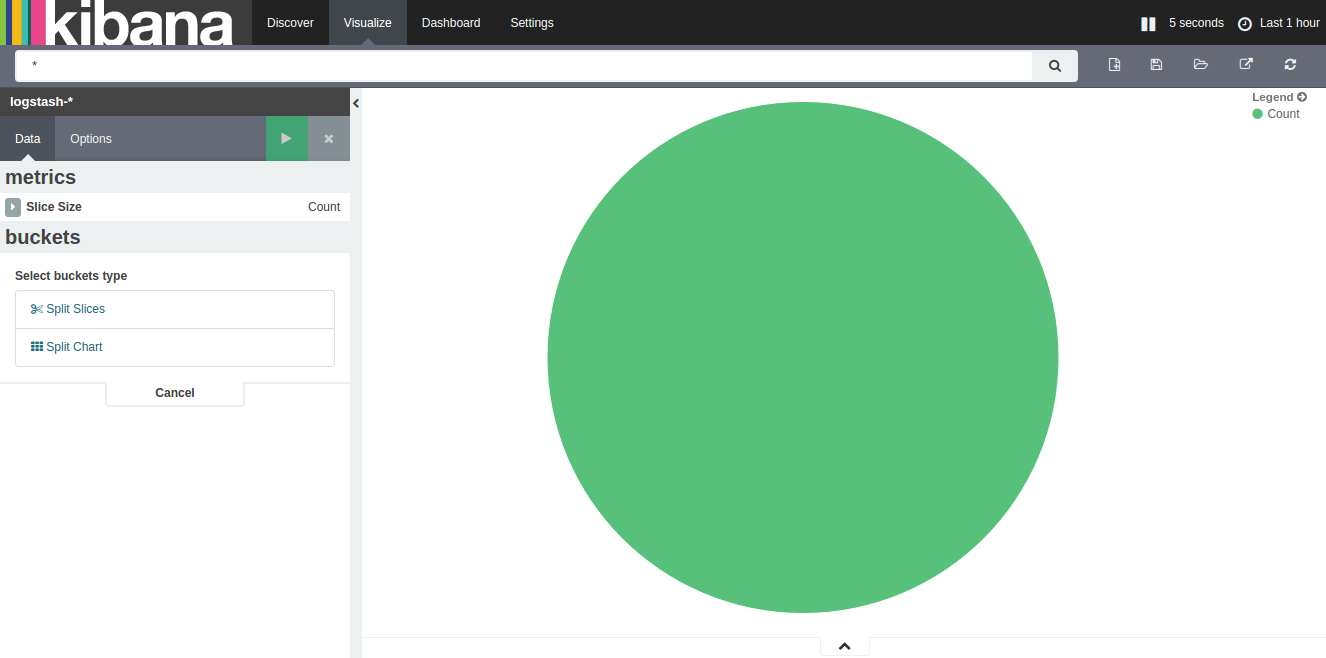
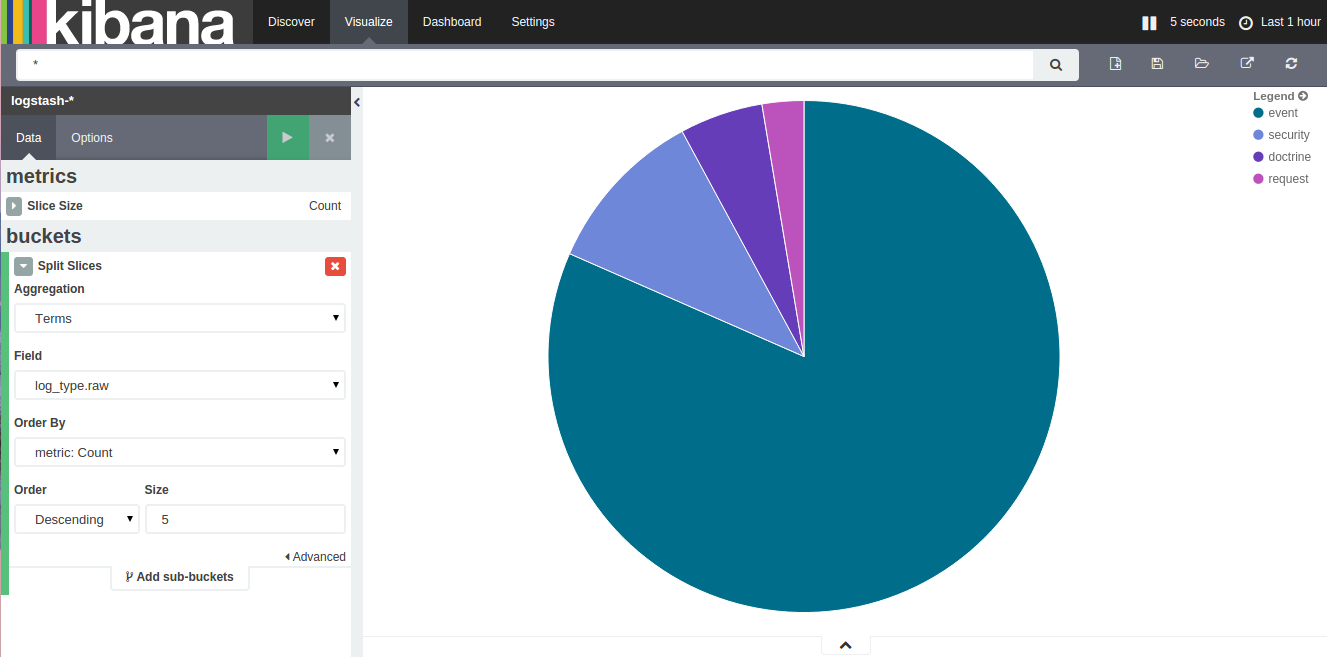
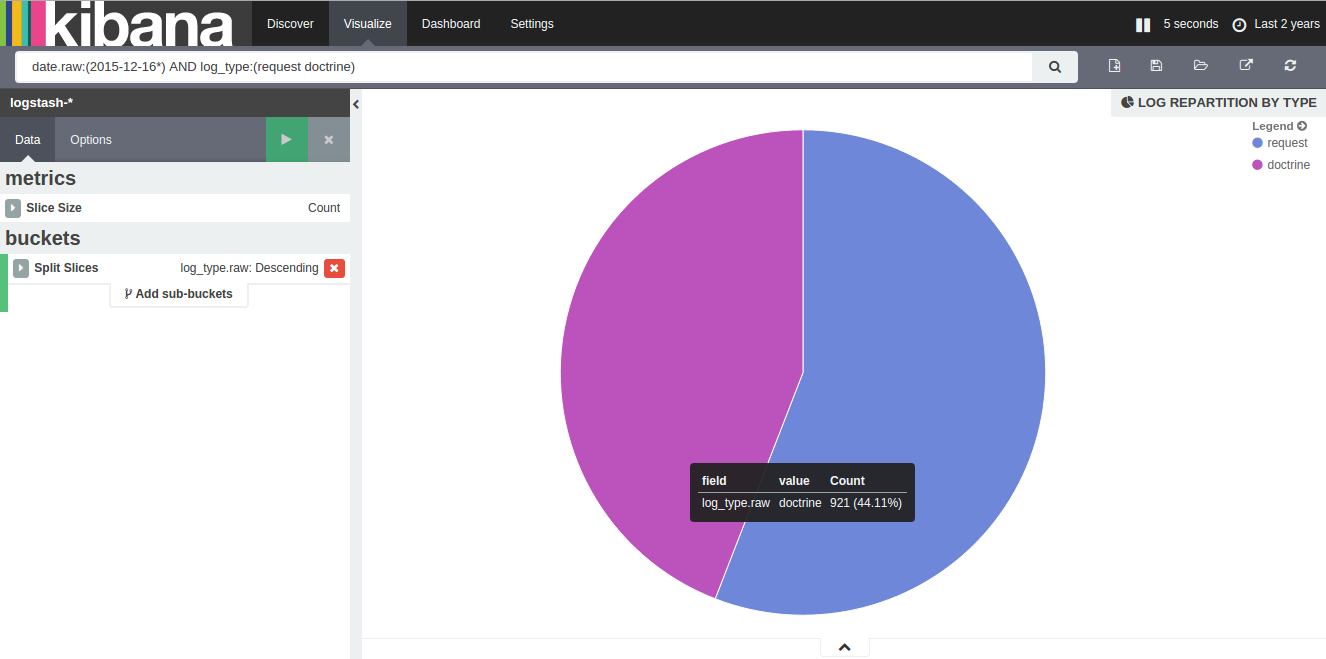
- Repeat the previous steps and choose a Pie chart visualization type
- Add an aggregation configuration to have a repartition by log types (request, doctrine,...)
- Save this visualization clicking on the save button and give it a name.
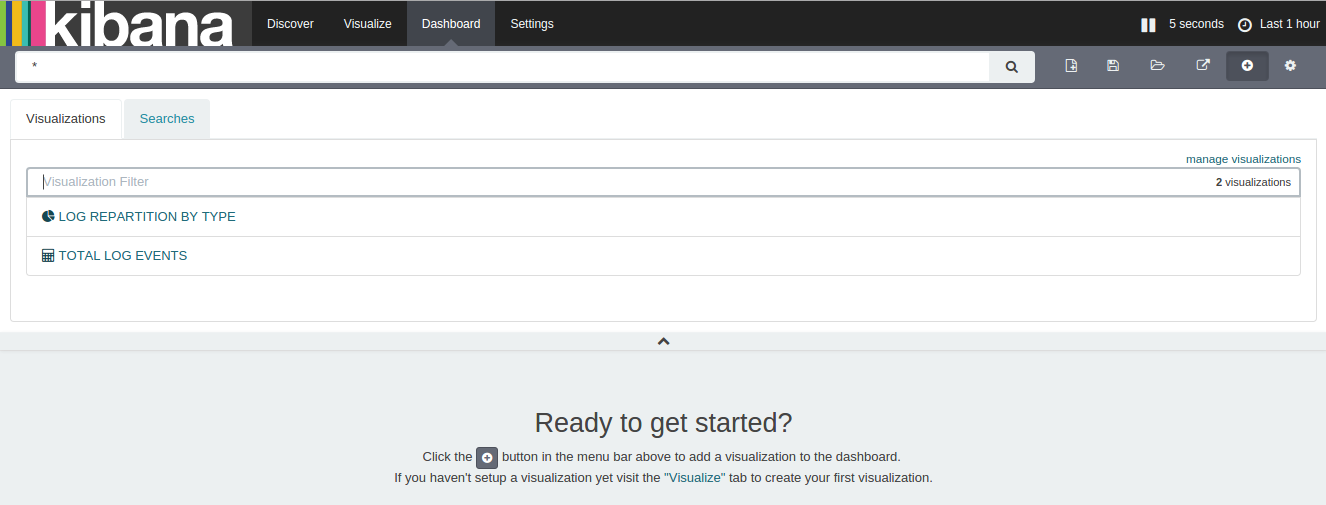
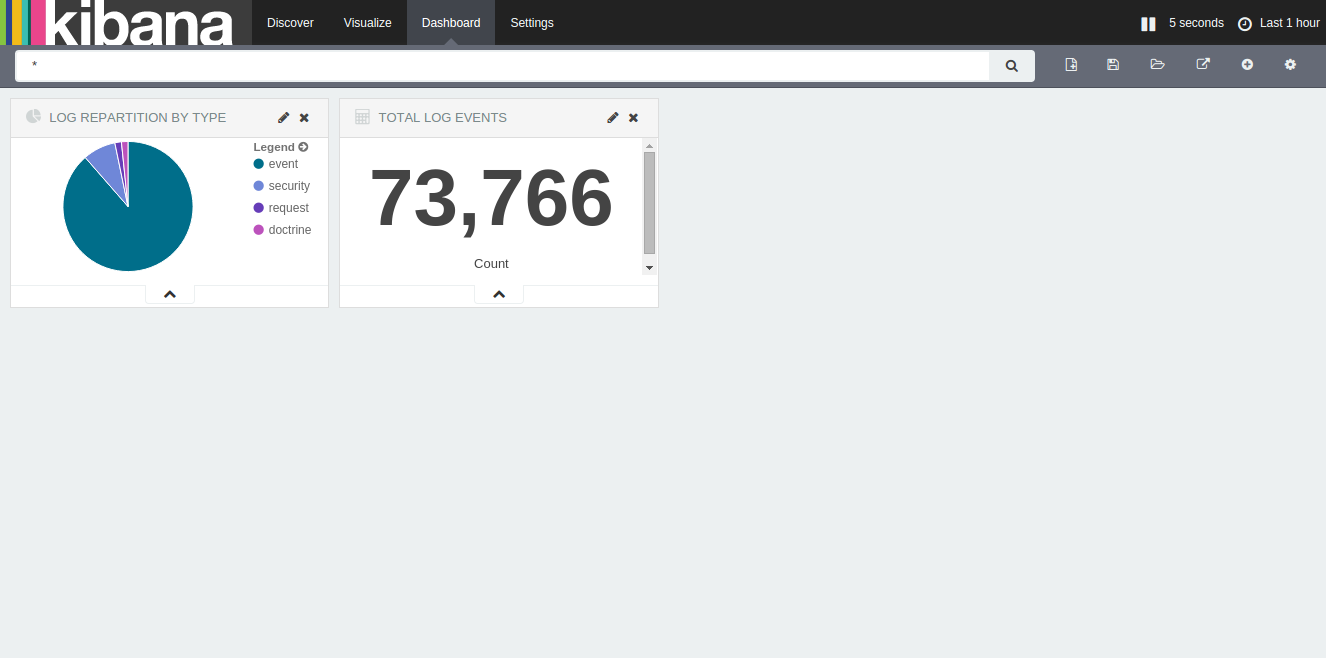
- Click on the Dashboard section in the header, then on the Add visualization button (+)
- Add the previously saved visualizations
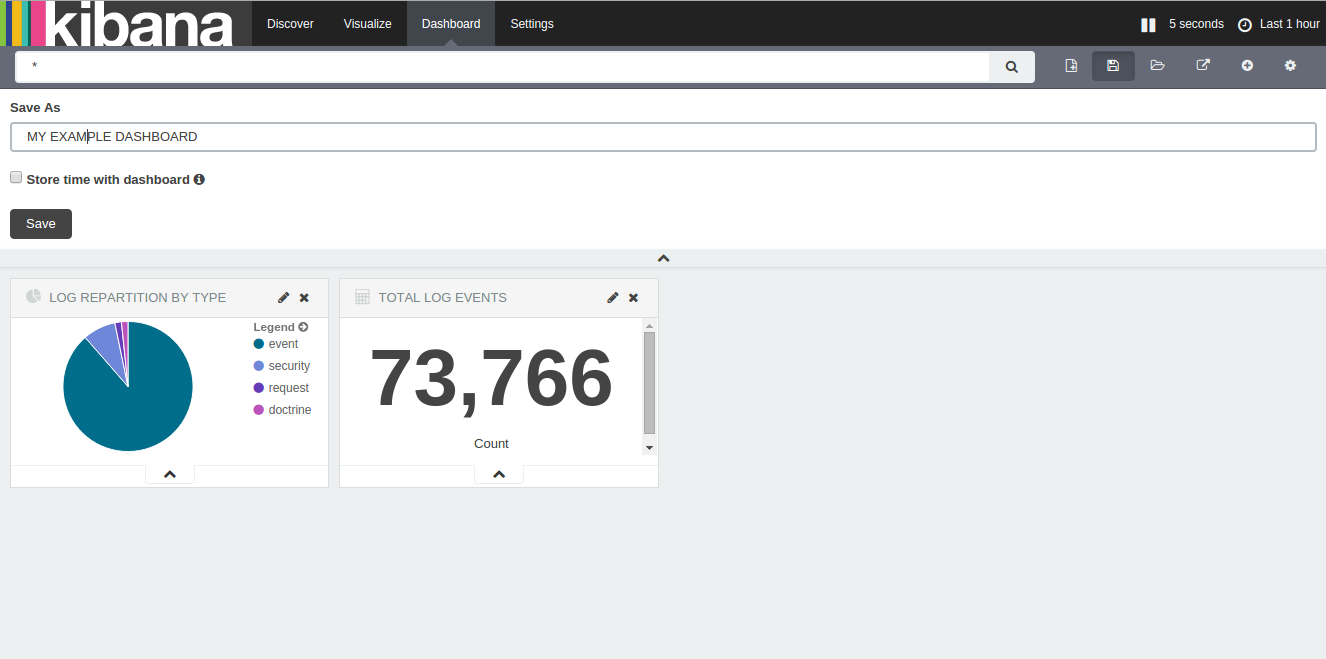
- Save your dashboard
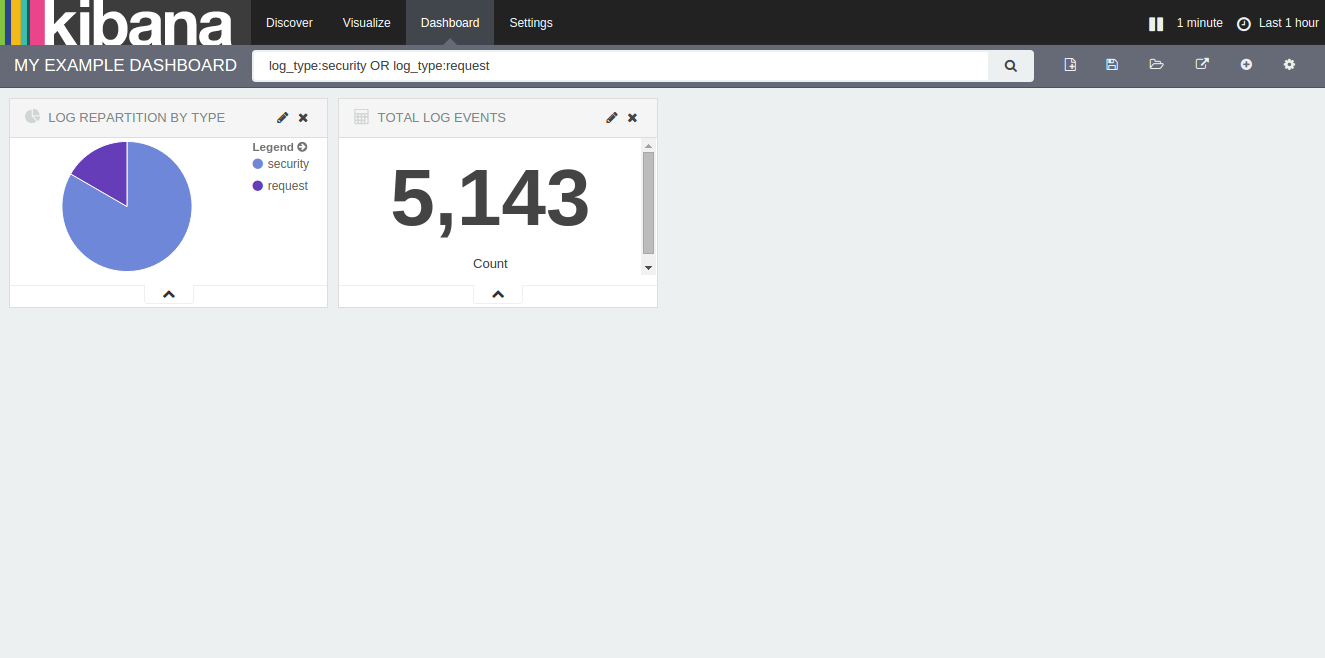
On visualizations and on dashboard you can use Query string query to build filters and more complex monitoring.
- The input field for Query String Query
- Visualisation filters
- Dashboard filters
