This is a competition from Kaggle, predicting if the client would default or not.
Data source: Home Credit Default Risk.
📦Home_Credit_Default_Risk
 ┣ 📂images
 ┃ ┣ ...
 ┣ 📂submissions
 ┃ ┣ ...
 ┣ 📜Part1_Introduction_and_EDA.ipynb
 ┣ 📜Part1_Introduction_and_EDA.pdf
 ┣ 📜Part2_Data_Cleaning_and Feature_Engineering.ipynb
 ┣ 📜Part2_Data_Cleaning_and Feature_Engineering.pdf
 ┣ 📜Part3_Model_Training.ipynb
 ┣ 📜Part3_Model_Training.pdf
 ┣ 📜test_CatBoost.ipynb
 ┣ 📜test_CatBoost.pdf
Content:
Part1_Introduction_and_EDA.ipynbPart2_Data_Cleaning_and Feature_Engineering.ipynbPart3_Model_Training.ipynb- Results Summarization
test_CatBoost.ipynb- GPU Training:
Inlcudes introduction and exploratory data analysis.
1. Defining utility functions
2. Exploratory Data Analysis (EDA)
    2.1 application_train.csv and application_test.csv
        2.1.1 Basic Stats
        2.1.2 NaN columns and percentages
        2.1.3 Distribution of target variable
        2.1.4 Phi-K matrix
        2.1.5 Correlation matrix of numerical features
        2.1.6 Plotting distribution of categorical variables
        2.1.7 Plotting distribution of Continuous Variables
    2.2 bureau.csv
    ...
    2.3 bureau_balance.csv
    ...
    2.4 previous_application.csv
    ...
    2.5 installments_payments.csv
    ...
    2.6 POS_CASH_balance.csv
    ...
    2.7 credit_card_balance.csv
    ...
3 Conclusions From EDA
Comments:
- For each table, we will first check basic stats like the number of records in tables, number of features, number of NaN values, etc.
- Next, we will explore some of the features with respect to the target variable for each table. We will be employing the following plot:
- For
categorical features, we will mostly use Bar Plots and Pie Charts. - For
continuous/numeric features, we will use Box Plots, PDFs, CDF and Violin Plots.
- For
- Phi-K matrix can calculate relations between categorical features
Includes data cleaning and feature engineering.
1. Defining Utility Functions and Classes
2. Data Clearning and Feature Engineering
    2.1 Preprocessing Tables
        2.1.1 bureau_balance.csv and bureau.csv
        2.1.2 previous_application.csv
        2.1.3 installments_payments.csv
        2.1.4 POS_CASH_balance.csv
        2.1.5 credit_card_balance.csv
        2.1.6 application_train and application_test
    2.2 Merging all tables
3. Feature Engineering more
4. Feature selection
    4.1 Looking for empty features
    4.2 Recursive feature selection using LightGBM
    4.3 Saving Processed Data
Comments:
- Defining function to change datatype to reduce memory usage
- For each table, cleaning outliers, replacing NaN values and any other necessary operation based on discovery in EDA..
- Creating new features based on domain knowledge, interactions between different tables.
- Dropping features which only has one unique value, selecting useful featuers with LightGBM recursively.
Inlcudes data modeling and scores.
Some models: Random Forest, LightGBM, XGBoost, etc. are used to make better prediction.
1. Defining Utility Functions and Classes
2. Modelling
    2.1 Random model
    2.2 Dominant class model
    2.3 Logistic Regression L2 Regularization
    2.4 Linear SVM
    2.5 Random Forest Classifier
    2.6 ExtraTreesClassifier
    2.7 XGBoost GPU
    2.8 XGBoost GPU on Reduced Features
    2.9 LightGBM
    2.10 Stacking Classifiers
    2.11 Blending of Predictions
3 Results Summarization and Conclusion
Comments:
- Training
random modelas benchmark - Training
Logistic Regression with L2 Regularization model,Linear SVM model,Random Forest Classifier model, tuning hyperparamers withRandomizedSearchCVmethod. - Training
XGBClassifier modelon GPU,XGBClassifier model with reduced featureson GPU,LightGBM model, tuning hyperparamers withBayesianOptimizationmethod - Stacking previous trained model as
Stacking Classifier, blending the predictions from previous trained models with their normalized coefficient. - Comparing all submitted scores as below:
Includes the training of CatBoostClassifier Model on GPU
1. Test CPU
2. Boosting method
3. Test GPU
4. Grid search
5. Hyperparameter tuning on GPU
Comments:
- Training
CatBoostClassifier modelwith CPU, which is very slow. - Training
CatBoostClassifier modelwith defined Boosting class. - Training
CatBoostClassifier modelwith GPU, which is 10* faster than CPU method (This is a small case, for large case, the speed improvment is much obvious). - Tried to apply
RandomizedSearchCVwithCatBoostClassifier GPU model, the kernel kept dying. - Tried to apply
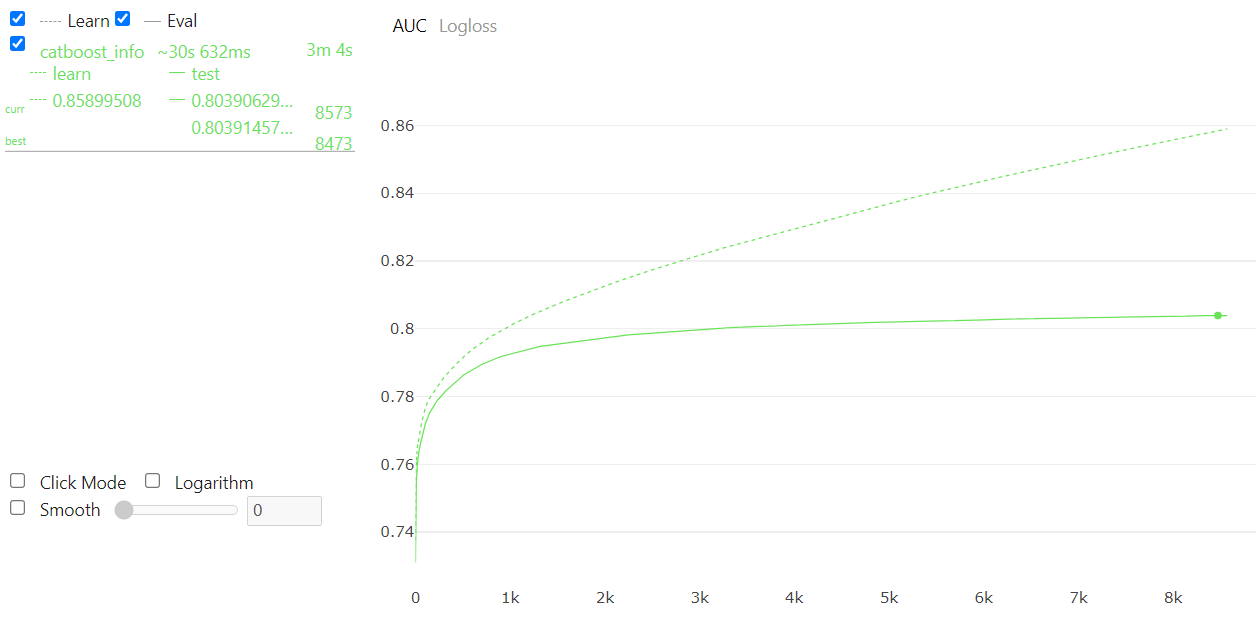
BayesianOptimizationwithCatBoostClassifier GPU model, the kernel kept dying. CatBoosthasplotmethod, which can visualize the evolution of evaluation metric.
Hyperparameter tuning is very time consuming.
From the data modeling,
XGBoostis the most easiest model to train on GPUCatBooststill has many bugs, the documents are imcompleteLightGBM's CPU version and GPU version are total different, it's hard to install GPU version on Windows- The time cost to train
RandomForestClassifierwas 3 hours. One alternative is usingcuMLwhich is developed byRAPID.ai.

