
![]()


StatisticsView IntelliJ plugin allows for the tracking of IDE code browsing actions and displays summarized statistical data (such as the frequency of file openings) on the Project view within the IDE.
Its purpose is to offer valuable insights into the productivity of IDE users, as well as allow for data analysis and visualizations based on the raw event logs.
Additional details can be discovered on GitHub.

There is a backstory behind the creation of the StatisticsView plugin: docs/README.md
- StatisticsView can be installed from an IntelliJ IDE via
Settings | Plugins. See the detailed instructions from the JetBrains guide. - Alternatively, download the latest plugin zip file from the GitHub release and install manually via
Settings | Plugins | Install plugin from disk
The Project tool window now includes a title bar button through the plugin. This button presents a range of menu options, including:
- Enable Logging: Enables/disables logging for the current IDE project. The button shows the current state of logging, so users don't have to worry about logging running in the background without their knowledge.
- Project View:
- Show File Statistics: Displays/hides aggregated statistical information about each file, such as "Last viewed" summaries and the total time viewed. Duration times are not accounted for when the IDE frame is deactivated.
- Show Directory Statistics: Shows the percentage of viewed files in each directory.
- Hide Viewed Files: Hides viewed files and empty middle directories from the Project view.
- Statistics Data:
- Clear Statistics Data: Clears old raw events and pre-aggregated results for the current project. Note that this operation is unrecoverable.
- Show Data File: Locates the current project's event log file in Finder/Explorer.
The StatisticsView plugin draws inspiration from the activity-tracker and certain components of the intellij-community project. In addition to event tracking, this plugin offers real-time analytical capabilities that are seamlessly integrated with the IDE, such as supplementary information in the Project view.
StatisticsView subscribes to a range of IDE events including file opening, code completion, jumping to definition and more, using listeners provided by the IntelliJ Platform.
The current version (1.0.0) of StatisticsView is limited to handling events related to opening/closing files and activating/deactivating the IDE.
Whenever an event is received, StatisticsView records the event type, timestamp, and fileUri (only if the event is file related). StatisticsView won't process events for files that are not valid source files (e.g. binary files, library folders, intentionally "marked as excluded" directories would be ignored).
To minimize dependencies, StatisticsView directly stores events onto a disk file. However, this approach has limitations that may prevent complex queries on file-based datasets, such as filtering by time range or grouping by directory. As we must display summarized information in real-time within the IDE Project view, queries can only be executed on pre-aggregated data structures stored in memory.
After debounce and deduplication, the write load is not very high, with a maximum of 10+ writes per second. Events can be safely queued and periodically saved to disk in a background thread without affecting the performance of the IDE.
The practice of using a pre-aggregated hashMap and an asynchronous file writer is not capable of handling back-filling scenarios. For instance, if a user renames a file in the IDE, events with the previous fileUri need to be modified.
If you plan on collecting event logs for an extended period, it is recommended that you transfer the raw data to an external data storage system (such as TSDB) and conduct analysis on it offline.
As of version 1.0.0, events are serialized into JSON string format, but this may be subject to revision in upcoming releases.
JSON serialization is picked by its simplicity (provided by kotlinx.serialization API out-of-box), and it can be easily parsed line by line using shell scripts.
Example of log file:
{"ts":1661075776169,"action":"IDE_ACTIVATED","file":"","tags":{}}
{"ts":1661075789662,"action":"FILE_OPENED","file":"/README.md","tags":{"FILE_LINE_OF_CODE":"14"}}
{"ts":1661075798429,"action":"FILE_CLOSED","file":"/README.md","tags":{"FILE_LINE_OF_CODE":"14"}}
{"ts":1661075798429,"action":"FILE_OPENED","file":"/src/main/kotlin/org/yh/statistics/listener/MyFileEditorManagerListener.kt","tags":{"FILE_LINE_OF_CODE":"49"}}
{"ts":1661075799293,"action":"FILE_CLOSED","file":"/src/main/kotlin/org/yh/statistics/listener/MyFileEditorManagerListener.kt","tags":{"FILE_LINE_OF_CODE":"49"}}
{"ts":1661075839459,"action":"FILE_OPENED","file":"/src/main/kotlin/org/yh/statistics/view/MyViewTreeStructureProvider.kt","tags":{"FILE_LINE_OF_CODE":"43"}}
{"ts":1661075841073,"action":"FILE_CLOSED","file":"/src/main/kotlin/org/yh/statistics/view/MyViewTreeStructureProvider.kt","tags":{"FILE_LINE_OF_CODE":"43"}}
{"ts":1661075841073,"action":"FILE_OPENED","file":"/src/main/kotlin/org/yh/statistics/view/MyViewNodeDecorator.kt","tags":{"FILE_LINE_OF_CODE":"71"}}
{"ts":1661075850804,"action":"IDE_DEACTIVATED","file":"","tags":{}}
- Will enabling logging all the time cause a slower IDE startup?
- No. Long-running & IO-bound tasks (e.g. serialize/deserialize events data, R/W log file) are executed on the pooled thread and will not affect the IDE responsiveness. You can check the startup cost for plugins using the IntelliJ IDE's built-in diagnostic tools:
IDE Help | Diagnostic Tools | Analyze Plugin Startup Performance: -
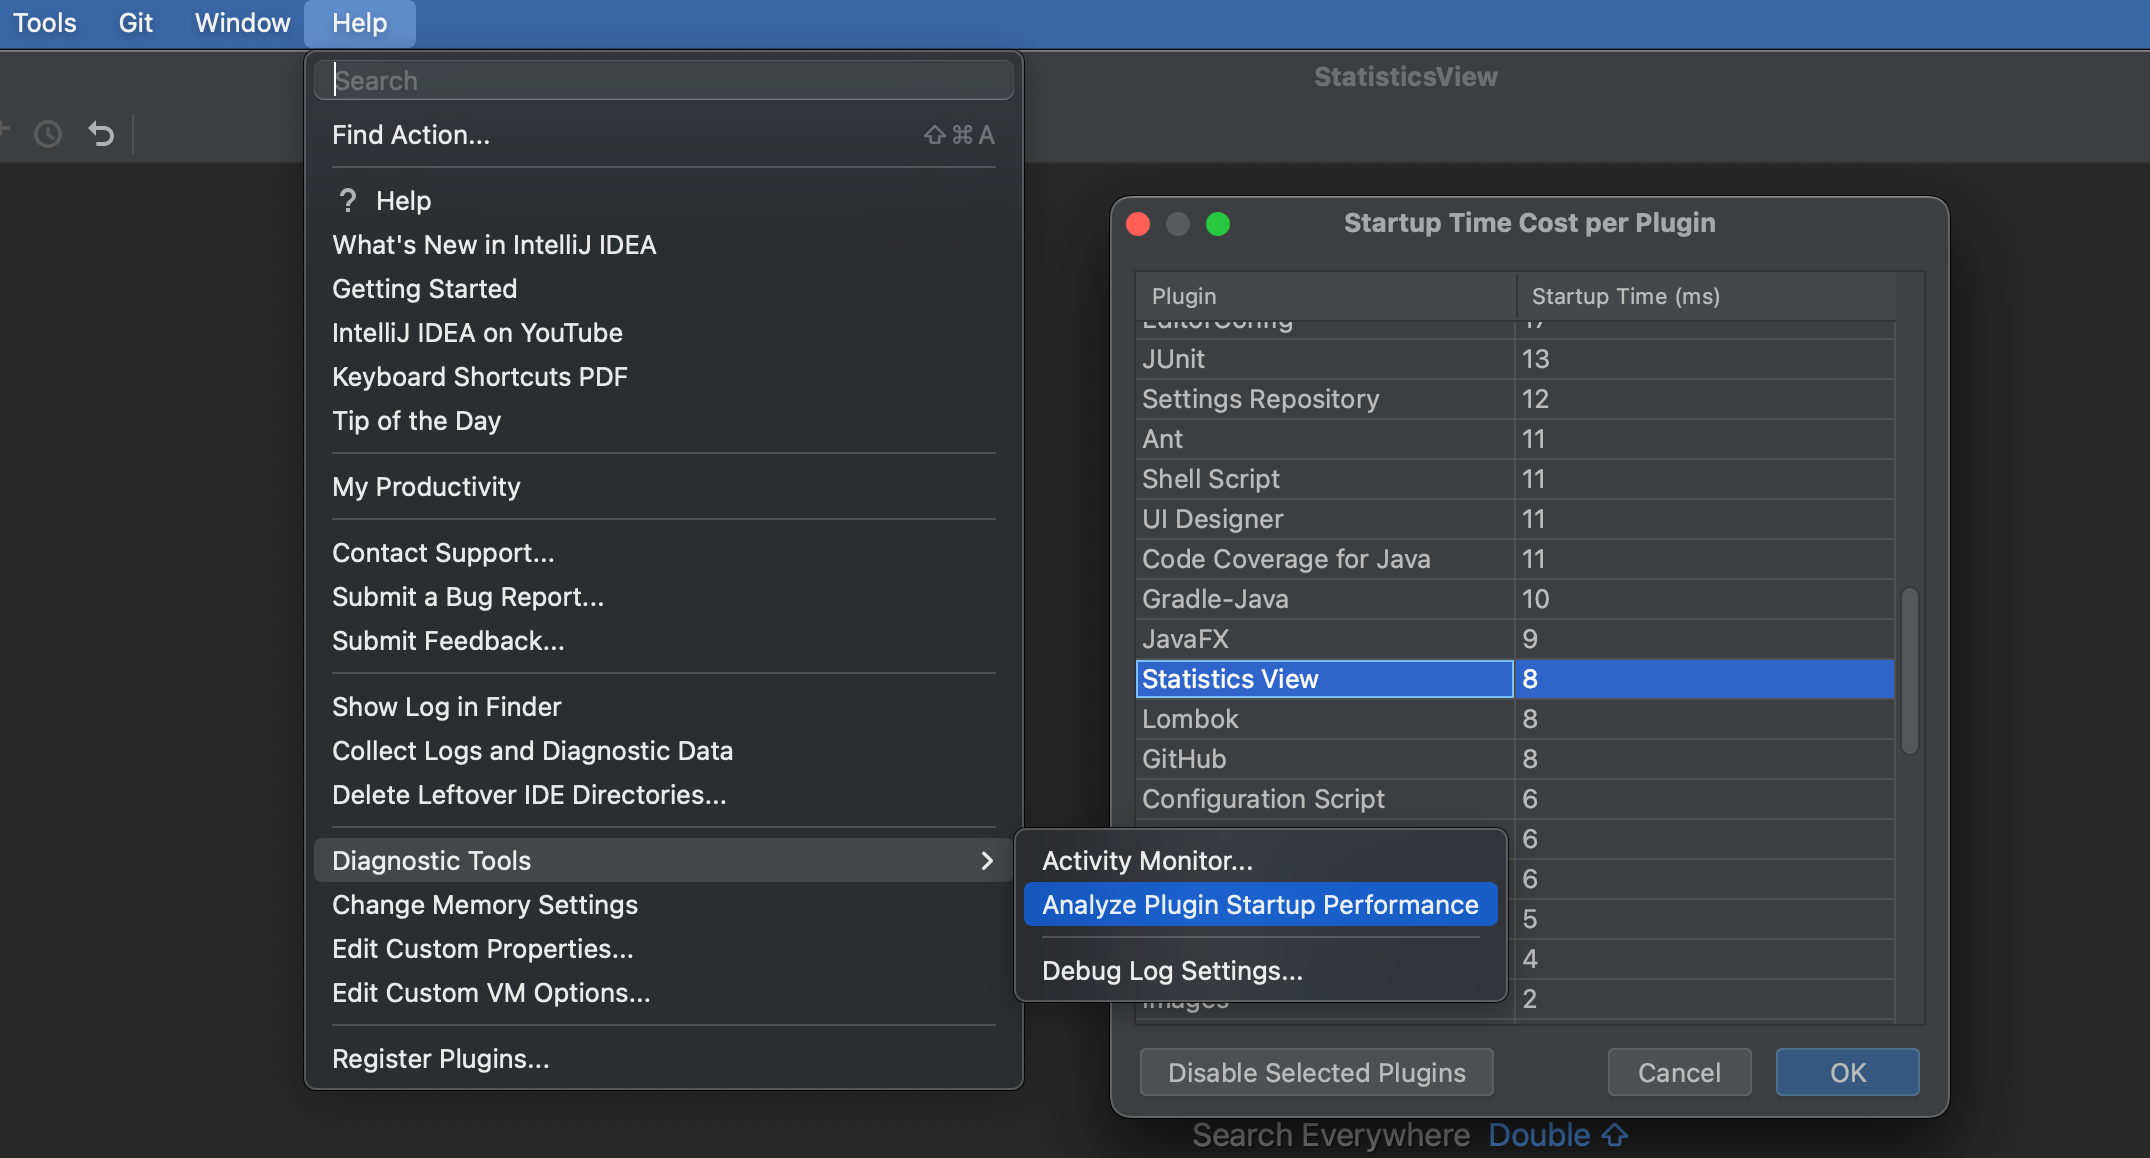
- The handling of IDE events occurs on the event dispatch thread (EDT), which avoids blocking the UI thread.
- No. Long-running & IO-bound tasks (e.g. serialize/deserialize events data, R/W log file) are executed on the pooled thread and will not affect the IDE responsiveness. You can check the startup cost for plugins using the IntelliJ IDE's built-in diagnostic tools:
- As events continue to pile up, will they consume my memory?
- The raw events are queued in memory and written to the disk file periodically, and once the writing is done, they are cleared from the queue and got garbage collected.
- The sole drawback to performance comes from using the
Show File Statistics/Show Directory Statisticsoptions, which display statistical data alongside file and directory nodes in the Project view. While ProjectView rendering typically occurs quickly, large projects with many files may experience a noticeable delay. If you encounter sluggishness in the Project view, simply disable the statistical options and re-enable them when you require the data.

- Where can the raw event log be found?
- The raw event log (
stat.log) is saved in the project.ideafolder, and IDE doesn't need your permission to read/write from somewhere other than the current project's folder. It's by nature project-wide, and you won't bother cleaning up the log once you delete the IDE project. It would also be less likely to mess up your VCS since most projects'.ideafolder is already ignored.
- The raw event log (
- Is it secure to share the log file with another person?
- Certainly. No personal identification details (such as username or hostname) are recorded, and all
fileUriare preserved as relative paths from the project's root.
- Certainly. No personal identification details (such as username or hostname) are recorded, and all
- Is there any telemetry or data reporting?
- Absolutely not, and it will never happen.
Note: Most of this section is not directly relevant to the responsibilities of the StatisticsView plugin. However, there are significant similarities between the concepts of microservices observability and monitoring IDE code activities.
checkout data-analysis-poc for a k8s manifest for importing event logs into PostgresSQL and visualizing in Grafana dashboard
