glass-computer-vision
A Java 12 Maven project with a Swing GUI using OpenCV to measure the relative quantity of a fluid contained in a glass.
Version: 1.0
Authors: Cyril Dubos, Thomas Jouen, Erwan Lacoudre and Yann Trividic
Context: This program was developed for the Licence 3 Image Processing course of the Université de Paris. The teacher for the course was Pr. Nicole Vincent.
License: MIT License
Contents
This repository contains three folders:
src, the source code of the project,img, three image sets (training, validation, test),doc, the Javadoc of the project, compiled into a set of HTML files.
The img folder was built for the occasion of this project by the students who attended the course. We decided to use this image set in its entirety. Out of the 73 original PNG or JPEG images, 53 glass images were used to build the train dataset, 10 were put both in the validation and in the test dataset. Those images all contain at least a glass. Some of them are blurry, other aren't filled with water, the lighting is uneven as well as the orientation. The glasses are of various shapes and made of different materials and colors. The background is almost never the same. Most pictures were taken in a kitchen setting.
Important: This folder also contains the gaussian_distribution.png file, which is critical for the program to work. Please keep it inside.
All the images of the set were labeled. In order to do so, we used labelme, an opensource annotation tool. Two labels were chosen: the ellipse (ellipse) of the water level and the outline of the glass (glass). The labels were saved as JSON files with the same name as their corresponding image, in the same folders.
The results.pdf file contains the results of our runs on our test dataset.

Minimum configuration required
For this project to run on your machine, you'll need to have installed Java SE 12.
Run the program
Once the JAR file is downloaded from the tags section of this page, open a terminal and change your directory to the folder where the file is. In this folder, you must have a img folder with the same architecture as described in the Contents section. You can of course use ours, but don't hesitate using your own pics with your own labels.
To run the file, execute the following command : java -jar glasscv-1.0.jar. By doing so, the program starts and loads the training dataset. You can change the image set by adding a parameter at the end of the command. Three possibilities are available : train for the training set, validation for the validation set, test for the testing set.
For example, if you want to see the unbiased results of our program, please use this command java -jar glasscv-1.0.jar test and see how we did for yourself.
User instructions
GUI
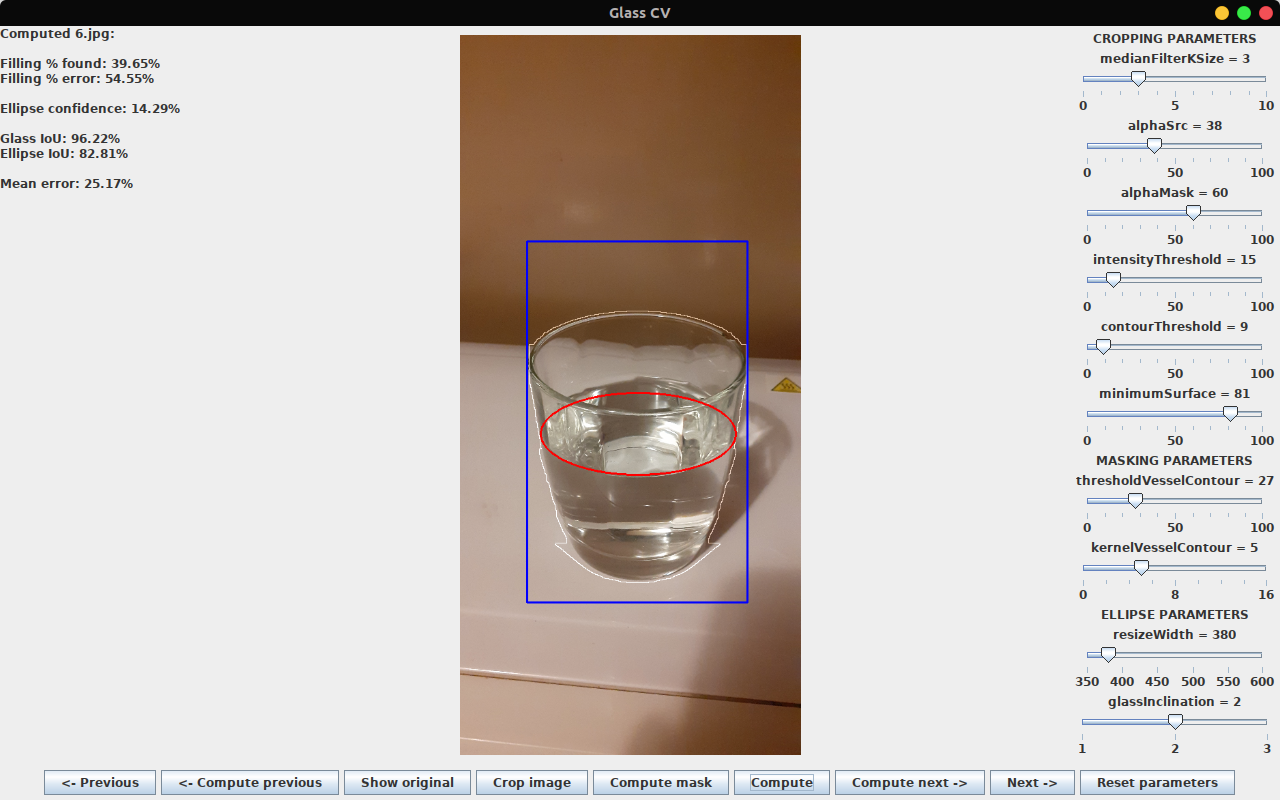
The program's window is divided in four parts:
- The left side of the window is where will be displayed textual information about the image currently selected and the extracted results,
- The center part holds the selected image and displays the resulting image after processing,
- The right side contains sliders that are parameters for our algorithms. Please refer to the code documentation to understand them fully.
- The bottom of the window contains the buttons that the user can click to compute the image or to change the selected image.
Changing the value of the sliders about the ELLIPSE PARAMETERS labels will result into the display of the intermediary process related to this parameter. For example, if the changes the value of one of the masking parameters' sliders, the new mask will be displayed directly. It implies that if the user wants to see the full result (ellipse and evalution) one of the Compute image buttons must be clicked.
Results
After processing, the results are displayed in the top left corner of the window.
The user can find, in this order, a series of quality indicators of the output:
- Filling percentage found: the evaluation of the water level uses the euclidean distance. In order to calculate the glass height, it first extracts the distance between the top and the bottom of the glass. To get the filling level, our algorithm finds the ellipse of the liquid inside the glass and its contours. It then calculates the distance between the bottom of the glass and the bottom of the ellipse.
- Filling percentage error: the filling percentage found is computed and compared to the one extracted from the labels.
- Ellipse confidence: in order to find the right ellipse, differents trials are initiated. The best results can be close to one another. When those results are two close, the confidence drops, as only the very best one is kept.
- Glass intersection over union: the IoU (or Jaccard index) of the found glass over the ground truth glass.
- Ellipse intersection over union: the IoU of the found ellipse over the ground truth ellipse.
- Mean error: mean error of the filling percentage, the glass IoU and the ellipse IoU. You will find in the file "Resultat Image" the results of the test set.
References
- Osadchy, Margarita, David Jacobs, and Ravi Ramamoorthi. 2004. “Using Specularities for Recognition” 2 (February). link.
- Eppel, Sagi, and Tal Kachman. 2014. “Computer Vision-Based Recognition of Liquid Surfaces and Phase Boundaries in Transparent Vessels, with Emphasis on Chemistry Applications.” ArXiv:1404.7174 (Cs) November. link.
- Eppel, Sagi. 2014. “Create a Curvature Factor Map for (Axisymmetric) Vessels Based on Their Outline in the Image.” n.d. Accessed May 17, 2021. link.