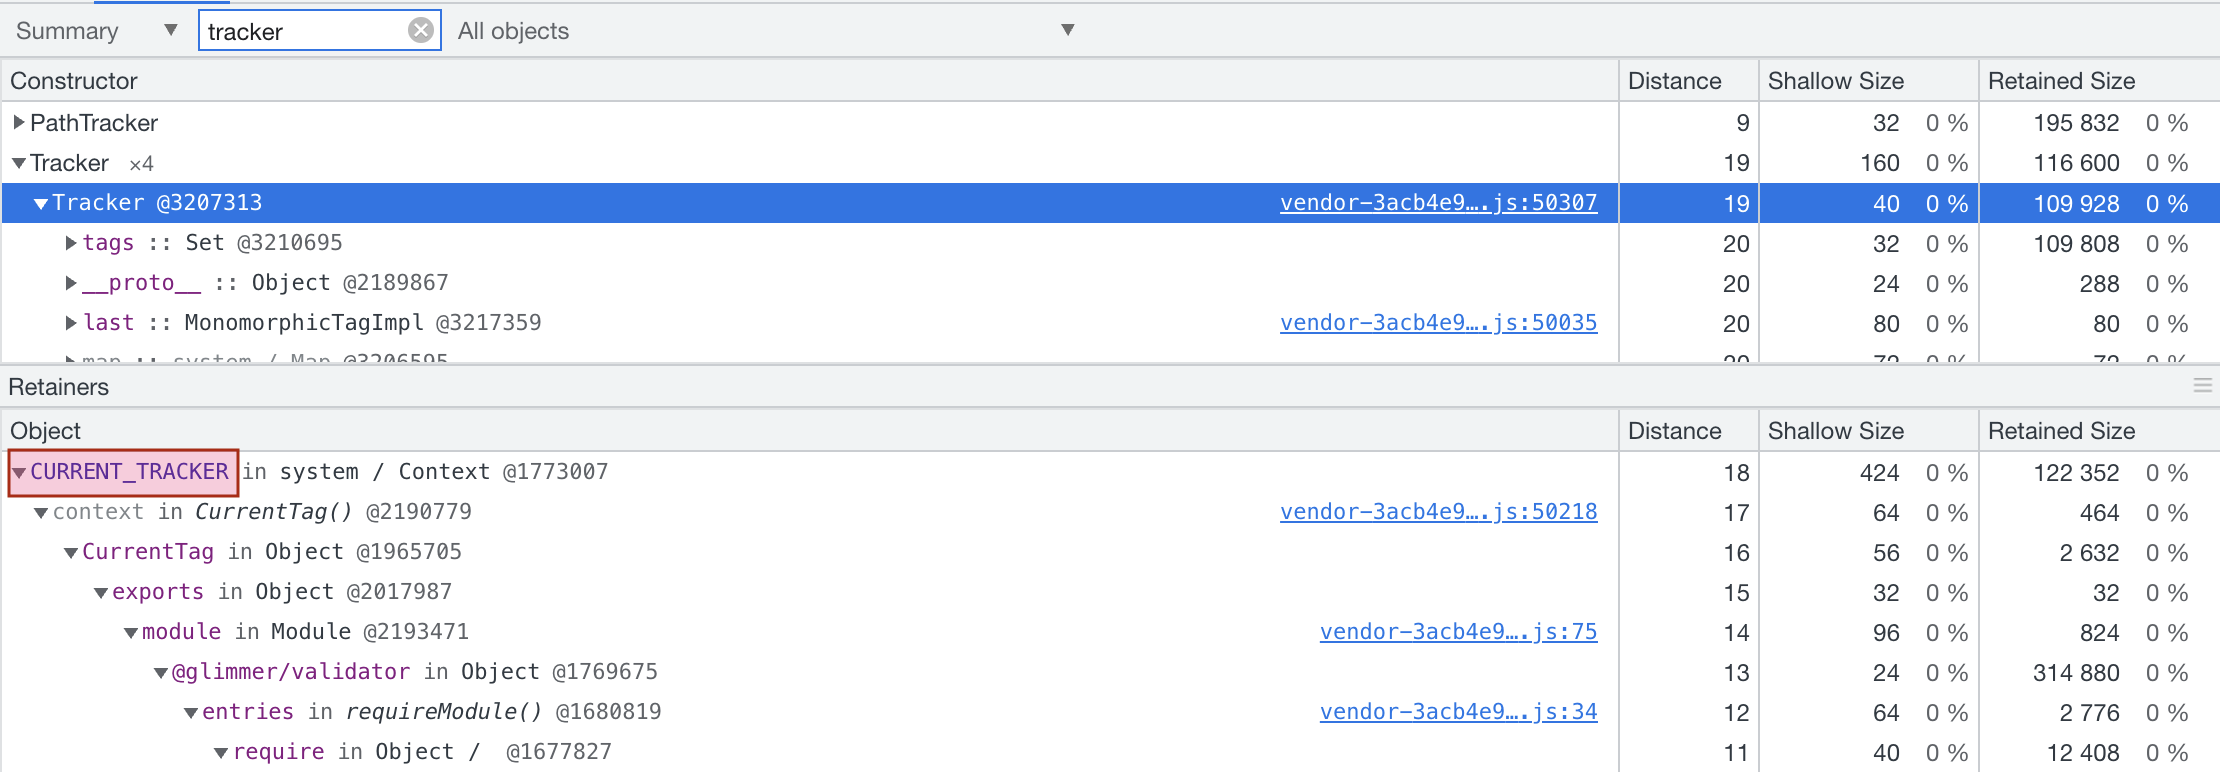
In a Fastboot SSR app, if there's an uncaught exception when a component is rendered on server side (e.g. error in the constructor or a getter), the CURRENT_TRACKER in @glimmer/validator will not be cleaned up / de-referenced properly. As a result, it won't be collected by GC and will keep consuming the Tags from subsequent rendering. It'll keep growing until the process is killed because of OOM.
I tried using Ember LTS (3.28) and latest (4.5). The issue exists in both versions.
yarn install.- Start the server with prod build and Node debugger:
node --inspect ./node_modules/.bin/ember s --environment=production. Dev build doesn't seem to have the same issue. - Visit http://localhost:4200.
- Open Chrome DevTools for Node.js.
- Take a heap snapshot (optional).
- Search for
Trackerin the "Class filter" input. You won't find anyTrackerin the snapshot.
- Search for
- Visit http://localhost:4200/leak in anonther browser tab, or click the link on the page and refresh the page. The route has to be loaded and rendered on server side in Fastboot.
- Visit http://localhost:4200/no-leak and refresh the page. You can refresh a few more times so the leak is a bit more obvious (I refreshed about 10 times before taking the snapshot in the screenshot below). You might not be able to tell there's a leak from the heap size itself, because this website is too simple.
- Take another heap snapshot.
- Search for
Trackerin the "Class filter" input. You'll find someTrackerobjects retained. Click on the one with the largest "retained size", and you'll find that isCURRENT_TRACKERin@glimmer/validator.
- Search for
