| File Name | File Type | Description | Link |
|---|---|---|---|
| Cat vs Dog BI Dashboard - Yahya Ansari.pbix | PowerBI File | Contains the PowerBi file for the dashboard | View |
| README.md | Markdown | The README file for the project | View |
| bi.gif | GIF Animation | A GIF animation of the BI dashboard | View |
| catsvdogs.xlsx | Excel File | An excel file containing the data used in the dashboard | View |
This repository contains the data file for a BI dashboard that displays the popularity of cats vs dogs in United States households.
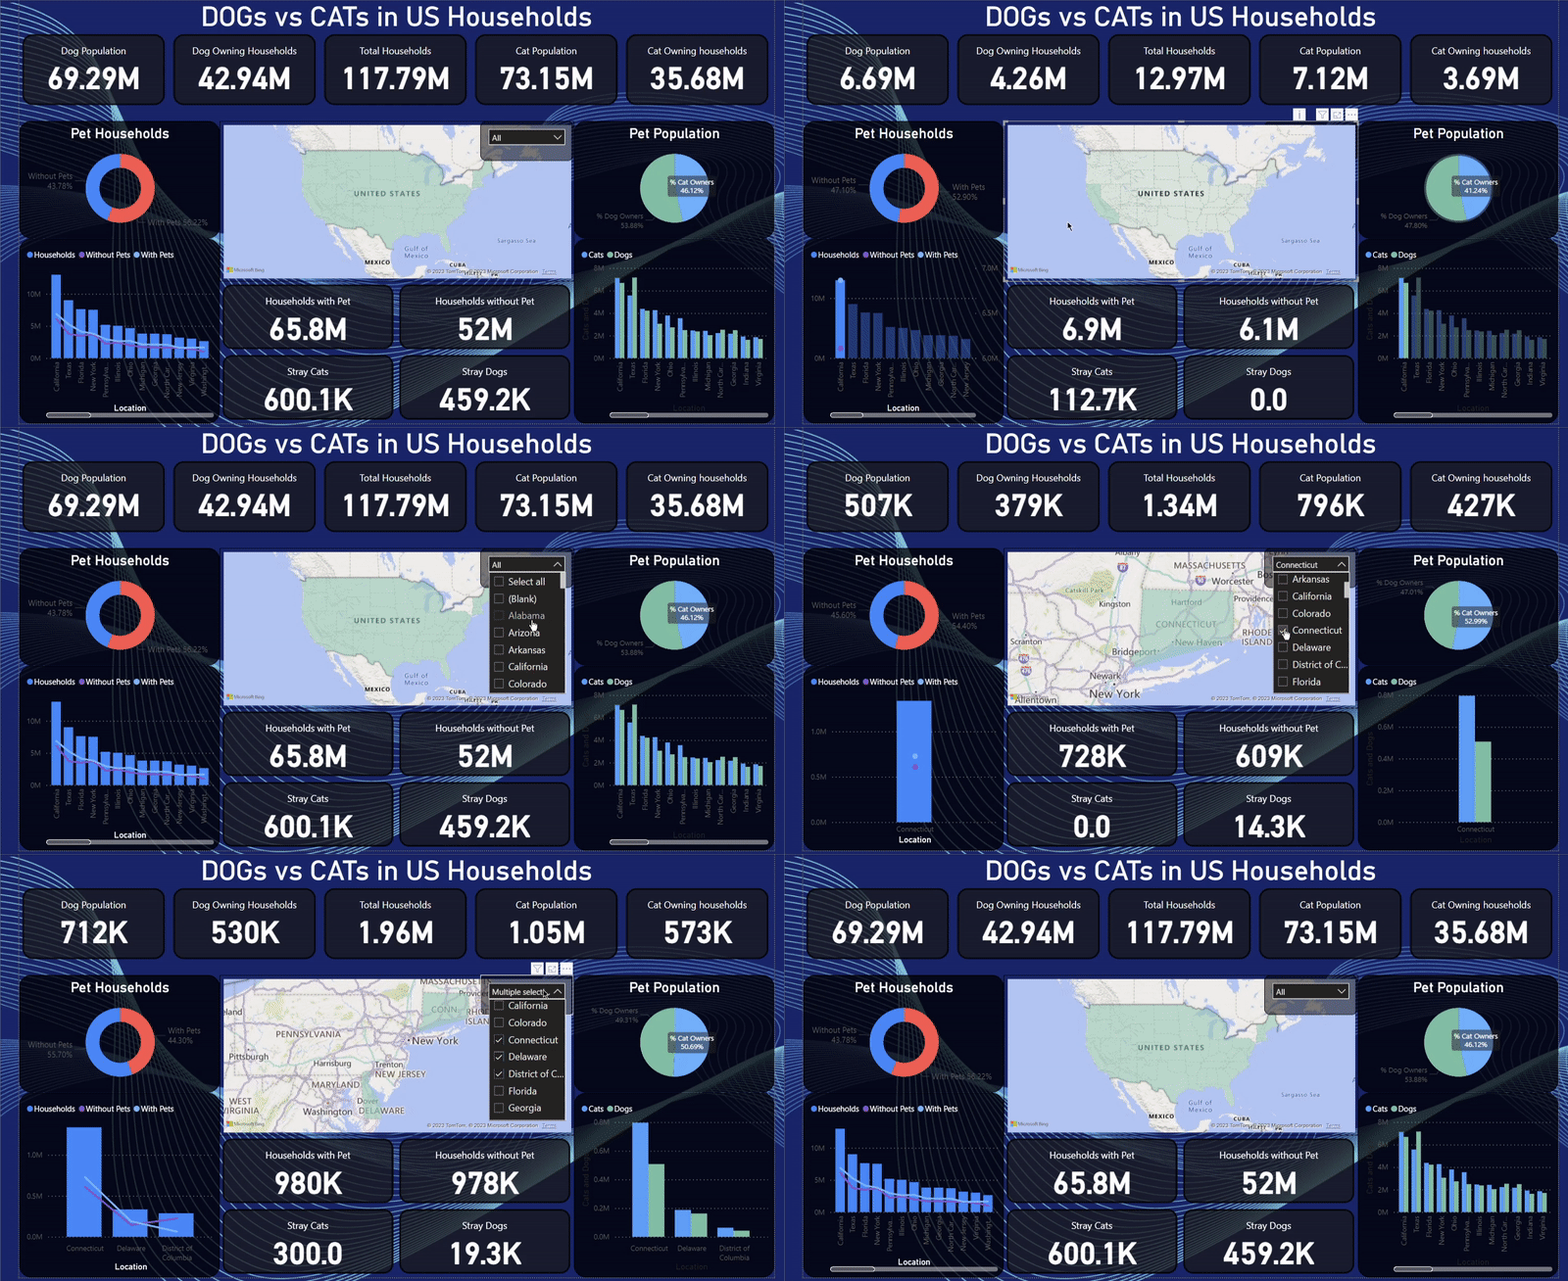
The dashboard displays various metrics and visualizations to compare the popularity of cats and dogs in US households. It includes multiple graphs and charts, including a bar graph, a pie chart, and a map of the United States.
- Interactive charts and graphs
- Useful metrics at a glance
- Easy to use interface and filters
The data used in this dashboard is stored in the excel file of this repository. The data includes various metrics such as the number of pet dogs and cats in US households, as well as their distribution across different regions of the United States.
To use this dashboard, clone this repository, install Microsoft Power BI and open the file with extension .pbix. Simply navigate to the main page and interact with the charts and graphs. You can filter the data by states from the dropdown filter or by clicking on the state on map.
I hope you find this dashboard useful and informative. If you have any questions or feedback, please feel free to open an issue or submit a pull request.
