Data Analysis
Statistical Data Analysis Technique using R
Generalized Estimating Equation (GEE)
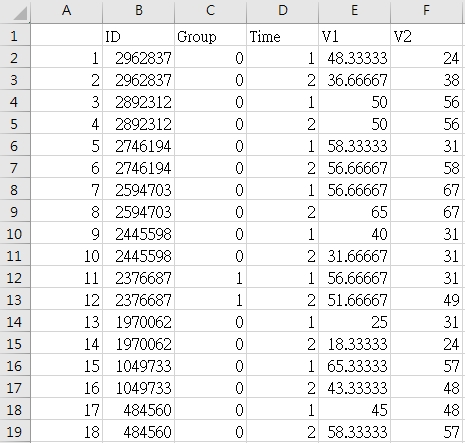
Changing original data to GEE data using code "GEE.R".
- Remember to read the original format of data "O.csv".
- You should change your name of repeat measurement variable into variable1, variable2 which means the first measurement of variable and the second measurement of variable.(For example: Mr. Lin got 90 and 95 in the pre-test and post-test, you'll need to set the data format into score1 = 90, score2 = 95...etc.)
- You should modify the code if you have more than 2 repeat measurement variables (2 variables are preset).
Multi-Linear Regression
"Multi_Regression.R" is used for linear regression modeling(multi-variable are allowed), under the circumstance of analysing the same independent variables but different dependent variables. You could organize the table result in a short time by using our function.
- Remember to read the original format of data "Regression.csv".
- You should enter your dependent and independent variables.
- Our example shows a LR result of "V1 ~ Sex + Age + Group + Hypertension", "V2 ~ Sex + Age + Group + Hypertension", "V3 ~ Sex + Age + Group + Hypertension".
- The table maily shows the result of 'Group'(which explained the difference between case group & control group, we did not show the result of the adjusted variables) in 3 models contains mean and SD of group1&2, unstandardize beta, p value, 95% CI, Rsquare, Adj-Rsquare.
Batch Data Reading and Concatenating
Read and concatenate all the data in a folder using code "Folder_data_concat.R".
- All the columns(variables) in the folder data should need the same (different columns for different data binding are not allowed).
Propensity Score Matching (PSM)
Matching case/ control using code "PSM.R". A common statical solution in matching case and control in a set up ratio. PSM attempts to reduce the bias due to confounding variables that could be found in an estimate of the treatment effect obtained from simply comparing outcomes among units that received the treatment versus those that did not. Paul R. Rosenbaum and Donald Rubin introduced the technique in 1983.

