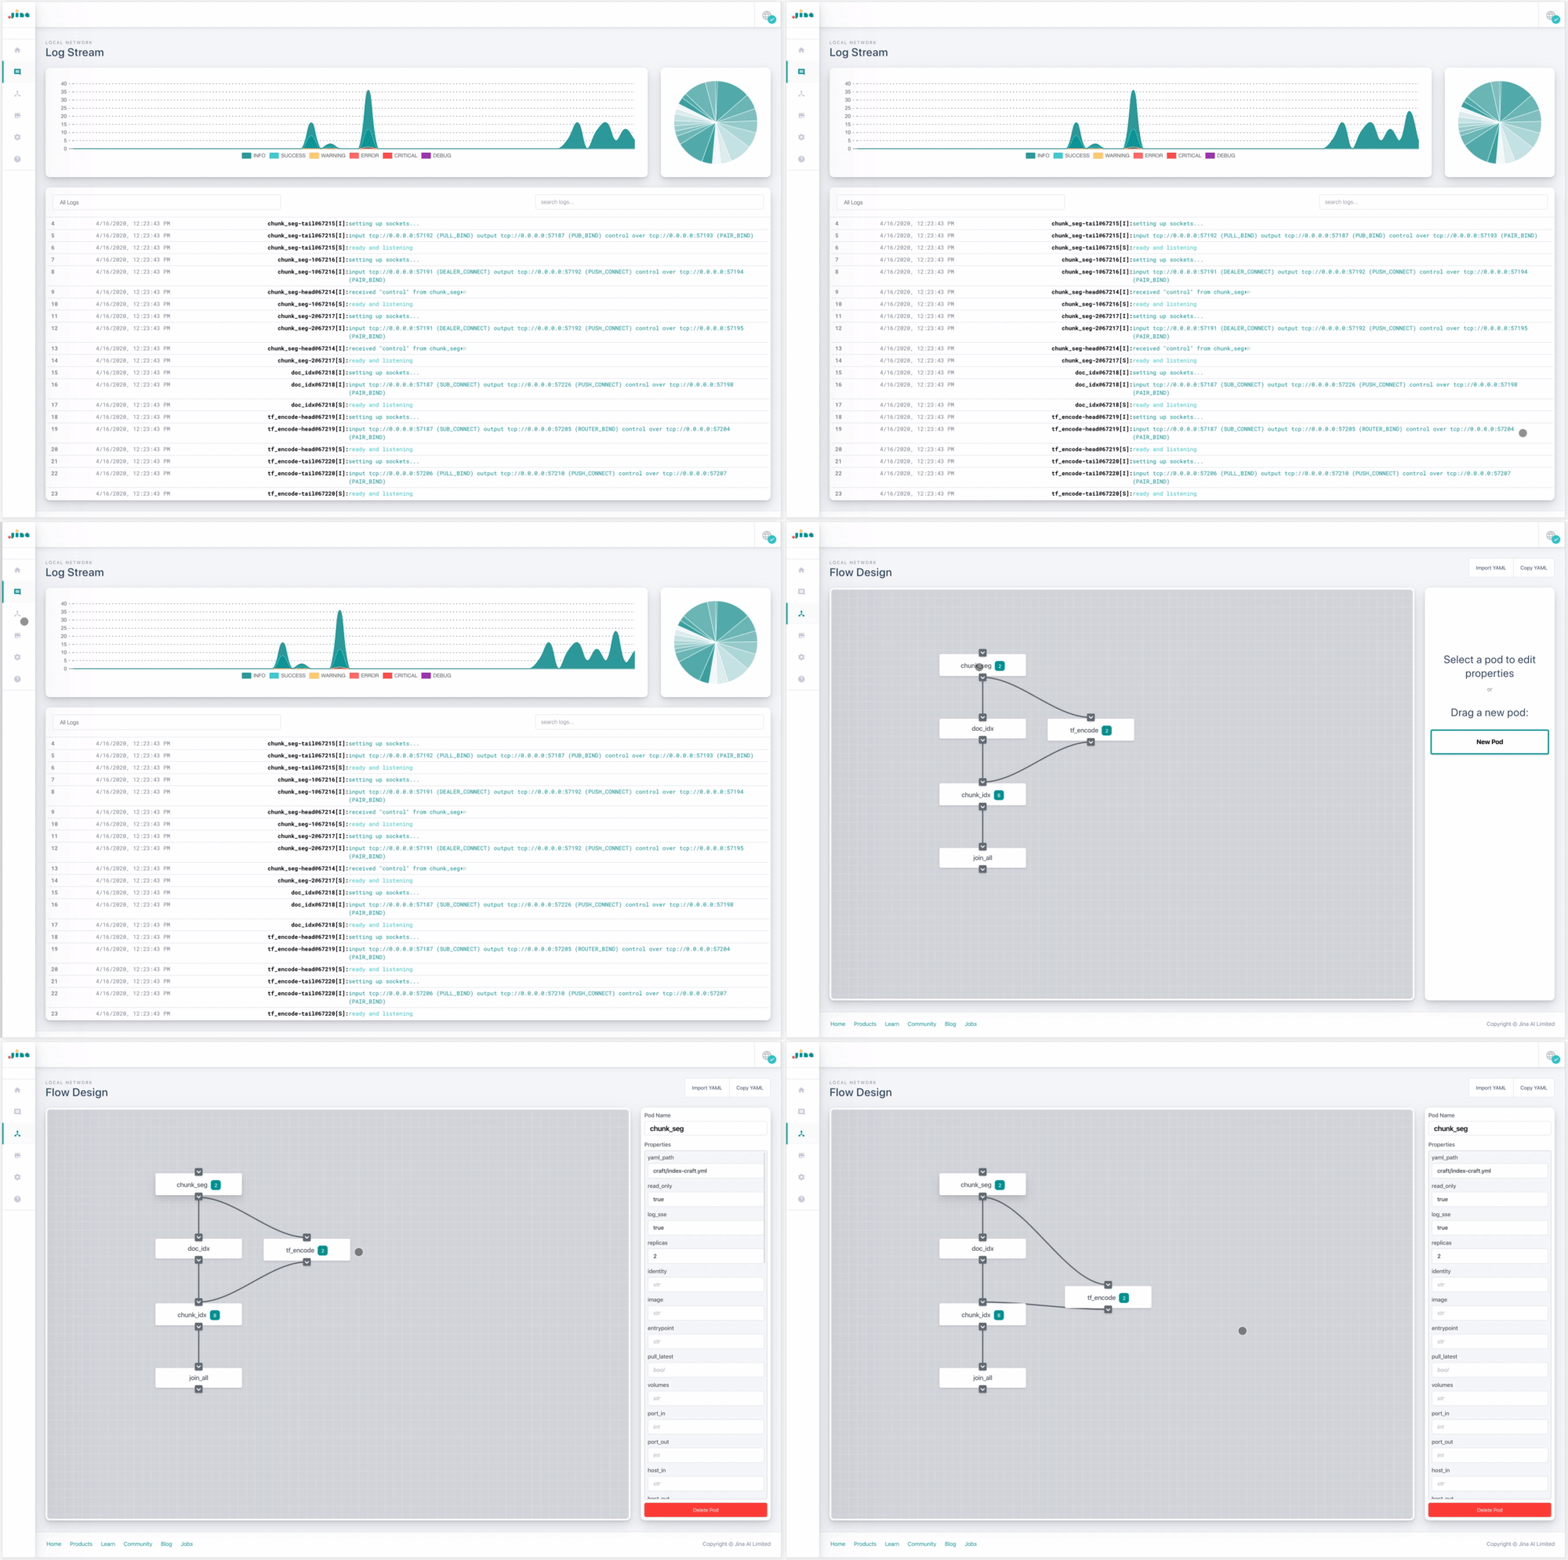
Dashboard offers the insight of running tasks in Jina. With dashboard, one can analyze logs, design flows and view Jina Hub images.
🌟 Features:
- Log streaming, real-time chart on log-level.
- Grouping logs by Pods, Executors. Full text search on logs.
- Drag & drop flow design, setting properties of each Pod via a webform.
- Flow can be imported from/exported to YAML.
- Monitor Jina "Hello, World!" with Dashboard
- Getting started
- Self-host Dashboard
- Contributing
- License
Jina "Hello, World" is a simple demo of image neural search for Fashion-MNIST.
- Run the following command in the console
- (Python >=3.7 required)
JINA_LOG_PROFILING=1 jina hello-world
- ...or if you use Docker (no install required)
docker run -e "JINA_LOG_PROFILING=1" -p 5000:5000 jinaai/jina:devel hello-world --logserver
- (Python >=3.7 required)
- Open https://dashboard.jina.ai in your browser
It should start streaming. If not, please refer to this step.
Set environment variable
JINA_LOG_PROFILINGto1to enable Task tab in the dashboard.
Log server is a helper thread in Jina flow. It exposes HTTP endpoints to the public which the dashboard can use to fetch logs, visualize the flow.
By default the log server is disabled. To enable it you can,
| If you use Flow API in Python, |
from jina.flow import Flow

f = (Flow(logserver=True)
        .add(...)
        .add(...))

with f.build() as fl:
fl.index(...) |
| ...or write a Flow from YAML |
# myflow.yml

!Flow
with:
  logserver: true
pods:
  ...
f = Flow.load_config('myflow.yml')
with f.build() as fl:
fl.index(...) |
| ...or start a Flow from CLI |
jina flow --logserver --yaml-path myflow.yml |
| ...or start a Flow with Docker Container |
docker run -p 5000:5000 jina flow --logserver ... |
Either way, if you see the following logs show up in the console, then your log server is successfully running. You can now move to the next step.
Go to: https://dashboard.jina.ai
Click on the globe icon on the top-left corner to connect to the log server.
It should turn into a green check mark, which means the connection is success.
You should now see the log-streaming and flow visualization.
If it has a red cross, it means the connection is lost or the endpoint is not set correctly. Please move to the next step for instruction.
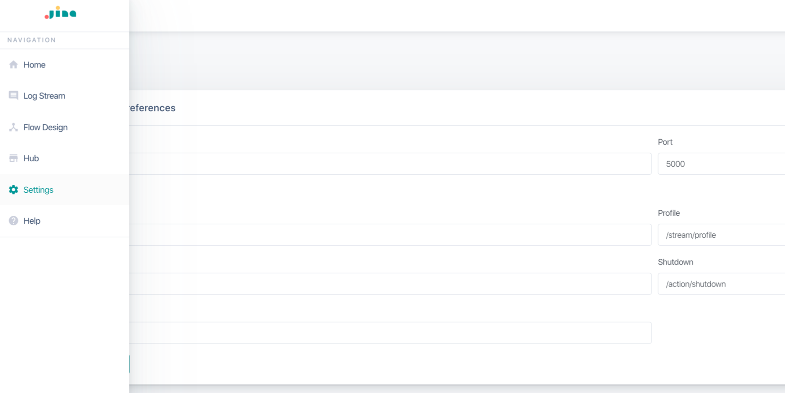
By default the configurations of the log server is as follows:
host: 0.0.0.0
port: 5000
endpoints:
  log: /stream/log  # fetching log in SSE stream
  profile: /stream/profile  # fetching profiling log in SSE stream
  yaml: /data/yaml  # get the YAML spec of a flow
  shutdown: /action/shutdown  # shutdown the log server
  ready: /status/ready  # tell if the log server is ready, return 200 if yes
You can customize the endpoints of the log server via a YAML, say mylogserver.yml. Then pass it to the Flow API via
| If you use Flow API in Python, |
f = Flow(logserver=True, logserver_config='mylogserver.yml') |
| ...or write a Flow from YAML |
!Flow
with:
  logserver: true
logserver_config: mylogserver.yml |
| ...or start a Flow from CLI |
jina flow --logserver --logserver-config mylogserver.yml ... |
| ...or start a Flow with Docker Container |
docker run -p PORT:PORT -v "$(PWD)/mylogserver.yml:/mylogserver.yml" jina flow --logserver --logserver-config /mylogserver.yml ... |
Don't forget to update endpoint in the dashboard accordingly.
One can self-host a dashboard locally.
git clone https://github.com/jina-ai/dashboard.git && cd dashboard.- Install dependencies using command
npm i. - Run dashboard via the following ways .
cd dev-resourcesnode testServer- testServer will be running on
http://localhost:5000by default npm start- dashboard will be served on
http://localhost:3000by default
npm buildnode dashboard- dashboard will be served on
http://localhost:3030by default
We welcome all kinds of contributions from the open-source community, individuals and partners. Without your active involvement, Jina can't be successful.
The following resources help you to make a good first contribution:
Copyright (c) 2020 Jina AI Limited. All rights reserved.
Jina is licensed under the Apache License, Version 2.0. See LICENSE for the full license text.


