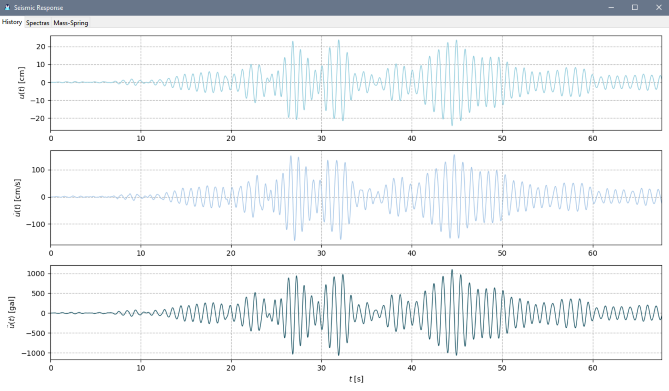
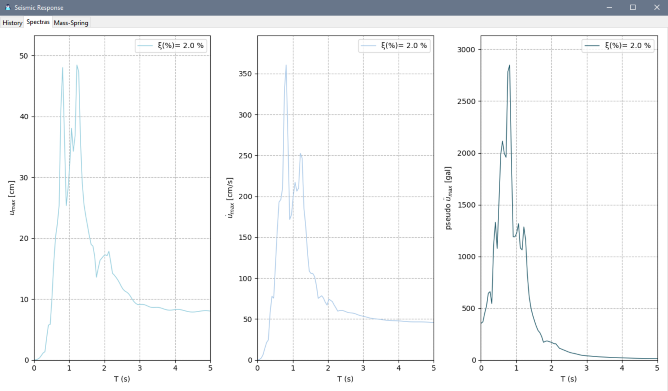
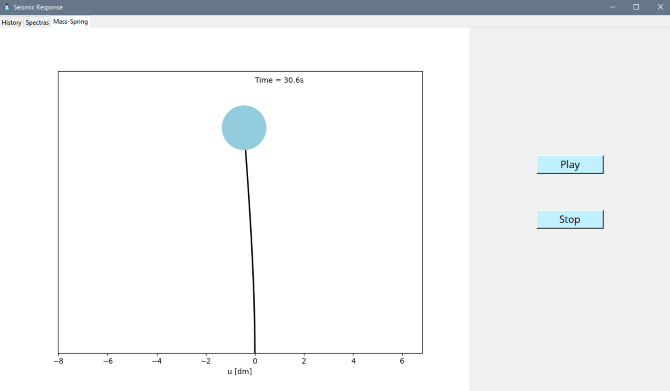
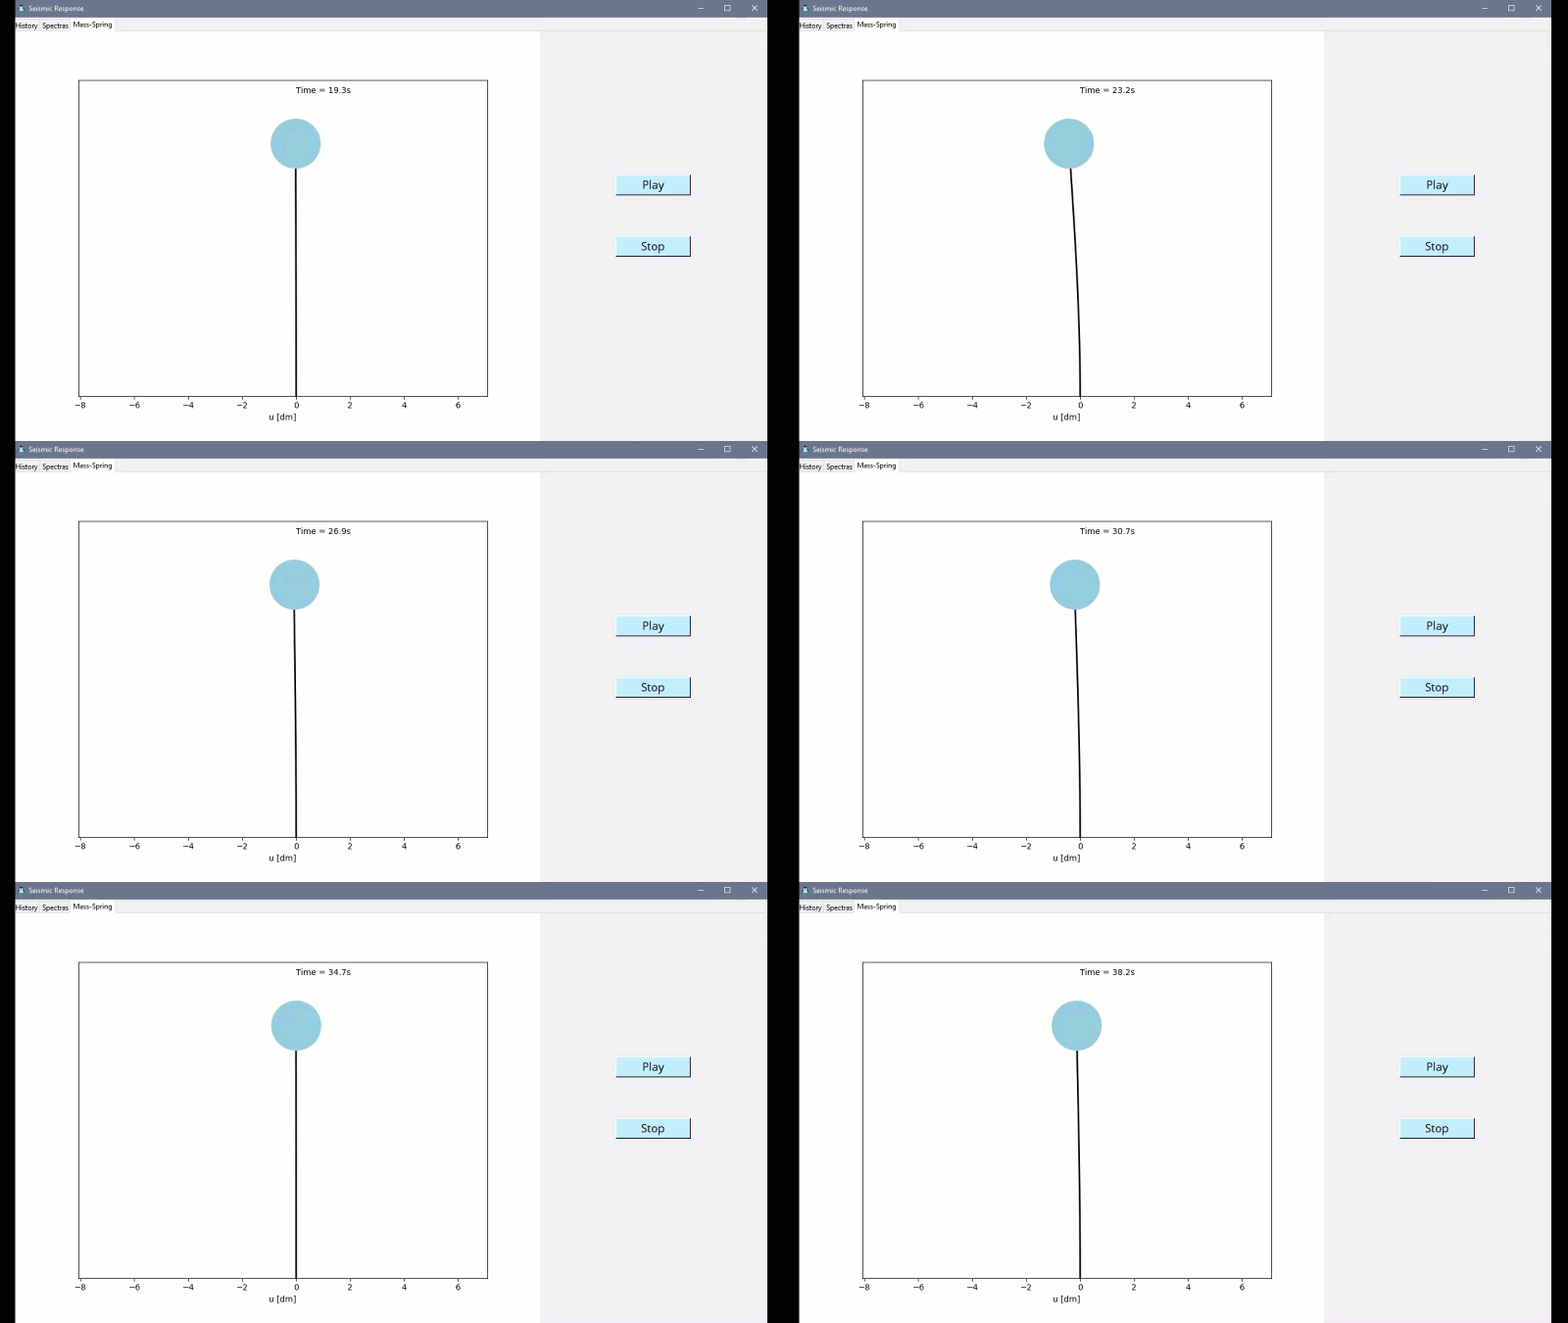
This tool will make practical the analysis of an acceleration registry file by just picking a file and input the structure's properties. The program will compute the displacements, velocities and acceleration, response and spectra from a list of accelerations. The numerical method for the general dynamic load is the interpolation method.
You only need a file with a list of acceleration [$cm/s^2$] and choose Load Data. Thereafter you will be required to enter the mass m [$kg$], stiffness k [$N/m$], damping ratio
This type of file (ASA 2.0) has a standard template and is widely used in Mexico. To load such file use Load ASA 2.0.
The time step computed cannot be changed, if you want to use a different one, then the first option has to be used.
You only need to make sure the file extension is a .txt and the program will load it
class Seismic
-
interpol_meth(...): is the general dynamic load solver through the interpolation methodParameters:
-
seismic_data: (dict) the oscillator characteristics.
-
mass in kilograms
$kg$ -
stiffness in
$N/m$ - xi damping ratio in %
- forces (list) contains the accelerations recorded of the earthquake
- Dt time step between the elements of
-
mass in kilograms
Returns: list
- u: (list) displacements computed.
- u_: (list) velocities computed.
- u__: (list) pseudoaccelerations of the oscillator computed.
- t: (list) time of the response. It has the same number of elements as u__
-
seismic_data: (dict) the oscillator characteristics.
-
seismic_spectra(...)this function is used to get the response spectra of an oscillator with the accelerations registry.Parameters:
-
seismic_data: (dict) the same data as in
interpol_meth(...) -
spectras_config: (dict) spectras characteristics
- t_max the maximum period to be computed.
- spctrum_pts the number of points to compute or the number of iterations to do. The greater the number, the more time it will take to compute.
Returns: dict
- periods: (list) periods.
- u_max: (list) maximum displacement of each period.
- v_max: (list) maximum velocity of each period.
- a_max: (list) maximum acceleration of each period.
-
-
seismic_spectra_fig(self, spectra_data, plot_config)creates the plot to be used in the GUI.Parameters:
-
spectra_data: (dict) the data returned by
seismic_spectra(...)- periods: (list) periods.
- u_max: (list) maximum displacement of each period.
- v_max: (list) maximum velocity of each period.
- a_max: (list) maximum acceleration of each period.
-
plot_config: (dict) plot style settings.
- gridstyle grid style. Checkout the matplotlib gridstyles.
- lw linewidth.
- hstry_a color of the acceleration data.
- hstry_d color of the displacement data.
- hstry_v color of the velocity data.
Returns: matplotlib.figure
-
-
response_fig(...)Parameters:
-
seismic_data: (dict) same data as in
interpol_meth(...) -
plot_config: (dict) same data as in
seismic_spectra_fig(...)
Returns: matplotlib.figure
-
- [START]: you can set the standard default values mass, stiffness and damping ratio that the program will load when reading a file.
- [SAFFILE]: for the standard acceleration files (ASA 2.0), you can indicate the row of the file where the duration, maximum acceleration, and the acceleration list starting position are. The defaults are based on the ASA 2.0 conventions. It is recommended to not change this settings. Modify at your own risk.
- [PLOTS]: you can modify the plot colors, linewidth and gridstyle on this section.
- [SPECTRA]: in this section you can change the range of the spectras on t_max [$s$] and the amount of data points to compute on spctrum_pts (warning: a big number will take longer to compute)
- [ANIMATION]: here the mass dot size of the animation can be changed and so its color.
Run
main.py
Load the IN187903_355.txt. And write your model's properties. For this example is
The results are the following.
“Los registros acelerográficos proporcionados han sido producto de las labores de instrumentación y procesamiento de la Unidad de Instrumentación Sísmica del Instituto de Ingeniería de la UNAM”.


