Hands-on workshop on how to monitor Kubernetes with the Elastic Stack. Instead of a presentation, please use the steps in this readme.
We are running through this together and dive into the relevant parts. For the lab, head to My Lab in Strigo:
- Check that K3s is running:
sudo k3s kubectl get node - You can access it just like Kubernetes:
sudo kubectl get pods --all-namespaces - Install the Elastic Operator's Custom Resource Definition (CRD):
sudo kubectl create -f https://download.elastic.co/downloads/eck/2.5.0/crds.yaml - Install the Elastic Operator itself:
sudo kubectl apply -f https://download.elastic.co/downloads/eck/2.5.0/operator.yaml - Check its status, which should just show some logs from the Operator:
sudo kubectl -n elastic-system logs -f statefulset.apps/elastic-operator
- Create an Elasticsearch node:
sudo kubectl apply -f /opt/elastic-operator/elasticsearch.yml - Watch the status of the node, which should turn green after a minute or two:
sudo kubectl get elasticsearch - Especially if something fails, inspect the pod:
sudo kubectl get pods --selector='elasticsearch.k8s.elastic.co/cluster-name=elasticsearch' - And check the logs:
sudo kubectl logs -f elasticsearch-es-default-0 - Check that the ClusterIP service has been created successfully:
sudo kubectl get service elasticsearch-es-http - Fetch the generated password for the default user
elastic:PASSWORD=$(sudo kubectl get secret elasticsearch-es-elastic-user -o go-template='{{.data.elastic | base64decode}}') && echo $PASSWORD - Expose Elasticsearch to localhost (in the background with
&since this is a blocking call and redirect the output to/dev/null):sudo kubectl port-forward service/elasticsearch-es-http 9200 > /dev/null & - Access Elasticsearch but ignore the self-generated certifikate with
-k:curl -u "elastic:$PASSWORD" -k "https://localhost:9200" killthe port forwarding processes if needed after retrieving the PID:ps aux | grep port-forward
-
Follow a similar approach for creating a Kibana instance.
-
Create a Kibana node:
sudo kubectl apply -f /opt/elastic-operator/kibana.yml -
Check the health of Kibana:
sudo kubectl get kibana -
If required, check the pod:
sudo kubectl get pod --selector='kibana.k8s.elastic.co/name=kibana' -
For Kibana a LoadBalancer should have been created automatically (doesn't need a
port-forwardany more):sudo kubectl get service kibana-kb-http -
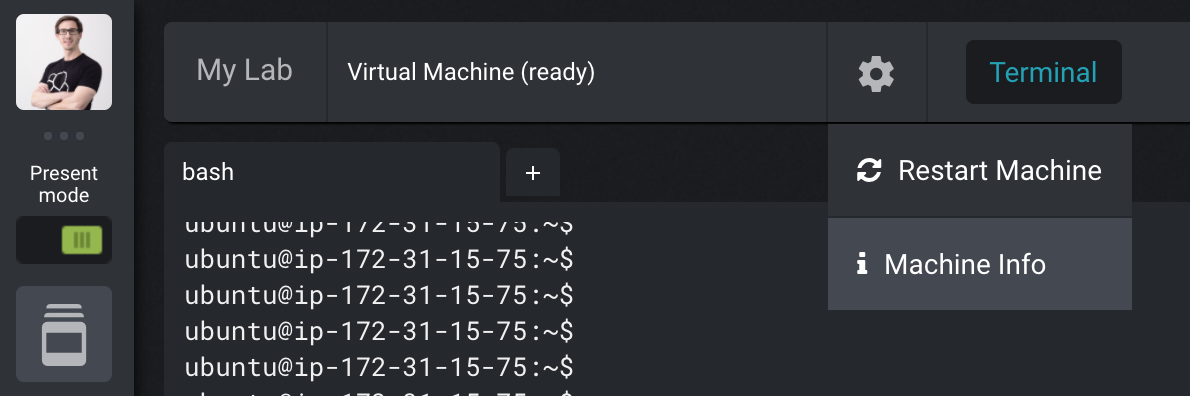
Copy the DNS name of your node under Machine info.
-
Access Kibana on that DNS name on port 5601 and ignore the bad certificate.
-
If you forgot the password for the user
elastic:echo $PASSWORD

- Filebeat with autodiscovery:
sudo kubectl apply -f /opt/elastic-operator/filebeat.yml - Metricbeat with Kubernetes monitoring:
sudo kubectl apply -f /opt/elastic-operator/metricbeat.yml - Heartbeat monitoring Elasticsearch:
sudo kubectl apply -f /opt/elastic-operator/heartbeat.yml - Packetbeat monitoring DNS on port 53 and HTTP on ports 80, 8000, 8080, and 9200:
sudo kubectl apply -f /opt/elastic-operator/packetbeat.yml - Check the health of all the Beat deployments, which might take a little while for them to turn green:
sudo kubectl get beat - As well as the pods — for example for Metricbeat:
sudo kubectl get pods --selector='beat.k8s.elastic.co/name=metricbeat' - Based on that output you can check the logs (the ID at the end will be different):
sudo sudo kubectl logs -f metricbeat-beat-metricbeat-fvvg6
- See the underlying data for the Beats in Kibana's Discover.
- Look at the visualizations in Observability / Overview and its subpages.
- Create a Spring Boot demo deployment:
sudo kubectl create deployment demo --image=springguides/demo --dry-run=client -o=yaml > deployment.yaml - Add another section:
echo --- >> deployment.yaml - Add the service:
sudo kubectl create service loadbalancer demo --tcp=8080:8080 --dry-run=client -o=yaml >> deployment.yaml - Check the generated file:
cat deployment.yaml - Create the pod:
sudo kubectl apply -f deployment.yaml - Check what we have running now:
sudo kubectl get all - Check the health of the instance on
<machine-dns>:8080/actuator/healthorcurl localhost:8080/actuator/health. - Check the logs of the demo app for example by searching for
demoin Discover.
Make sure you have run this before the demo.
- Have your AWS account set up, access key created, and added as environment variables in
AWS_ACCESS_KEY_IDandAWS_SECRET_ACCESS_KEY. Protip: Use https://github.com/sorah/envchain to keep your environment variables safe. - Change the settings to a domain you have registered under Route53 in inventory and variables.tf. Set the Hosted Zone for that domain and export the Zone ID under the environment variable
TF_VAR_zone_id. If you haven't created the Hosted Zone yet, you should set it up in the AWS Console first and then set the environment variable. - If you haven't installed the AWS plugin for Terraform, get it with
terraform initfirst. Then create the keypair, DNS settings, and instances withterraform apply. - Apply the configuration to the instance with
ansible-playbook configure.yml.
When you are done, remove the instances, DNS settings, and key with terraform destroy.
To build an AWS AMI for Strigo, use Packer. Using the Ansible Local Provisioner you only need to have Packer installed locally (no Ansible). Build the AMI with packer build packer.json and set up the training class on Strigo with the generated AMI and the user ubuntu.
If things are failing for some reason: Run packer build -debug packer-ansible.yml, which will keep the instance running and save the SSH key in the current directory. Connect to it with ssh -i ec2_amazon-ebs.pem ubuntu@ec2-X-X-X-X.eu-central-1.compute.amazonaws.com; open ports as needed in the AWS Console since the instance will only open TCP/22 by default.