TODO: - add viz - make it a proper python package
This repo implements the methodology based on paper Learning Embedded Representation of the Stock Correlation Matrix using Graph Machine Learning.
The goal is to learn a vector representation of a ticker given the daily returns of a set of tickers. For example, AAPL is represented as a numpy array of size 32, just like word2vec.
'AAPL': array([-0.5099518 , -0.06737634,  0.48559666, -1.4538945 ,  1.6606339 ,
         0.3644821 , -0.01464582, -0.78605974,  0.47729206, -0.5726769 ,
         0.07515597, -1.2660204 , -0.42653227,  0.5527185 ,  0.07249957,
        -1.4414234 ,  0.6071886 , -0.22588927,  0.27790403,  0.898469  ,
        -1.2963198 ,  0.5084794 , -0.5935085 , -0.10640397, -0.94240546,
        -0.03292902,  0.741543  ,  0.8465433 , -0.81097144,  0.28370696,
        -0.12066484,  0.22394317], dtype=float32)
With the vectorized ticker, we can pass these elements in the vector to the downstream ML jobs.
This repo is able to replicate most of the results presented in the paper. Here are some examples from the notebook under src.
# stock data are fetched via yfinance package, the log returns and correlations are cacluated internally
se = StockEmbedding(start_date='2021-01-01', end_date='2022-08-04')

# hyperparameter is tuned by maximizing average v-measure
param_lst = [{'l': 50, 'r': 10, 'p': 0.5, 'q': 2, 'w': 5, 'dim': 16},
             {'l': 100, 'r': 50, 'p': 2, 'q': 0.5, 'w': 5, 'dim': 16},
             {'l': 200, 'r': 10, 'p': 2, 'q': 0.5, 'w': 5, 'dim': 32}]

summary, opt_param = se.hyperparam_tuning(param_lst)
similar to Table 3 of the original paper

The stock embedding enables us to answer the following questions
-
stock similarity
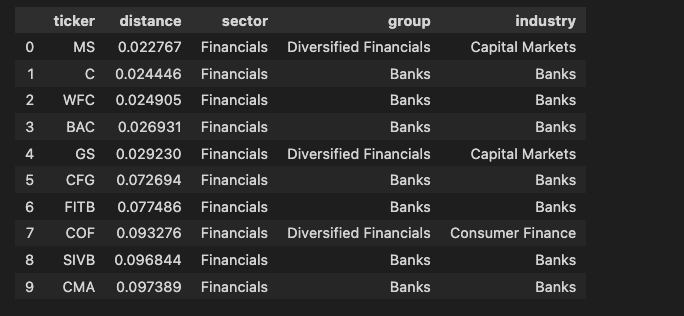
se.find_similar_stocks(ticker='JPM')
All the top similar stocks are from Financial sector with most of them from Banks industry.
-
Analogical Inference: answer question like "JPM is to GS as JNJ is to ?"
se.analogical_inference(ticker='AAPL', ticker_1='JPM', ticker_2='GS')
The result is
JPM is to GS as AAPL is to AMZNwith a similarity of 0.9349383.se.analogical_inference(ticker='JNJ', ticker_1='JPM', ticker_2='GS')
The result is
JPM is to GS as JNJ is to GILDwith a similarity of 0.8816782. -
Not Match Stock: Answer questions like: Does not match from JPM, MS, GS, GOOGL: GOOGL
se.identify_not_match_stock(['JPM', 'MS', 'GS', 'GOOGL'])
The result is
Does not match from JPM, MS, GS, GOOGL: GOOGL.se.identify_not_match_stock(['JNJ', 'BMY', 'PFE', 'HD'])
The result is
Does not match from JNJ, BMY, PFE, HD: HD.se.identify_not_match_stock(['UAL', 'AAL', 'DAL', 'TSLA'])
The result is
Does not match from UAL, AAL, DAL, TSLA: TSLA.
