| title | author | output | ||||
|---|---|---|---|---|---|---|
Speedtest |
Wolfgang Huber |
|
Install the speedtest command line interface
The tool is called speedtest-cli. The script also calls gdate, which homebrew provides in coreutils. The below shell commands are for Mac OS X and homebrew. Replace by your favourite package manager.
brew install speedtest-cli coreutilsSet up crontab to run it in regular intervals
This works on Unix-derived systems like Linux and Mac OS X. Edit the crontab using
env EDITOR=nano crontab -eand add a line similar to:
*/5 * * * * /Users/whuber/svnco/speedtest/run-speedtest-cli.shThis will run the shell script run-speedtest-cli.sh, which is provided in a separate file, every 5 minutes. Of course you'll have to adapt the file path to your local setup. Check the documentation of crontab if you want to run it at different times or intervals. Make sure the file is executable, with e.g.
chmod 755 /Users/whuber/svnco/speedtest/run-speedtest-cli.shVisualize the data
library("readr")
library("tidyr")
library("dplyr")
library("magrittr")
library("ggplot2")
Get the CSV header and read the CSV file
hosts = c("spinoza", "boltzmann")[1]
logfile = "/Users/whuber/Dropbox/speedtest/speedtest-%s.csv"

header = system2("speedtest-cli", args = c("--csv-header"), stdout = TRUE)  %>%
  strsplit(split = ",") %>% `[[`(1)

st = lapply(hosts, function(h) {
  read_csv(sprintf(logfile, h), col_names = FALSE) %>%
  `colnames<-`(header)  %>%
  mutate(hostname = h)
}) %>% bind_rows

stopifnot(all(is.finite(st$Timestamp)))
is_fin = is.finite(st$Download)
stopifnot(identical(is_fin, is.finite(st$Upload)),
          identical(is_fin, is.finite(st$Ping)))
with(st,
  table(ifelse(is.na(Download), "NA", ifelse(Download==0, "0", ">0")),
        hostname))
## hostname
## spinoza
## >0 1684
## 0 3
## NA 21
negping = (!is.na(st$Ping) & (st$Ping <= 0))
if (any(negping)) {
  print(st[which(negping), ])
  st = filter(st, (!negping) | is.na(st$Ping))
}
## # A tibble: 1 x 11
## `Server ID` Sponsor `Server Name` Timestamp Distance Ping Download
## <dbl> <chr> <chr> <dttm> <dbl> <dbl> <dbl>
## 1 38469 Diamon… Limburg An D… 2020-12-27 12:59:02 115. -64.0 2.53e7
## # … with 4 more variables: Upload <dbl>, Share <lgl>, `IP Address` <chr>,
## # hostname <chr>
variables = c("Download (Mb/s)", "Upload (Mb/s)", "log10 Ping (ms)")
st %<>% mutate(
  `Download (Mb/s)` = Download / 2^20,
  `Upload (Mb/s)` = Upload / 2^20,
  `log10 Ping (ms)` = log10(Ping))
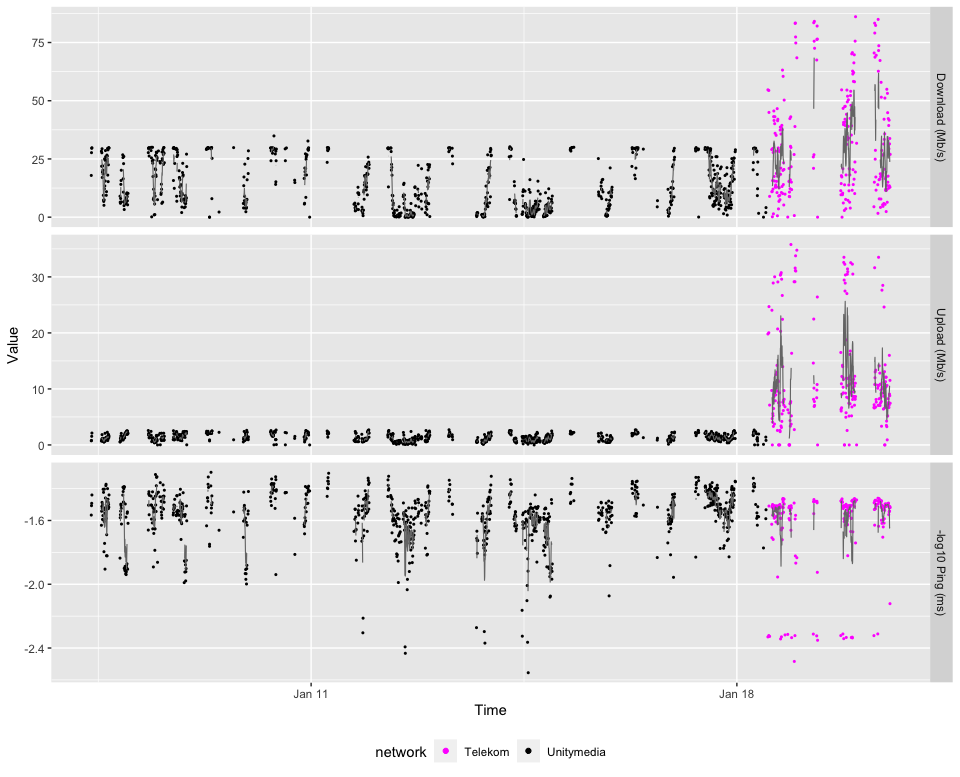
Stratify by "IP Address", which indicates whether the measurement was taken in Unitymedia broadband, LTE Telekom or at work at EMBL.
The stopifnot call makes sure that all instances of IP Address that are not NA are one of the three addresses below.
Subsequently we assume that the cases where IP Address is NA were at home, i.e. in the Unitymedia network.
servers = c(Unitymedia    = "176.199.211.22",
            EMBL          = "194.94.44.220",
            `Telekom-LTE` = "80.187.97.*")
st$network = rep(NA_character_, nrow(st))
for (nm in names(servers))
  st$network[ grep(servers[nm], st$`IP Address`) ] = nm
stopifnot(all(!is.na(st$network) | is.na(st$`IP Address`)))
Epochs. The running median line will be plotted separately for each epoch. Here the assumption is that consecutive measurements were taken about 5 minutes apart (i.e., well less than 7 minutes).
newepoch = (diff(st$Timestamp) > as.difftime(7,  units = "mins"))
st$epoch = as.factor(c(0L, cumsum(as.numeric(newepoch))))
Pivot to long format for plotting.
st %<>% pivot_longer(cols = all_of(variables))
st$name %<>% factor(levels = variables)
Smooth. Running median with window size +/- 12 min, i.e., in practice these are the 5 measurements t-10, t-5, t, t+5, t+10. The for loop and esp. computation of k is a bit clumsy and inefficient here; but it works.
delta = as.difftime(12,  units = "mins")
st$value_s = rep(NA_real_, nrow(st))

for (i in which(!is.na(st$network))) {
  k = which(with(st,
      (abs(Timestamp - Timestamp[i]) <= delta) &
      (name == name[i]) &
      (network == network[i])))
  stopifnot(length(k)>=1)
  st$value_s[i] = median(st$value[k], na.rm = TRUE)
}
makeplot = function(x, networks, from = "2021-01-07", to = "2021-12-31") {
x = filter(x, (Timestamp >= from) & (Timestamp <= to) & (network %in% networks))
ggplot(x, aes(x = Timestamp)) +
# Sadly, it seems that the below timezone setting is ignored by ggplot2
scale_x_datetime(timezone = "CET") +
xlab("Time") + ylab("Value") +
geom_point(aes(y = ifelse(is.na(value), 0, value),
col = network, shape = is.na(value), size = is.na(value))) +
geom_line(aes(y = ifelse(is.na(value_s), 0, value_s), group = epoch), col = "#777777", size = 0.4) +
facet_grid(rows = vars(name), scales = "free_y") +
scale_shape_manual(values = c(`FALSE` = 16, `TRUE` = 4)) +
scale_size_manual(values = c(`FALSE` = 0.75, `TRUE` = 1.5)) +
scale_color_manual(values = c(Unitymedia = "black", `Telekom-LTE` = "magenta")) +
theme(legend.position = "bottom") +
guides(shape = "none", size = "none")
}
makeplot(st, networks = c("Unitymedia", "Telekom-LTE")[1])#dev.copy(pdf, file = "speedtest.pdf", width = 16, height = 8)