Benchmarking classifiers (SVM, RF, XGBOOST) on four different pathogens:
- Armillaria
- Diplodia
- Heterobasidion
- Fusarium
Sequential model-based optimization (SMBO)
Stored at Mendeley Data. Data will be downloaded and processed when executing the project. Local storage directory is “./data”. After the intermediate R objects have been created, the data is deleted again to only function as a starting point and keep the directoy small. Only raster files need be kept as raster processes require a file stored on disk.
This project is setup with a drake
workflow, ensuring reproducibility.
Intermediate targets/objects will be stored in a hidden .drake
directory.
The R library of this project is managed by
packrat. This makes sure that the
exact same package versions are used when recreating the project. When
calling packrat::restore(), all required packages will be installed
with their specific version.
Please note that this project was built with R version 3.5.1 on a Debian 9 operating system. The packrat packages from this project are not compatible with R versions prior version 3.5.0. For reproducibility, we recommend to replicate the analysis using the included Dockerfile. Instructions can be found ħere. However, it should be possible to reproduce the analysis on any other operating system.
To clone the project, a working installation of git is required. Open
a terminal in the directory of your choice and execute:
git clone https://venus.geogr.uni-jena.de/bi28yuv/pathogen-modellingThen open a R session in this directory and run
packrat::restore()
source("scripts/drake.R")
make(plan, keep_going = TRUE, console_log_file=stdout())
# use more cores with make(plan, jobs = <number of cores>)Predicted total runtime
source("scripts/drake.R")
predict_runtime(drake_config(), from_scratch = TRUE, targets_only = TRUE)
## Warning: Some targets were never actually timed, And no hypothetical time was specified in `known_times`. Assuming a runtime of 0 for these targets:
## benchmark_evaluation_report
## bm_kknn
## bm_rf
## bm_svm
## bm_xgboost
## bm_brt
## bm_gam_diplodia
## bm_gam_fusarium
## bm_gam_armillaria
## bm_gam_heterobasidion
## prediction_rf
## prediction_svm
## prediction_xgboost
## prediction_kknn
## prediction_glm
## prediction_gam_diplodia
## prediction_gam_fusarium
## prediction_gam_armillaria
## prediction_gam_heterobasidion
## [1] "6951.184s (~1.93 hours)"
Acceleration by parallelization of make() call
time <- c()
for (jobs in 1:10){
  time[jobs] <- predict_runtime(
    drake_config(),
    jobs = jobs,
    from_scratch = TRUE,
    known_times = build_times(targets_only = TRUE)$elapsed
  )
}

library(ggplot2)
ggplot(data.frame(time = time / 3600, jobs = ordered(1:10), group = 1)) +
  geom_line(aes(x = jobs, y = time, group = group)) +
  scale_y_continuous(breaks = 0:10 * 4, limits = c(0, 29)) +
  ggpubr::theme_pubr() +
  xlab("jobs argument of make()") +
ylab("Predicted runtime of make() (hours)")A Dockerfile is available in docker/. It was generated by the R
package containerit and
contains all packrat packages and system libraries with have been used
to run the analysis (the file already exists, no need to do this).
remotes::install_github("pat-s/containerit@packrat")
library(containerit)
container = dockerfile(".", packrat = TRUE)
write(container, "docker/Dockerfile")
A docker container can be built and started from this Dockerfile by
executing docker build -t image . within the ./docker directory.
Next, the analysis can be started by calling
source("scripts/drake.R")
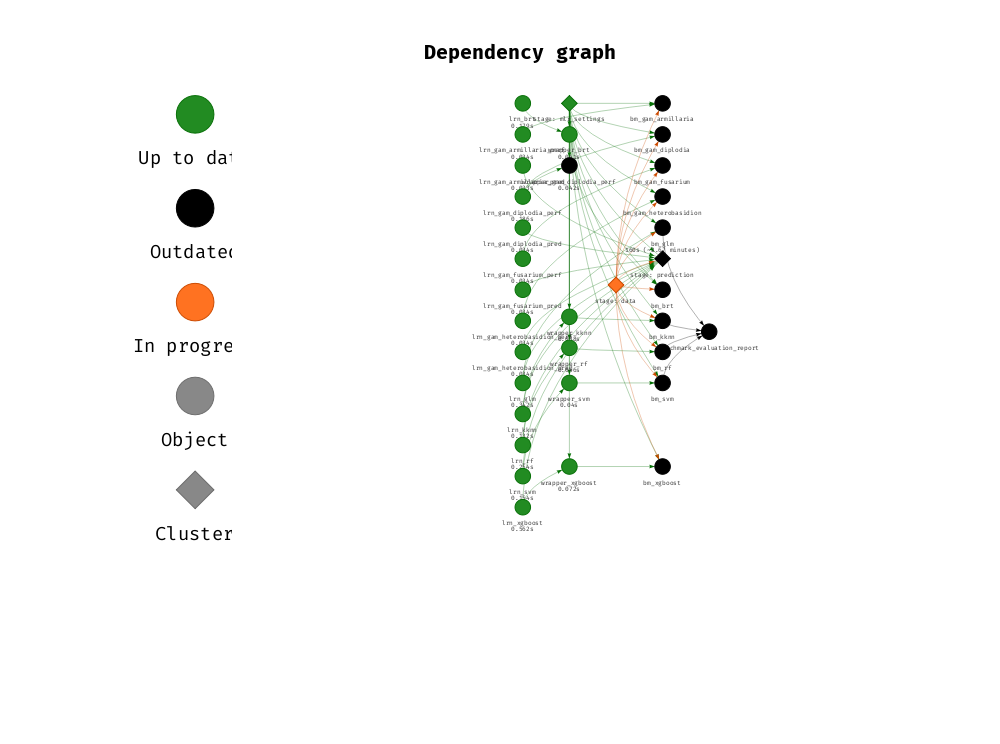
make(plan, keep_going = TRUE, console_log_file = stdout()) The dependency graph of this analysis (subjective grouping) can be visualized with the following code.
Note that intermediate files have been gathered into the following categories:
- Data
- Task
- Learner
- mlr_settings
- benchmark
- prediction
vis_drake_graph(drake_config(), group = "stage", clusters = c("data", "prediction",
                                                              "mlr_settings"),
                targets_only = TRUE, show_output_files = FALSE,
                navigationButtons = FALSE, selfcontained = TRUE,
                file = "drake.png") +
  ggpubr::theme_pubr()
If all intermediate objects should be visualized (not recommended):
vis_drake_graph(drake_config()) + ggpubr::theme_pubr()
