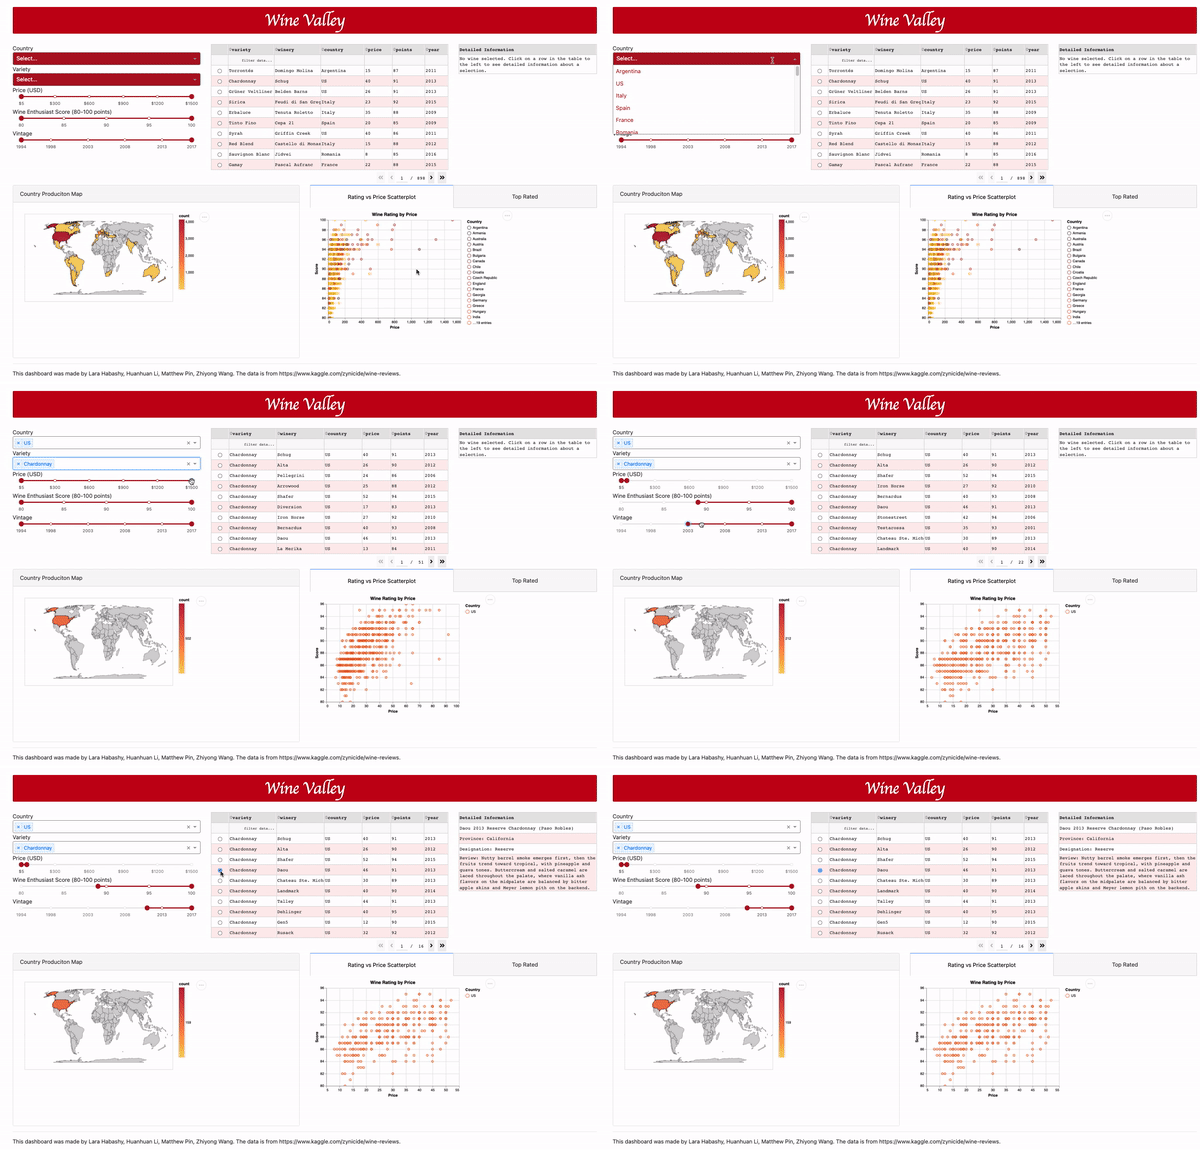
Deployed dashboard in herokuapp: https://winevalley.herokuapp.com/
Have you been trying to track down the perfect wine for the perfect occasion? Look no further! Our app Wine Valley will help you do just that! Apply various filters to search through a database of thousands of different wines to find exactly what you're looking for! With Wine Valley you can filter by country, price, Wine Enthusiast score and year. Track down the perfect beverage for any occasion! Try it here!
By clicking on the different sliders and dropdown filter the data to find whatever kind of wine you're interested in! See our map and charts that are updated in real time according to your selections!
Would you like to help us improve our app? Here are some instructions on how to get started.
First, make sure you have all of the required dependencies installed.
First install all of the required packages to be able to run our dashboard.
| Package | Installation command |
|---|---|
| pandas | conda install pandas |
| gunicorn | pip install gunicorn |
| altair | pip install altair vega_datasets |
| dash==1.18.1 | pip install dash==1.18.1 |
| dash_bootstrap_components | pip install dash-bootstrap-components |
| vega_datasets | pip install altair vega_datasets |
| numpy | pip install numpy |
| re | pip install re |
Then simply clone our repo and run app.py in your terminal. A local version of the app will run in your default local host ip and port which can then be opened in any browser. Further instructions are available here if you run into any issues.
If you can think of ways to make our sliders more intuitive or improve the presentation of our charts, then don't hesitate to contact us.
Feel free to open an issue in this github repo if you would like to report a bug, error, or suggestion you have for how we can improve this project.
The left side of the screen will display interactive sliders (vintage year, price, user rating) and drop down (country, variety) menus for different search criteria as well as a keyword search bar to look for wine of a specific name. The bottom left of the screen will display an interactive map highlighting where all of the searched wines are from. The upper middle of the screen will display the results of the search as a scrollable list of wine that meet the specified criteria, with the title and some summary information about each wine visible. A dropdown will be available at the top to change how these results are sorted (i.e. by price, score, etc.). If a wine is clicked on by the user a detailed description will be displayed in the top right of the screen including detailed information about each wine and it's provided review. Finally, the lower right of the screen will show summary statistics (i.e. histograms, line charts) about the search results with a dropdown menu to let you decide what features (price, score, etc.) are displayed by the charts.
