
Building an interactive dashboard to explore the Belly Button Biodiversity DataSet.
Use Plotly.js to build interactive charts for your dashboard.
-
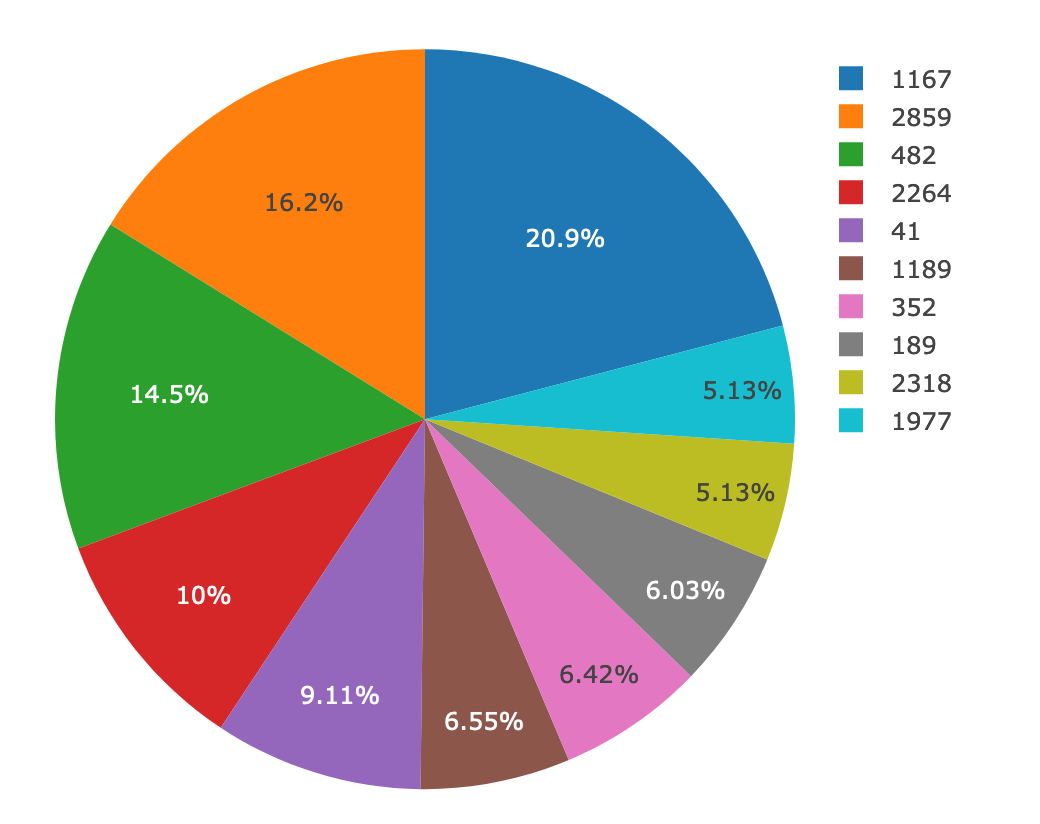
Created a PIE chart that uses data from the Belly Button Biodiversity Dataset to display the top 10 samples.
-
Use
sample_valuesas the values for the PIE chart. -
Use
otu_idsas the labels for the pie chart. -
Use
otu_labelsas the hovertext for the chart.
-
-
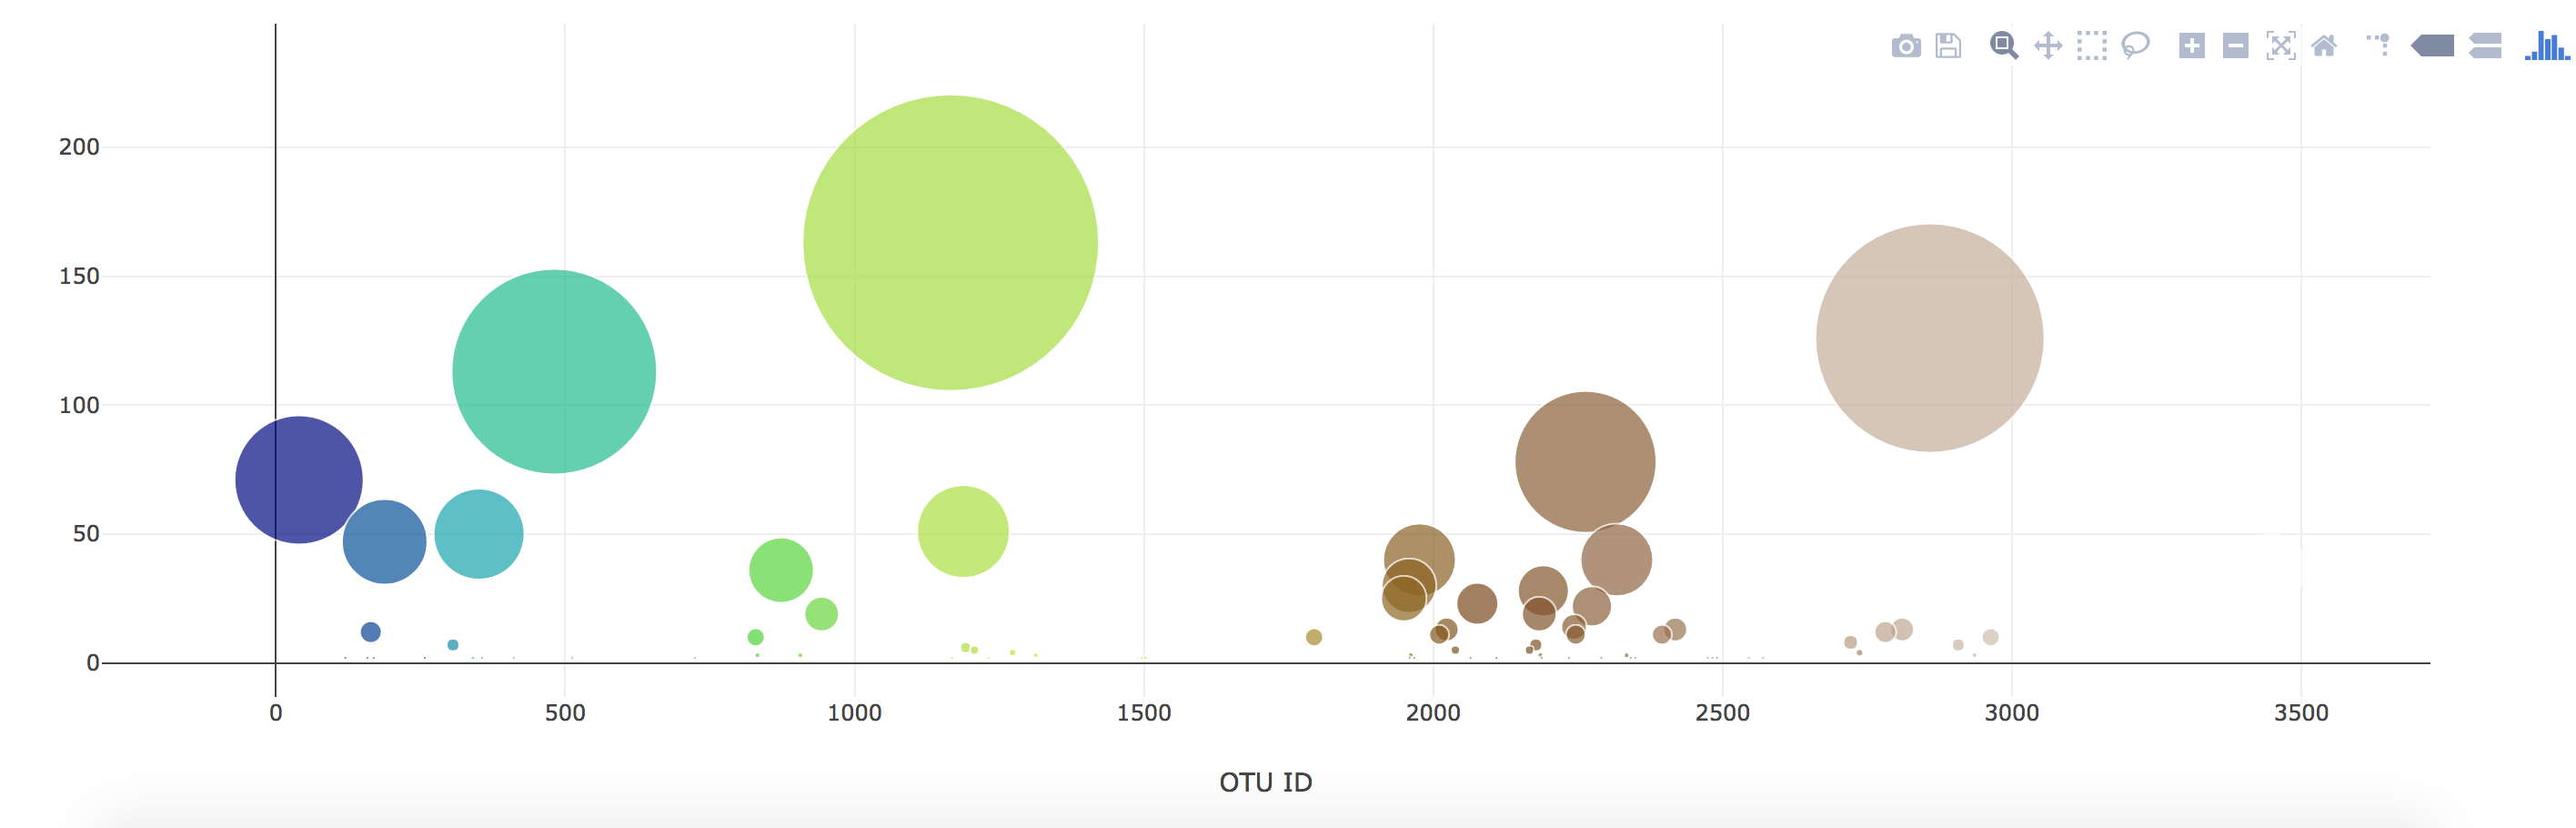
Created a Bubble Chart that uses data from the Belly Button Biodiversity Dataset to display each sample.
-
Use
otu_idsfor the x values. -
Use
sample_valuesfor the y values. -
Use
sample_valuesfor the marker size. -
Use
sample_valuesfor the marker colors. -
Use
otu_labelsfor the text values.
-
-
Display the sample metadata from each key/value pair from the metadata JSON object somewhere on the page.
-
All of the plots update any time that a new sample is selected.


-
Heroku is used to deploy the flask app utilizing sqlite for the database.
-
Used Flask API starter code to serve the data needed for your plots.
-
Update the chart whenever a new sample is selected.
-
Tested all routes by visiting each one in the browser.
-
Used
console.loginside of your JavaScript code to see what the data looks like at each step. -
Refered to the Plotly.js Documentation throughout the process when building the plots.