Plot your bam files!
You must call bam2plot with the following subcommands:
   [1]: 'from_bam'
   [2]: 'from_reads'
[3]: 'guci'usage: bam2plot [-h] -b BAM -o OUTPATH [-w WHITELIST] [-t THRESHOLD] [-r ROLLING_WINDOW]
[-i | --index | --no-index] [-s | --sort_and_index | --no-sort_and_index] [-z ZOOM]
[-l | --log_scale | --no-log_scale] [-c | --cum_plot | --no-cum_plot]
[-hl | --highlight | --no-highlight] [-p {png,svg,both}]
sub_command
Plot your bam files!
positional arguments:
sub_command
options:
-h, --help show this help message and exit
-b BAM, --bam BAM bam file
-o OUTPATH, --outpath OUTPATH
Where to save the plots.
-w WHITELIST, --whitelist WHITELIST
Only include these references/chromosomes.
-t THRESHOLD, --threshold THRESHOLD
Threshold of mean coverage depth
-r ROLLING_WINDOW, --rolling_window ROLLING_WINDOW
Rolling window size
-i, --index, --no-index
Index bam file (default: False)
-s, --sort_and_index, --no-sort_and_index
Index and sort bam file (default: False)
-z ZOOM, --zoom ZOOM Zoom into this region. Example: -z='100 2000'
-l, --log_scale, --no-log_scale
Log scale of Y axis (default: False)
-c, --cum_plot, --no-cum_plot
Generate cumulative plots of all chromosomes (default: False)
-hl, --highlight, --no-highlight
Highlights regions where coverage is below treshold. (default: False)
-p {png,svg,both}, --plot_type {png,svg,both}
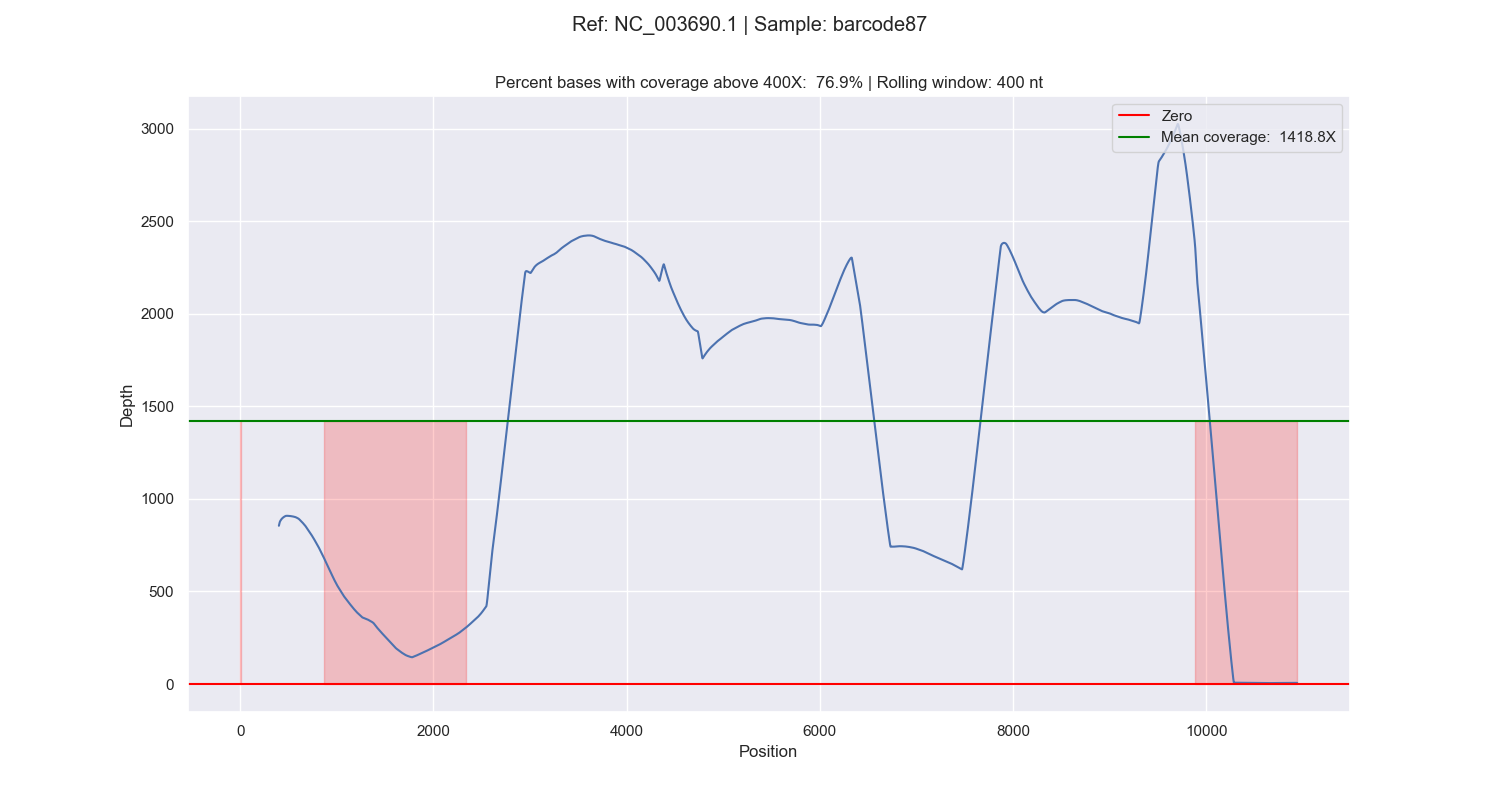
How to save the plotsbam2plot from_bam generates coverage plots:

... and if -c is added, cumulative coverage plots for each reference (e.g. chromosomes) for each sample:

If the flag --highlight is given, the regions with a coverage below the --treshold are highlighted:

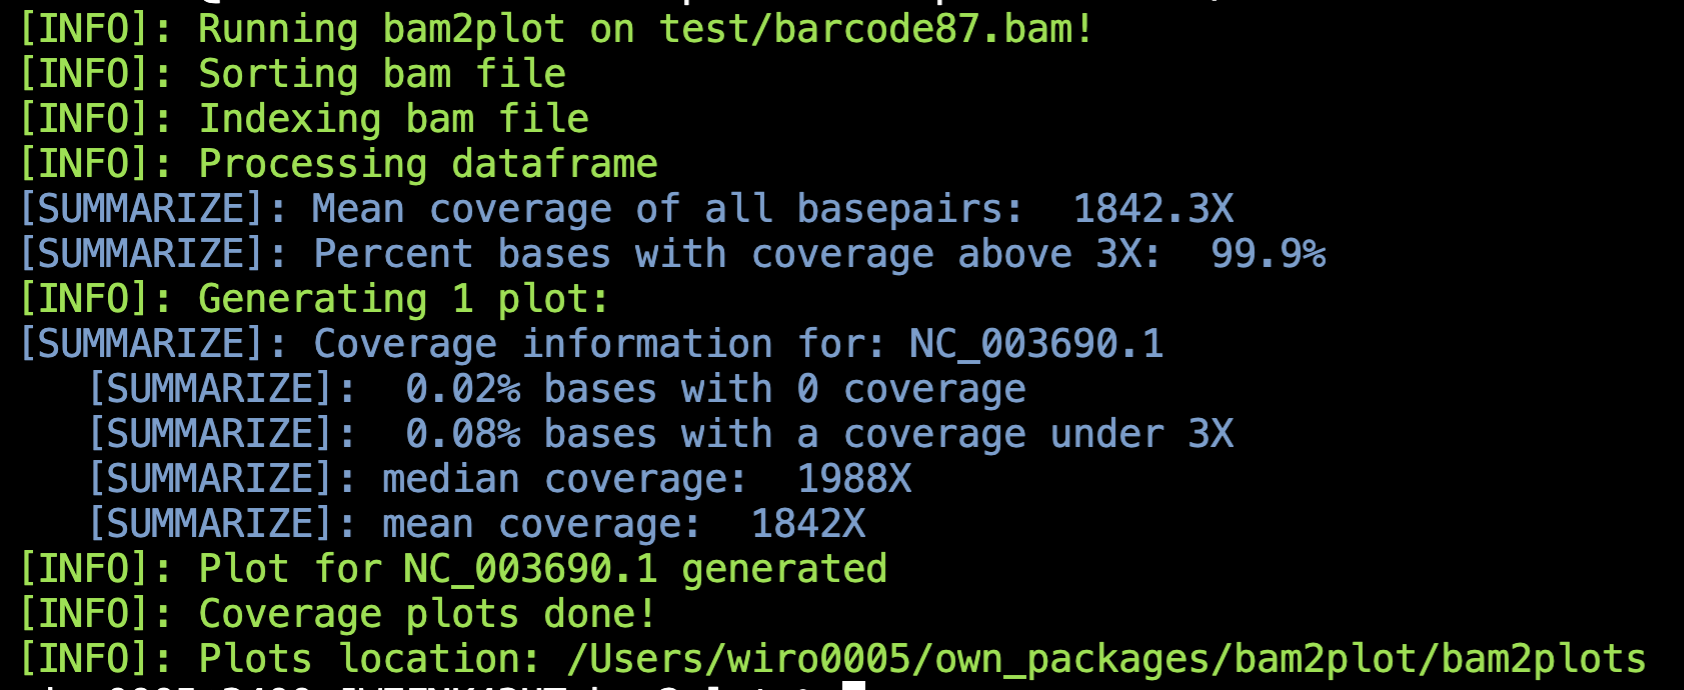
Below is an example of how bam2plot looks when runned in the terminal:

Here's an example of how to use the bam2plot from_bam:
bam2plot from_bam --bam input.bam --outpath output_folder --rolling_window 50 --threshold 5 -s -c -hlusage: bam2plot [-h] -r1 READ_1 [-r2 READ_2] -ref REFERENCE [-gc | --guci | --no-guci] -o OUT_FOLDER
[-r ROLLING_WINDOW] [-p {png,svg,both}]
sub_command
Align your reads and plot the coverage!
positional arguments:
sub_command
options:
-h, --help show this help message and exit
-r1 READ_1, --read_1 READ_1
Fastq file 1
-r2 READ_2, --read_2 READ_2
Fastq file 2
-ref REFERENCE, --reference REFERENCE
Reference fasta
-gc, --guci, --no-guci
Plot GC content? (default: False)
-o OUT_FOLDER, --out_folder OUT_FOLDER
Where to save the plots.
-r ROLLING_WINDOW, --rolling_window ROLLING_WINDOW
Rolling window size
-p {png,svg,both}, --plot_type {png,svg,both}
How to save the plotsusage: bam2plot [-h] -ref REFERENCE -w WINDOW -o OUT_FOLDER [-p {png,svg,both}] sub_command
Plot GC content of your reference fasta!
positional arguments:
sub_command
options:
-h, --help show this help message and exit
-ref REFERENCE, --reference REFERENCE
Reference fasta
-w WINDOW, --window WINDOW
Rolling window size
-o OUT_FOLDER, --out_folder OUT_FOLDER
Where to save the plots.
-p {png,svg,both}, --plot_type {png,svg,both}
How to save the plotsbam2plot depends on perbase, which you can install via:
cargo install perbase
# or
conda install -c bioconda perbaseYou can install bam2plot using the following pip command:
pip install bam2plot