paleoMap is a package that combines paleomaps from GPlates with fossil records from Paleobiology Database. It can be used to download shapefiles with reconstructions of the past configuration of the continents, and to generate paleodiversity maps.
Install
Install paleoMap from CRAN
install.packages("paleoMap")
library(paleoMap)
Install paleoMap developing version from github
install.packages("devtools")
library(devtools)
install_github("macroecology/paleoMap")
library(paleoMap)
General overview
paleoMap version 0.1 has 3 functions for getting and visualising paleogeographical maps and fossil data, 4 functions for constructing diversity rasters (paleorichness and Shannon paleodiversity) and 2 functions for creating diversity matrix (based on localities or cells) and 2 functions for getting latitudinal paleodiversity gradients.
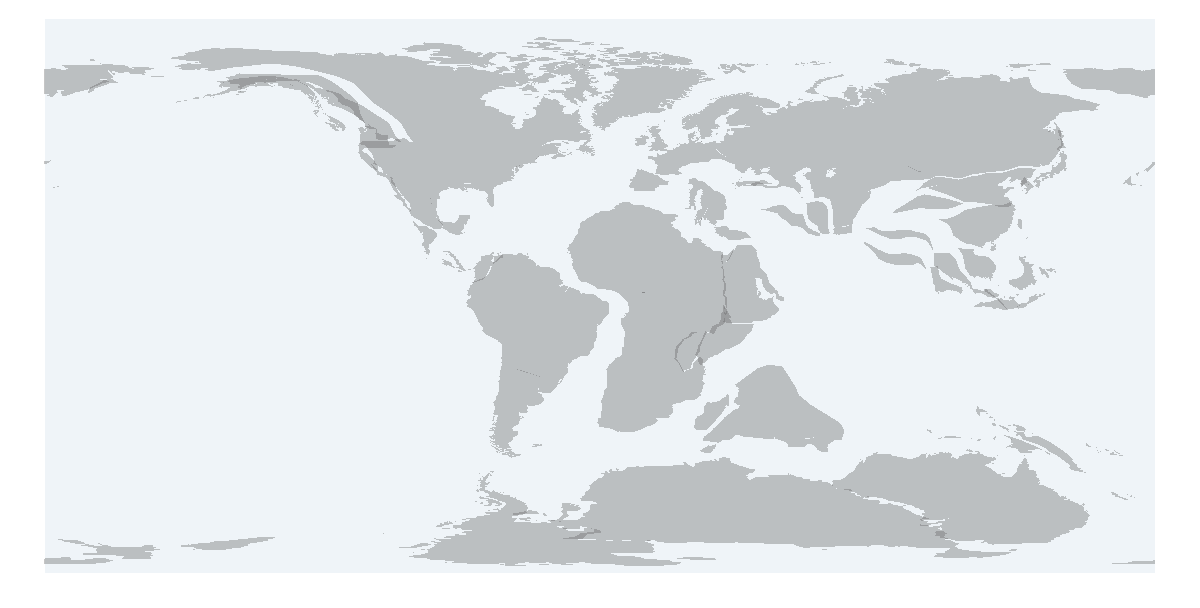
pm_getmap returns the shapefile of a choosen paleogeographical time interval and a plot
> shape  <-  pm_getmap(interval="Cretaceous")
> shape
class : SpatialPolygonsDataFrame
features : 86
extent : -180, 180, -88.8737, 83.6951 (xmin, xmax, ymin, ymax)
coord. ref. : NA
variables : 13
names : PLATEID1, GPGIM_TYPE, TYPE, FROMAGE, TOAGE, NAME, DESCR, FEATURE_ID, PLATEID2, L_PLATE, R_PLATE, RECON_METH, SPREAD_ASY
min values : 0, gpml:UnclassifiedFeature, NA, 0, 0, NA, NA, GPlates-052973e4-ed8e-43bf-85b4-aa178e2242a8, 0, 0, 0, NA, 0
max values : 0, gpml:UnclassifiedFeature, NA, 0, 0, NA, NA, GPlates-ffbfeec0-bf61-4769-ac12-bf43ec206a14, 0, 0, 0, NA, 0 pm_getdata returns a dataframe with the selected fossil occurrences, downloaded from the Paleobiology Database
> data  <-  pm_getdata (base_name="Testudines", interval="Paleocene")
> head(data)
   occurrence_no               matched_name matched_rank matched_no     early_interval   late_interval paleolng paleolat geoplate
          40165        Peritresius ornatus      species     173397          Thanetian            <NA>   -44.51    40.13      109
          40166       Rhetechelys platyops      species     128351          Thanetian            <NA>   -44.51    40.13      109
         149344 Aspideretoides virginianus      species     316507          Thanetian            <NA>   -47.60    38.76      109
         205060        Judithemys backmani      species     253836          Paleocene            <NA>   -67.18    57.12      101
         205061               Trionychinae    subfamily      58166          Paleocene            <NA>   -67.18    57.12      101
         281674       Taphrosphys sulcatus      species     131500 Late Maastrichtian Early Paleocene   -39.82    40.92      109

            genus          family      order    class   phylum genus_no family_no order_no class_no phylum_no
     Peritresius  Pancheloniidae Testudines Reptilia Chordata    36360    165650    56475    36322     33815
     Rhetechelys Thalassemydidae Testudines Reptilia Chordata   128349     65907    56475    36322     33815
  Aspideretoides    Trionychidae Testudines Reptilia Chordata    67335     37674    56475    36322     33815
      Judithemys     Sinemydidae Testudines Reptilia Chordata    56471     37757    56475    36322     33815
            <NA>    Trionychidae Testudines Reptilia Chordata       NA     37674    56475    36322     33815
     Taphrosphys   Bothremydidae Testudines Reptilia Chordata    37608     67318    56475    36322     33815
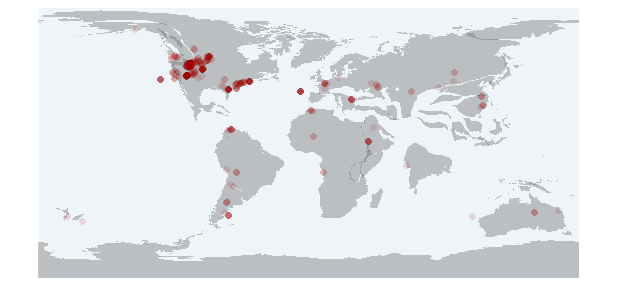
pm_plot
Returns a plot with the paleomap and the fossil occurrences.
data  <-  pm_getdata (base_name="Testudines",
                      interval="Paleocene")
pm_plot (interval="Paleocene", data)
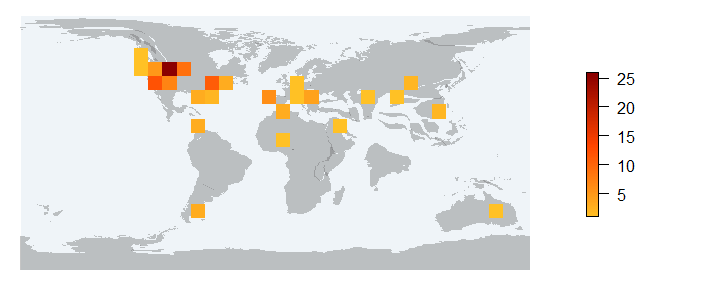
pm_occraster Returns a RasterLayer of the sampling effort and a map with the raster on it.
> shape <- pm_getmap(interval="Paleocene")
> data <- pm_getdata (base_name="Testudines",
                    interval="Paleocene")
> pm_occraster (shape, data, rank="species")
class       : RasterLayer
dimensions  : 18, 36, 648  (nrow, ncol, ncell)
resolution  : 10, 10  (x, y)
extent      : -180, 180, -92.0605, 87.9395  (xmin, xmax, ymin, ymax)
coord. ref. : NA
data source : in memory
names       : layer
values      : 1, 26  (min, max)
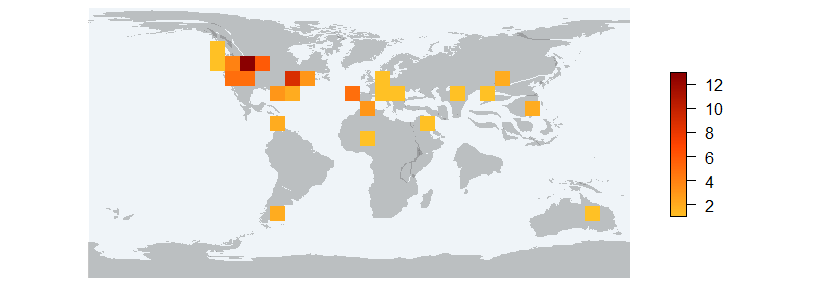
pm_richraster Returns a RasterLayer of richness and a map with the raster on it.
> pm_richraster (shape, data, rank="species")
class       : RasterLayer
dimensions  : 18, 36, 648  (nrow, ncol, ncell)
resolution  : 10, 10  (x, y)
extent      : -180, 180, -92.0605, 87.9395  (xmin, xmax, ymin, ymax)
coord. ref. : NA
data source : in memory
names       : layer
values      : 1, 13  (min, max)
pm_occ Returns a dataframe of taxa occurrences vs. localities (~ sites per taxa matrix)
> occ<- pm_occ (data, rank="species")
> str (occ)'data.frame': 75 obs. of 54 variables:
$ paleolat : num 40.1 38.8 40.9 53.1 10.1 ...
$ paleolng : num -44.5 -47.6 -39.8 -78.2 42.8 ...
$ Peritresius ornatus : num 1 0 1 0 0 0 0 0 0 0 ...
$ Aspideretoides virginianus: num 0 1 0 0 0 0 0 0 0 0 ...
$ Agomphus pectoralis : num 0 0 1 0 0 0 0 0 0 0 ...
$ Osteopygis emarginatus : num 0 0 1 0 0 0 0 0 0 0 ...
$ Cardichelyon rogerwoodi : num 0 0 0 1 0 0 0 0 0 0 ...
$ Arabemys crassiscutata : num 0 0 0 0 1 0 0 0 0 0 ...
$ Protochelydra zangerli : num 0 0 0 0 0 1 0 0 0 0 ...
$ Compsemys victa : num 0 0 0 0 0 0 1 2 1 1 ...
$ Taphrosphys sulcatus : num 0 0 0 0 0 0 0 0 0 0 ...
$ Agomphus oxysternum : num 0 0 0 0 0 0 0 0 0 0 ...
$ Bothremys maghrebiana : num 0 0 0 0 0 0 0 0 0 0 ...
$ Taphrosphys ippolitoi : num 0 0 0 0 0 0 0 0 0 0 ...
$ Rhothonemys brinkmani : num 0 0 0 0 0 0 0 0 0 0 ...
$ Agomphus alabamensis : num 0 0 0 0 0 0 0 0 0 0 ...
$ Cerrejonemys wayuunaiki : num 0 0 0 0 0 0 0 0 0 0 ...
$ Acleistochelys maliensis : num 0 0 0 0 0 0 0 0 0 0 ...
$ Yaminuechelys maior : num 0 0 0 0 0 0 0 0 0 0 ...
$ Naiadochelys patagonica : num 0 0 0 0 0 0 0 0 0 0 ...
$ Palatobaena bairdi : num 0 0 0 0 0 0 0 0 0 0 ...
$ Cedrobaena putorius : num 0 0 0 0 0 0 0 0 0 0 ...
$ Euclastes acutirostris : num 0 0 0 0 0 0 0 0 0 0 ...
$ Eosphargis insularis : num 0 0 0 0 0 0 0 0 0 0 ...
$ Osteopygis roundsi : num 0 0 0 0 0 0 0 0 0 0 ...
$ Tasbacka ruhoffi : num 0 0 0 0 0 0 0 0 0 0 ...
$ Mongolemys trufanensis : num 0 0 0 0 0 0 0 0 0 0 ...
$ Labrostochelys galkini : num 0 0 0 0 0 0 0 0 0 0 ...
$ Alamosemys substricta : num 0 0 0 0 0 0 0 0 0 0 ...
$ Hoplochelys crassa : num 0 0 0 0 0 0 0 0 0 0 ...
$ Conchochelys admirabilis : num 0 0 0 0 0 0 0 0 0 0 ...
$ Axestemys puercensis : num 0 0 0 0 0 0 0 0 0 0 ...
$ Puentemys mushaisaensis : num 0 0 0 0 0 0 0 0 0 0 ...
$ Berruchelus russelli : num 0 0 0 0 0 0 0 0 0 0 ...
$ Judithemys backmani : num 0 0 0 0 0 0 0 0 0 0 ...
$ Hutchemys rememdium : num 0 0 0 0 0 0 0 0 0 0 ...
$ Ronella botanica : num 0 0 0 0 0 0 0 0 0 0 ...
$ Paramongolemys khosatzkyi : num 0 0 0 0 0 0 0 0 0 0 ...
$ Elkemys australis : num 0 0 0 0 0 0 0 0 0 0 ...
$ Hokouchelys chenshuensis : num 0 0 0 0 0 0 0 0 0 0 ...
$ Axestemys montinsana : num 0 0 0 0 0 0 0 0 0 0 ...
$ Tasbacka ouledabdounensis : num 0 0 0 0 0 0 0 0 0 0 ...
$ Tasbacka aldabergeni : num 0 0 0 0 0 0 0 0 0 0 ...
$ Catapleura repanda : num 0 0 0 0 0 0 0 0 0 0 ...
$ Judithemys kranzi : num 0 0 0 0 0 0 0 0 0 0 ...
$ Trionyx halophilus : num 0 0 0 0 0 0 0 0 0 0 ...
$ Atoposemys entopteros : num 0 0 0 0 0 0 0 0 0 0 ...
$ Tullochelys montana : num 0 0 0 0 0 0 0 0 0 0 ...
$ Stygiochelys estesi : num 0 0 0 0 0 0 0 0 0 0 ...
$ Mongolemys reshetovi : num 0 0 0 0 0 0 0 0 0 0 ...
$ Chelodina alanrixi : num 0 0 0 0 0 0 0 0 0 0 ...
$ Derrisemys sterea : num 0 0 0 0 0 0 0 0 0 0 ...
$ Plastomenoides tetanetron : num 0 0 0 0 0 0 0 0 0 0 ...
$ Plastomenoides lamberti : num 0 0 0 0 0 0 0 0 0 0 ...pm_occ_cell Returns a dataframe of taxa occurrences vs. cells (aggregation of taxa based on cells and not on localities like pm_occ)
> occ_cell<- pm_occ_cell (data, rank="species", res=10)
> str (occ_cell)'data.frame': 648 obs. of 54 variables:
$ long : num -175 -165 -155 -145 -135 -125 -115 -105 -95 -85 ...
$ lat : num -85 -85 -85 -85 -85 -85 -85 -85 -85 -85 ...
$ Peritresius ornatus : num 0 0 0 0 0 0 0 0 0 0 ...
$ Aspideretoides virginianus: num 0 0 0 0 0 0 0 0 0 0 ...
$ Agomphus pectoralis : num 0 0 0 0 0 0 0 0 0 0 ...
$ Osteopygis emarginatus : num 0 0 0 0 0 0 0 0 0 0 ...
$ Cardichelyon rogerwoodi : num 0 0 0 0 0 0 0 0 0 0 ...
$ Arabemys crassiscutata : num 0 0 0 0 0 0 0 0 0 0 ...
$ Protochelydra zangerli : num 0 0 0 0 0 0 0 0 0 0 ...
$ Compsemys victa : num 0 0 0 0 0 0 0 0 0 0 ...
$ Taphrosphys sulcatus : num 0 0 0 0 0 0 0 0 0 0 ...
$ Agomphus oxysternum : num 0 0 0 0 0 0 0 0 0 0 ...
$ Bothremys maghrebiana : num 0 0 0 0 0 0 0 0 0 0 ...
$ Taphrosphys ippolitoi : num 0 0 0 0 0 0 0 0 0 0 ...
$ Rhothonemys brinkmani : num 0 0 0 0 0 0 0 0 0 0 ...
$ Agomphus alabamensis : num 0 0 0 0 0 0 0 0 0 0 ...
$ Cerrejonemys wayuunaiki : num 0 0 0 0 0 0 0 0 0 0 ...
$ Acleistochelys maliensis : num 0 0 0 0 0 0 0 0 0 0 ...
$ Yaminuechelys maior : num 0 0 0 0 0 0 0 0 0 0 ...
$ Naiadochelys patagonica : num 0 0 0 0 0 0 0 0 0 0 ...
$ Palatobaena bairdi : num 0 0 0 0 0 0 0 0 0 0 ...
$ Cedrobaena putorius : num 0 0 0 0 0 0 0 0 0 0 ...
$ Euclastes acutirostris : num 0 0 0 0 0 0 0 0 0 0 ...
$ Eosphargis insularis : num 0 0 0 0 0 0 0 0 0 0 ...
$ Osteopygis roundsi : num 0 0 0 0 0 0 0 0 0 0 ...
$ Tasbacka ruhoffi : num 0 0 0 0 0 0 0 0 0 0 ...
$ Mongolemys trufanensis : num 0 0 0 0 0 0 0 0 0 0 ...
$ Labrostochelys galkini : num 0 0 0 0 0 0 0 0 0 0 ...
$ Alamosemys substricta : num 0 0 0 0 0 0 0 0 0 0 ...
$ Hoplochelys crassa : num 0 0 0 0 0 0 0 0 0 0 ...
$ Conchochelys admirabilis : num 0 0 0 0 0 0 0 0 0 0 ...
$ Axestemys puercensis : num 0 0 0 0 0 0 0 0 0 0 ...
$ Puentemys mushaisaensis : num 0 0 0 0 0 0 0 0 0 0 ...
$ Berruchelus russelli : num 0 0 0 0 0 0 0 0 0 0 ...
$ Judithemys backmani : num 0 0 0 0 0 0 0 0 0 0 ...
$ Hutchemys rememdium : num 0 0 0 0 0 0 0 0 0 0 ...
$ Ronella botanica : num 0 0 0 0 0 0 0 0 0 0 ...
$ Paramongolemys khosatzkyi : num 0 0 0 0 0 0 0 0 0 0 ...
$ Elkemys australis : num 0 0 0 0 0 0 0 0 0 0 ...
$ Hokouchelys chenshuensis : num 0 0 0 0 0 0 0 0 0 0 ...
$ Axestemys montinsana : num 0 0 0 0 0 0 0 0 0 0 ...
$ Tasbacka ouledabdounensis : num 0 0 0 0 0 0 0 0 0 0 ...
$ Tasbacka aldabergeni : num 0 0 0 0 0 0 0 0 0 0 ...
$ Catapleura repanda : num 0 0 0 0 0 0 0 0 0 0 ...
$ Judithemys kranzi : num 0 0 0 0 0 0 0 0 0 0 ...
$ Trionyx halophilus : num 0 0 0 0 0 0 0 0 0 0 ...
$ Atoposemys entopteros : num 0 0 0 0 0 0 0 0 0 0 ...
$ Tullochelys montana : num 0 0 0 0 0 0 0 0 0 0 ...
$ Stygiochelys estesi : num 0 0 0 0 0 0 0 0 0 0 ...
$ Mongolemys reshetovi : num 0 0 0 0 0 0 0 0 0 0 ...
$ Chelodina alanrixi : num 0 0 0 0 0 0 0 0 0 0 ...
$ Derrisemys sterea : num 0 0 0 0 0 0 0 0 0 0 ...
$ Plastomenoides tetanetron : num 0 0 0 0 0 0 0 0 0 0 ...
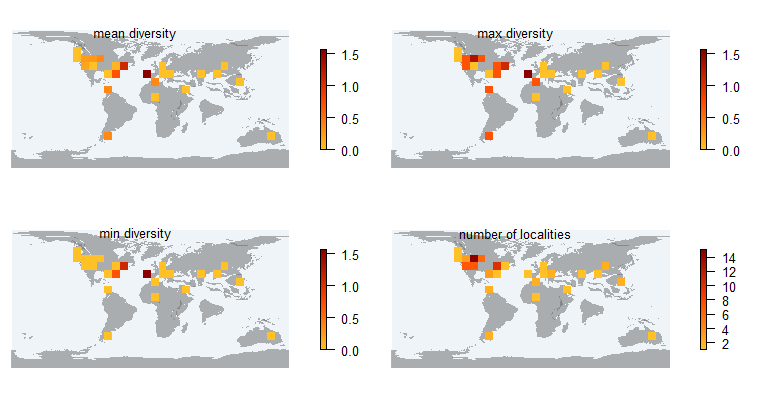
$ Plastomenoides lamberti : num 0 0 0 0 0 0 0 0 0 0 ...pm_divraster_loc 1- calculates the Shannon diversity per unique locality (based on its coordinates), 2- makes a raster file and a plot showing mean, max, min diversity per cell, or number of unique localities per cell
> occ_df <- pm_occ (data, rank="species")
> pm_divraster_loc (shape, occ_df, fun=mean)
> pm_divraster_loc (shape, occ_df, fun=max)
> pm_divraster_loc (shape, occ_df, fun=min)
> pm_divraster_loc (shape, occ_df, fun="count")
class       : RasterLayer
dimensions  : 18, 36, 648  (nrow, ncol, ncell)
resolution  : 10, 10  (x, y)
extent      : -180, 180, -92.0605, 87.9395  (xmin, xmax, ymin, ymax)
coord. ref. : NA
data source : in memory
names       : layer
values      : 1, 15  (min, max)
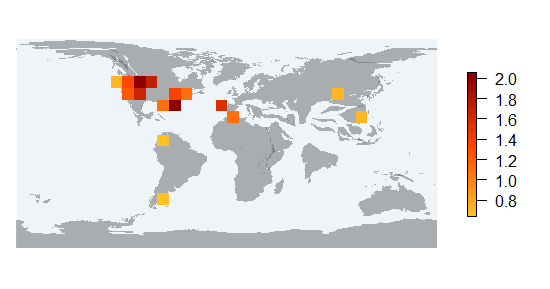
pm_divraster_cell calculates the Shannon diversity per cell (taking into account relative abundances of all the fossil records whithin the cell)
occ_df_cell <- pm_occ_cell (data, rank="species")
pm_divraster_cell (shape, occ_df_cell, res=10)
class : RasterLayer
dimensions : 18, 36, 648 (nrow, ncol, ncell)
resolution : 10, 10 (x, y)
extent : -180, 180, -92.0605, 87.9395 (xmin, xmax, ymin, ymax)
coord. ref. : NA
data source : in memory
names : layer
values : 0.6365142, 2.059229 (min, max)pm_latrich calculates latitudinal diversity of taxa (species, genera, families, orders)
> pm_latrich (shape, data, rank="species", res=10) lat_min lat_max richn
1 -90 -80 0
2 -80 -70 0
3 -70 -60 0
4 -60 -50 0
5 -50 -40 3
6 -40 -30 0
7 -30 -20 0
8 -20 -10 0
9 -10 0 0
10 0 10 3
11 10 20 1
12 20 30 6
13 30 40 17
14 40 50 17
15 50 60 13
16 60 70 0
17 70 80 0
18 80 90 0pm_latdiv
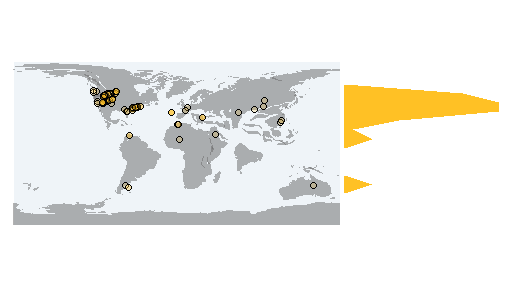
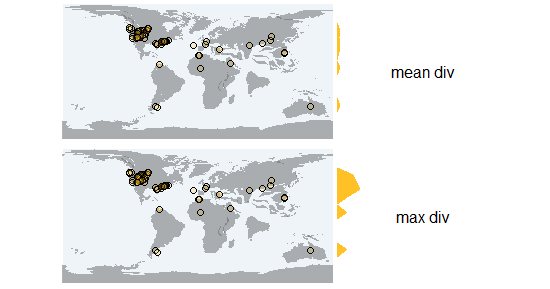
calculates the Shannon diversity along the latitudinal gradient based on the individual values of diverstiy the fossil localities of those latitudes. The function returns the mean or max values of diversity of the sampled localities along the latitudinal gradient.
> occ_df <- pm_occ (data)
> pm_latdiv (occ_df, shape, fun=mean)
> pm_latdiv (occ_df, shape, fun=max)
   maxlat minlat       div
1     -90    -80 0.0000000
2     -80    -70 0.0000000
3     -70    -60 0.0000000
4     -60    -50 0.0000000
5     -50    -40 0.6931472
6     -40    -30 0.0000000
7     -30    -20 0.0000000
8     -20    -10 0.0000000
9     -10      0 0.0000000
10      0     10 0.6931472
11     10     20 0.0000000
12     20     30 0.6931472
13     30     40 1.5607104
14     40     50 1.3321790
15     50     60 1.0986123
16     60     70 0.0000000
17     70     80 0.0000000
18 80 90 0.0000000Please report any issues or bugs.
License: GPL-2
To cite package paleoMap in publications use:
To cite package `paleoMap` in publications use:

Sara Varela, K. Sonja Rothkugel (2015). paleoMap:  combine paleogeography and paleobiodiversity. R package version 0.1. https://github.com/macroecology/paleoMap

A BibTeX entry for LaTeX users is

  @Manual{,
    title = {paleoMap:  combine paleogeography and paleobiodiversity},
    author = {Sara Varela} and {Sonja Rothkugel},
    year = {2016},
    note = {R package version 0.1},
    base = {https://github.com/macroecology/paleoMap},
  }