Using data from Oryx's site, I've put together a quick tracker to visualize equipment losses since Russia's February 24th invasion of Ukraine. This is only equipment that is independently verified, as noted by Oryx:
This list only includes destroyed vehicles and equipment of which photo or videographic evidence is available. Therefore, the amount of equipment destroyed is significantly higher than recorded here. Small arms, munitions, civilian vehicles, trailers and derelict equipment (including aircraft) are not included in this list. All possible effort has gone into discerning the status of equipment between captured or abandoned. Many of the entries listed as 'abandoned' will likely end up captured or destroyed. Similarly, some of the captured equipment might be destroyed if it can't be recovered. ATGMs and MANPADS are included in the list but not included in the ultimate count. The Soviet flag is used when the equipment in question was produced prior to 1991.
Data is drawn from this public google sheet which is updated based on the last update for each day. As such it is a lagging indicator, dependent not just on when equipment is lost, but when it is discovered and documented.
Data is pulled daily from Oryx's site using Daniel Scarnecchia's scraper tool, and then pushed to the public google sheet, where synthetic calculations are performed for equipment categories (to presere transparency).
Points (red = Russia, blue = Ukraine) represent cumulative losses for each day, bars represent daily losses. The line repreents a general additive model smooth on cumulative losses to date; the shaded grey band represents the 95% confidence interval based on extant variation (e.g. point scatter). A wider grey band means more uncertainty, a narrower grey band means less uncertainty.
Please keep in mind that this is empirical, not inteptetive, analysis. A concern raised about the available data is that it undercounts Ukrainian losses. This is possible not just because of bias (note pro-Russian sources are monitered as well) but because areas under Russian control are less likely to have photo documentation. Fog of war is very real. There is no attempt here to use a modifier to adjust numbers - analysis is strictly empirical. Any bias in the origional data will be reflected in the following analyses.
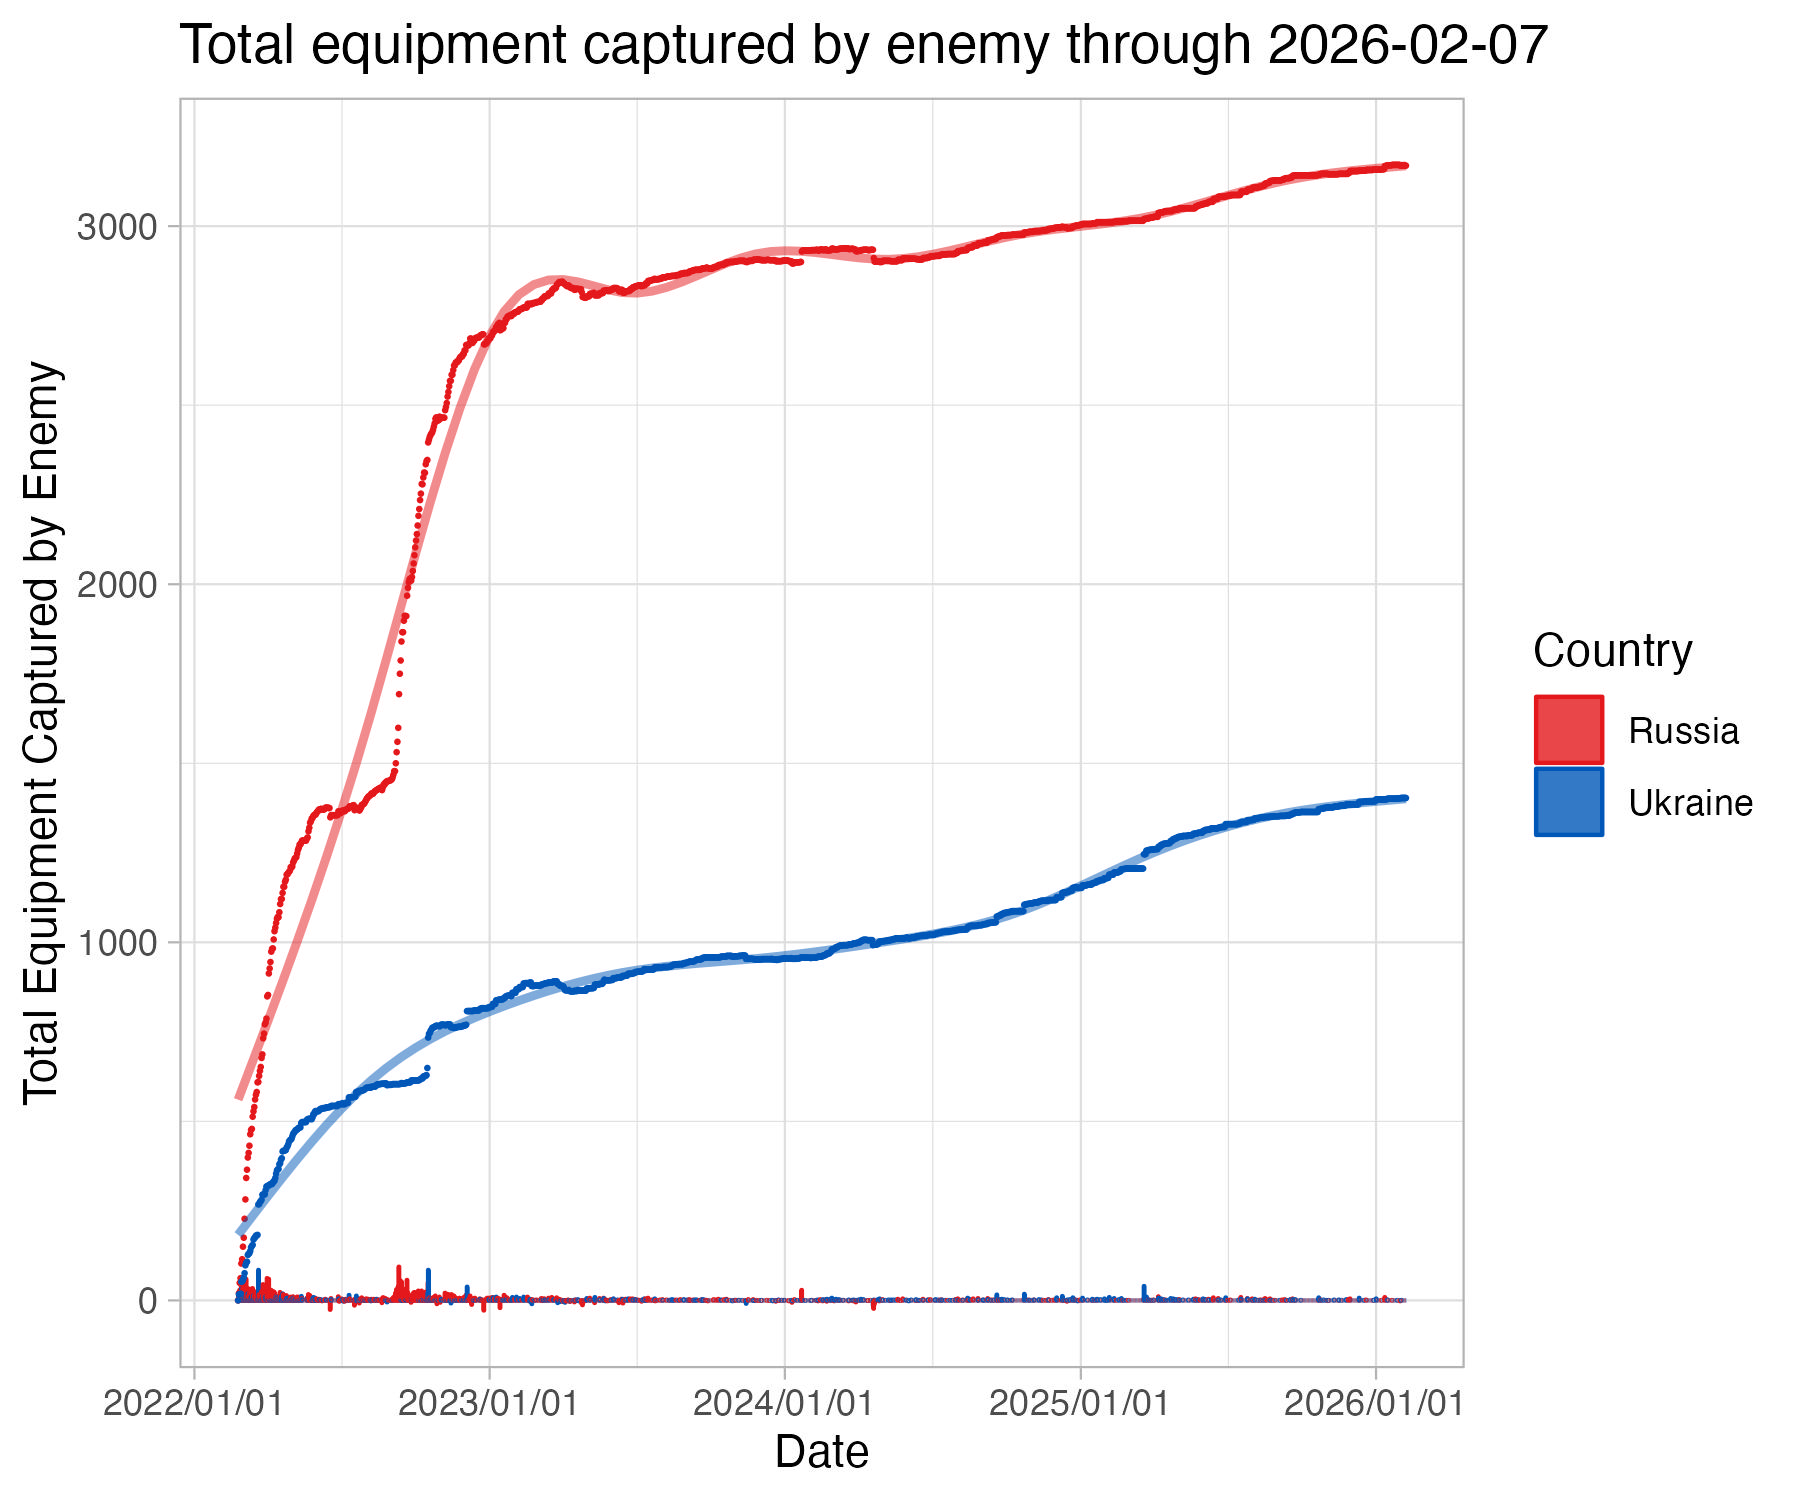
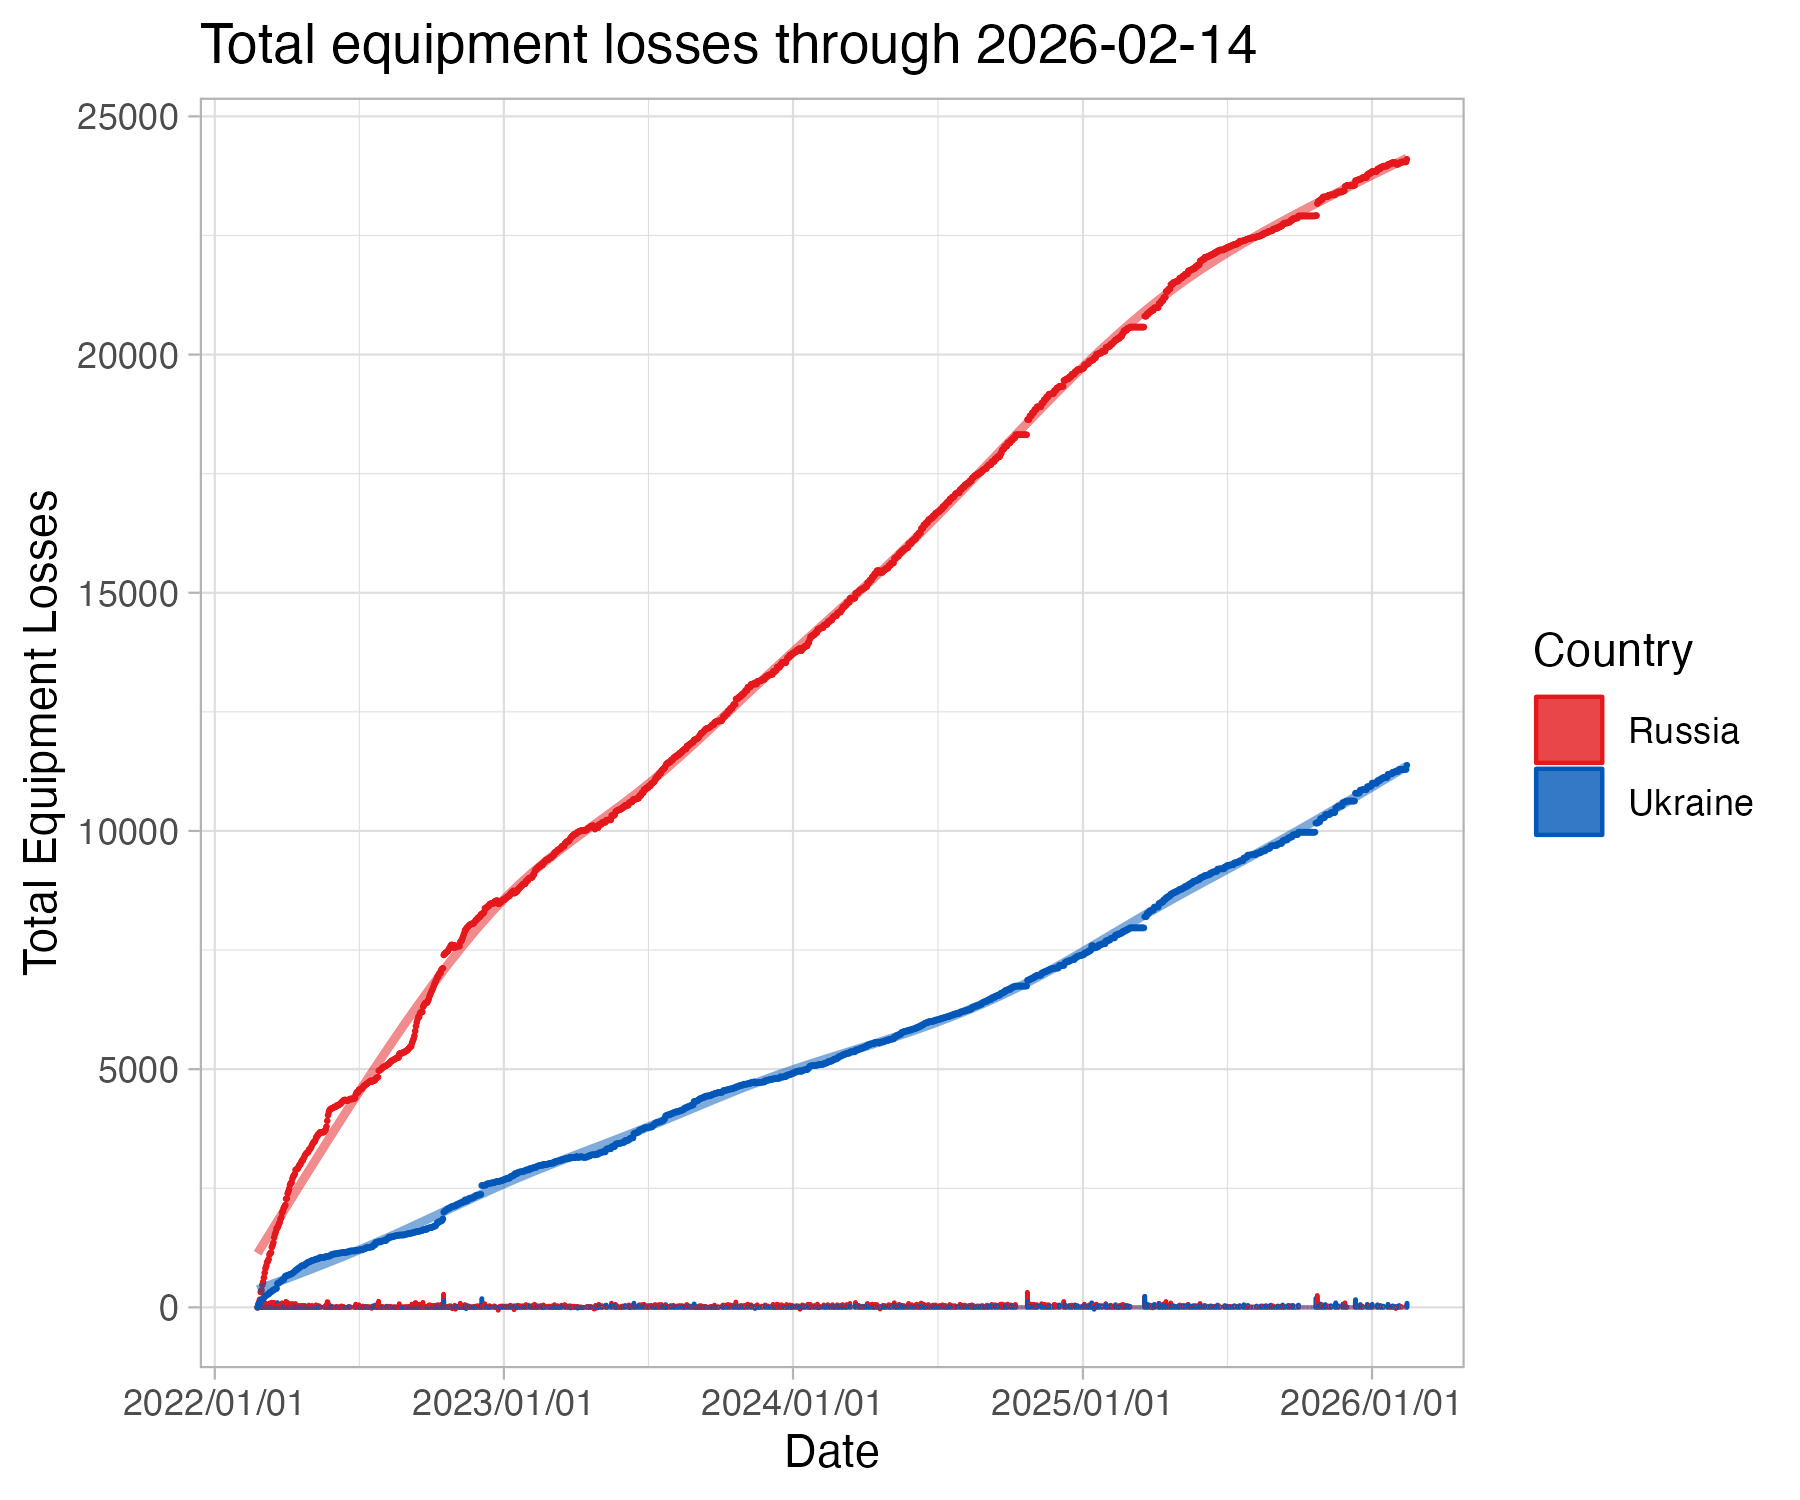 Ukranian and Russian equipment losses started off equivalent, but Russians quickly began to lose more equipment by the third day of the war.
Map data is provided using a google maps base layer with troop locations from Henry Schlottman's GitHub repo. Fire data comes from NASA FIRMS VIIRS sattelite.
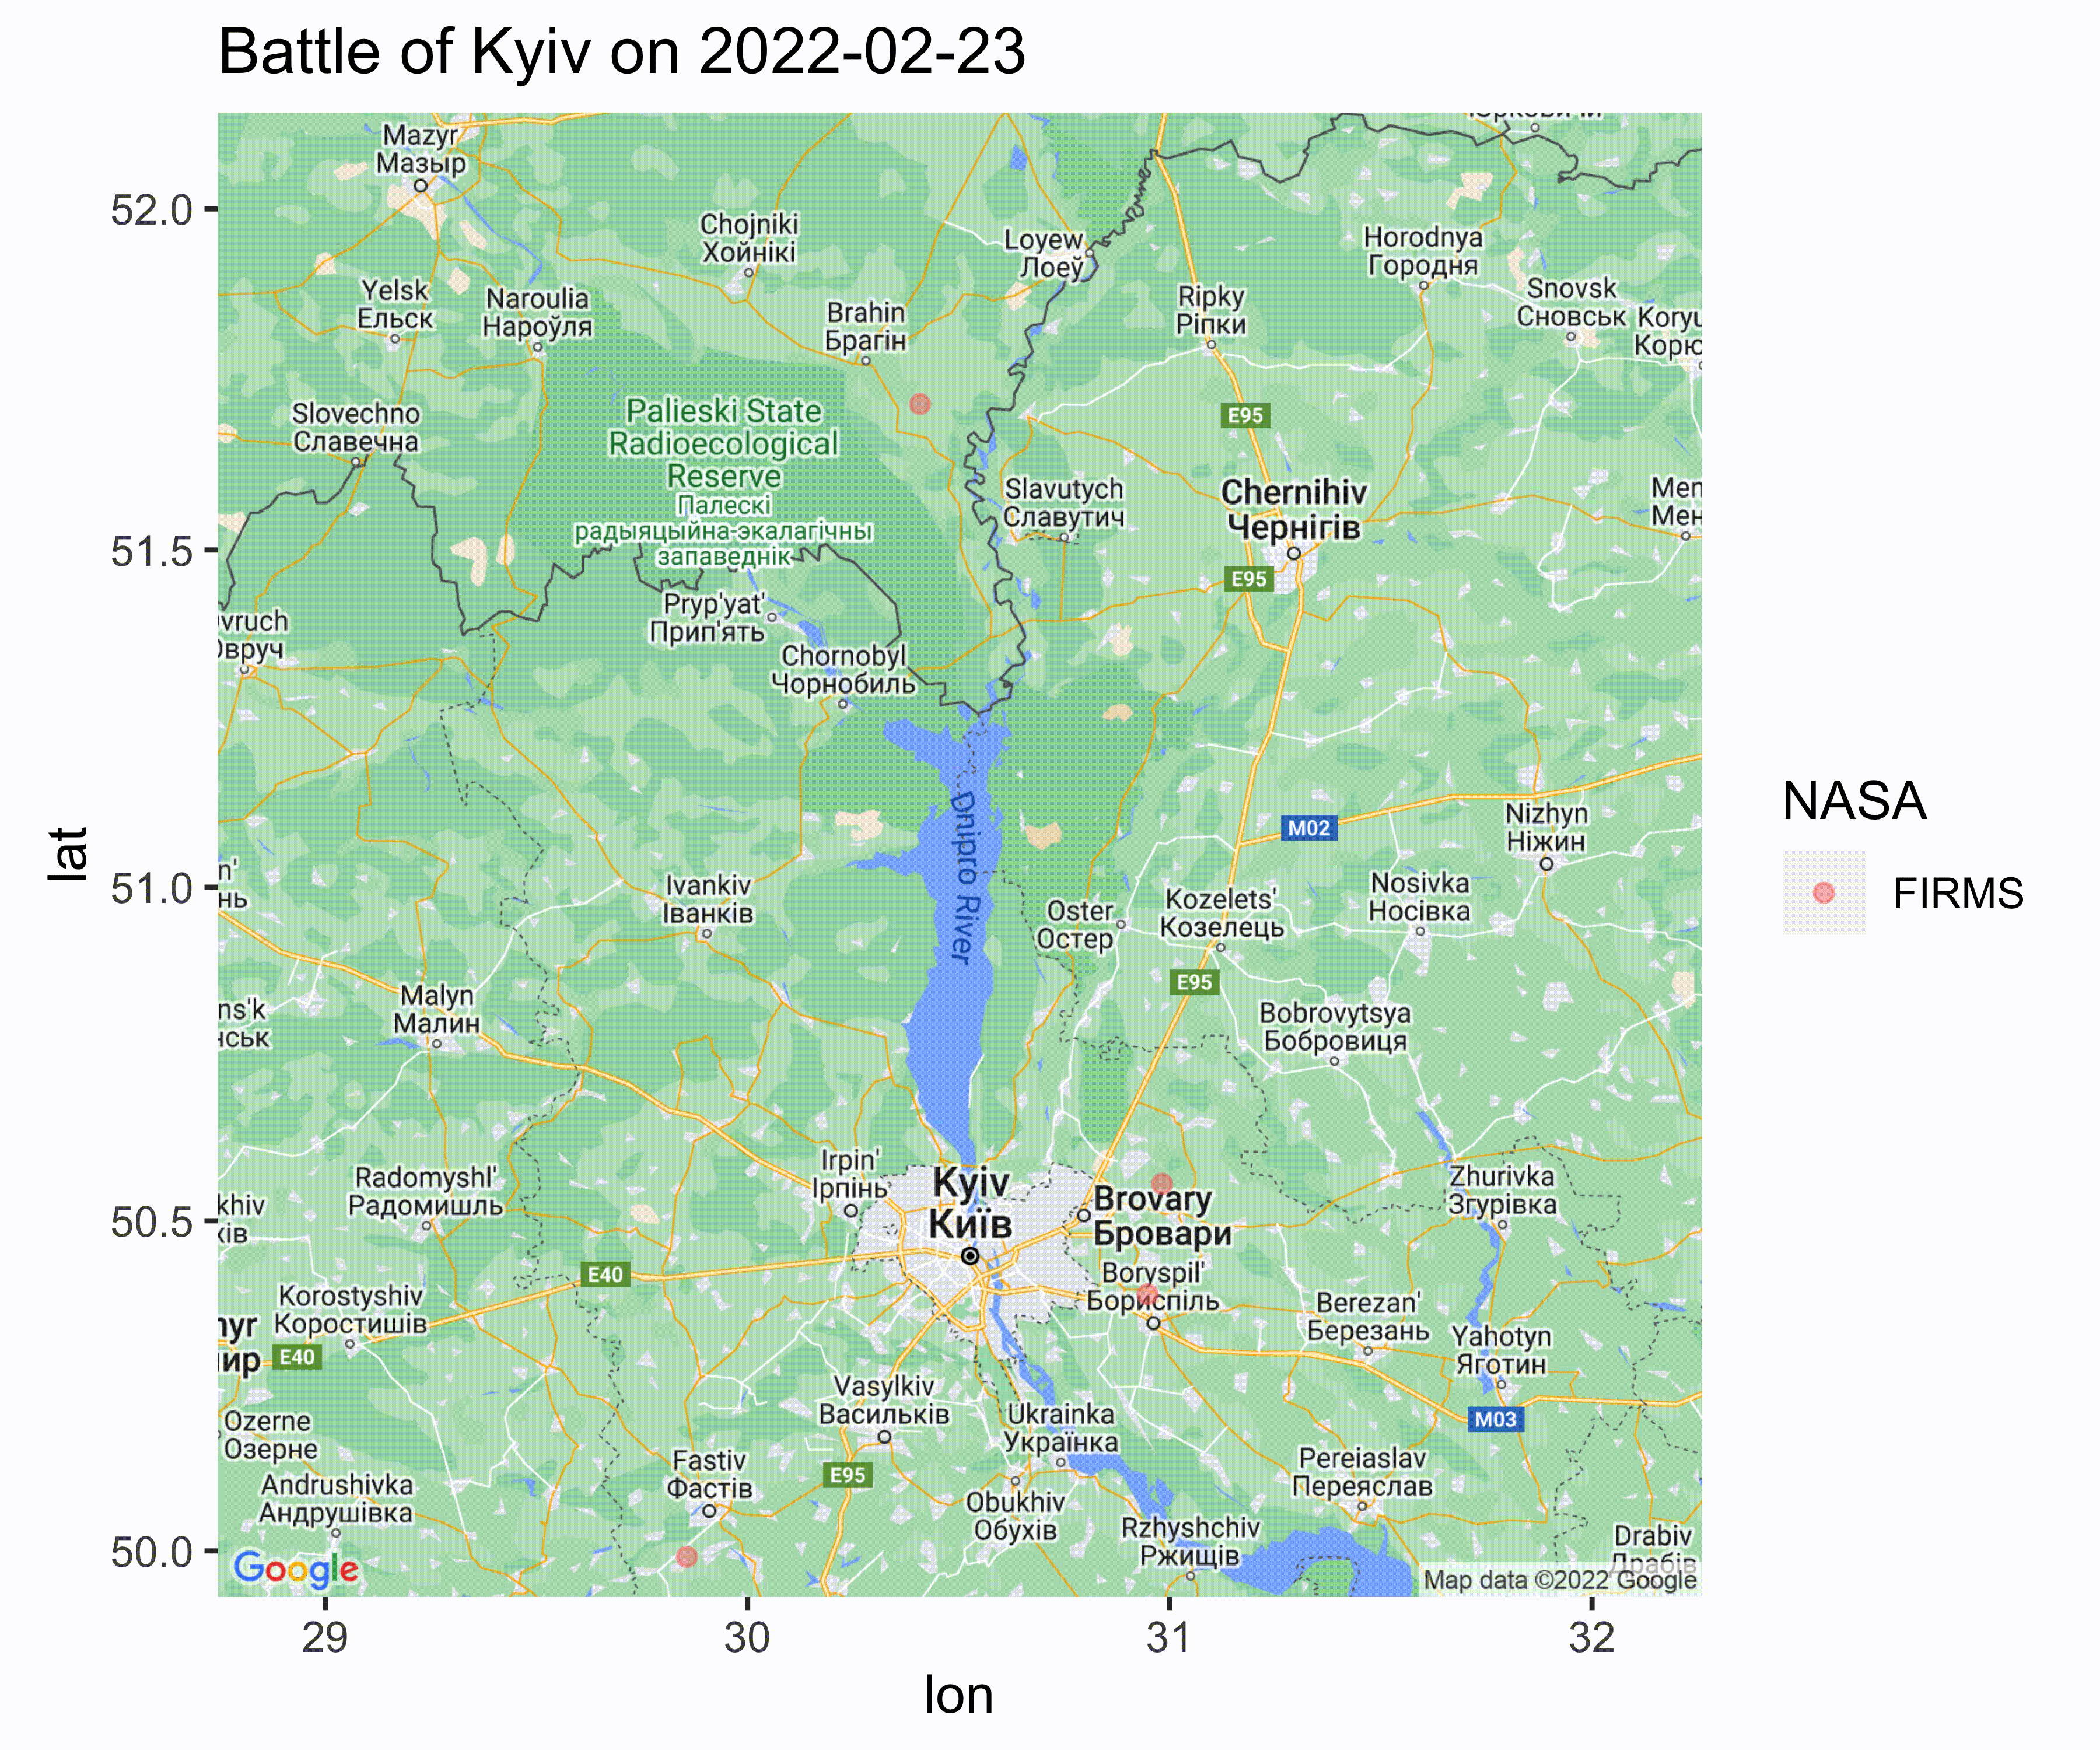 The [Battle of Kyiv](https://en.wikipedia.org/wiki/Battle_of_Kyiv_(2022) concluded at the beginning of April 2022 in a Ukrainan victory. NASA FIRMS analysis indicates that the majority of detectible fire from fighting was in the last two weeks of the conflict (March 15th - April 1st).
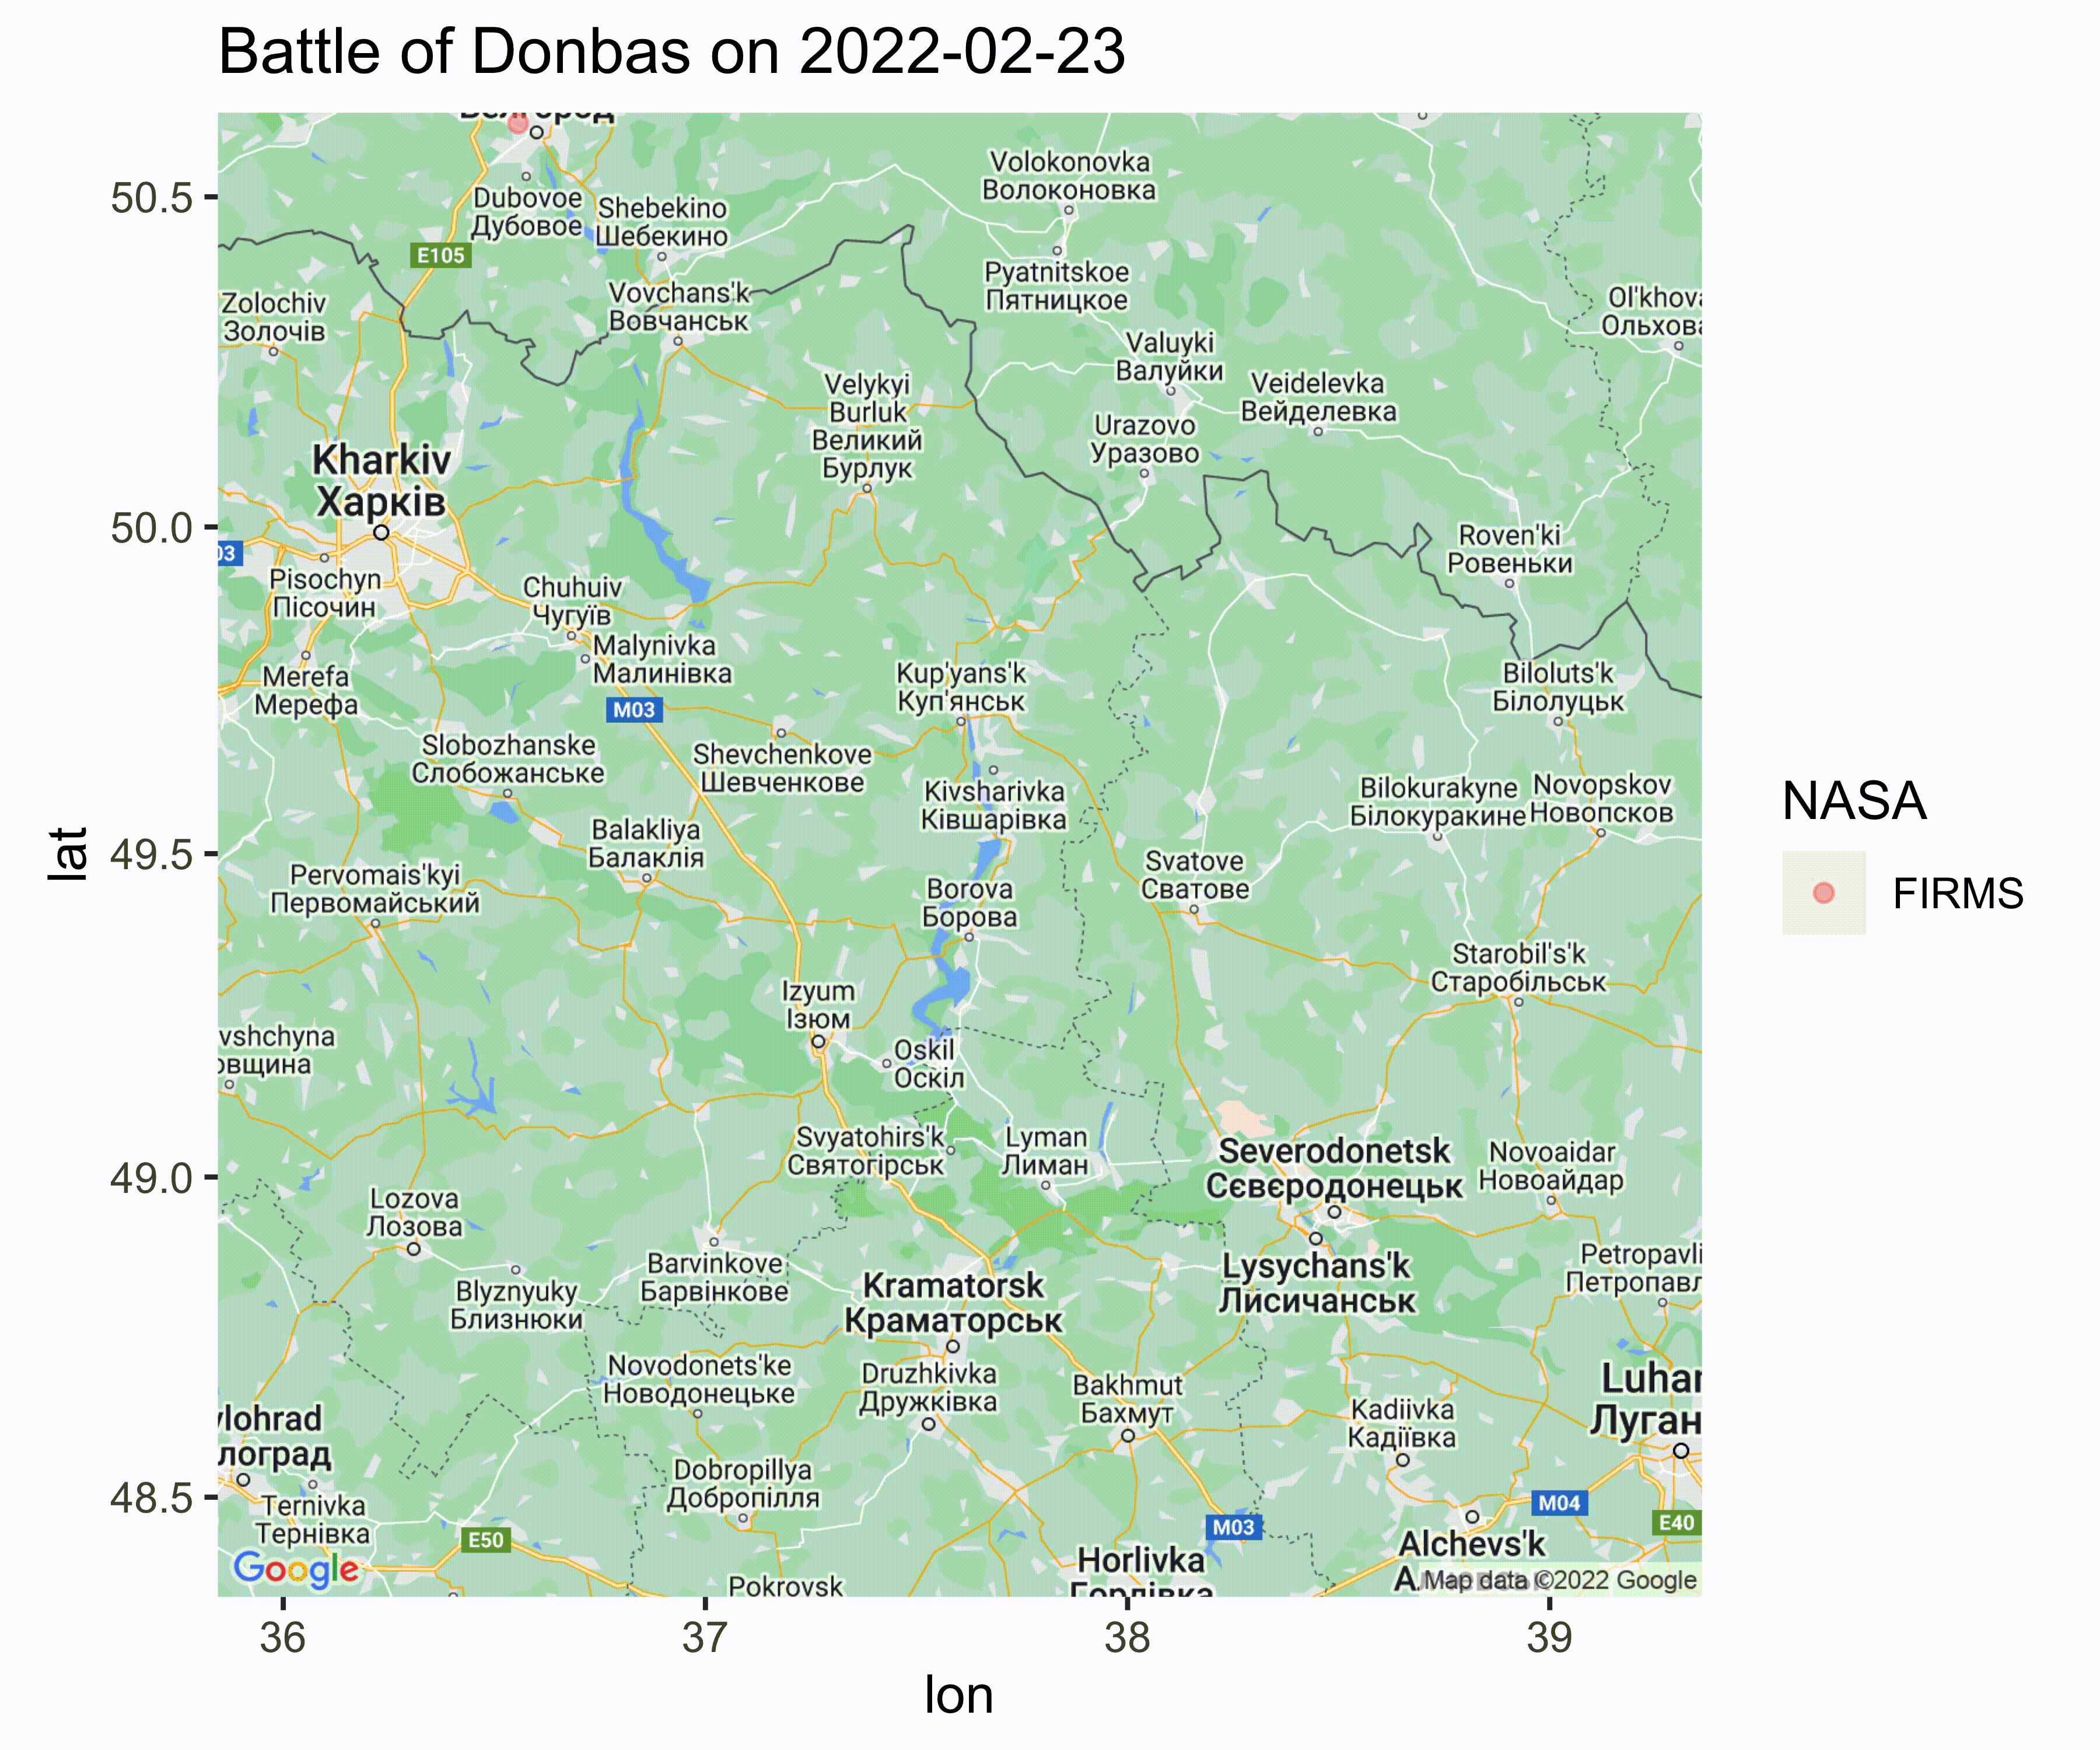
 Russia has concentrated most of its combat forces in the Donbas attempting to breakthrough Ukranian lines established in 2014. FIRMS fire data indicates battles around Izyum, with some progress for Russia to the west.
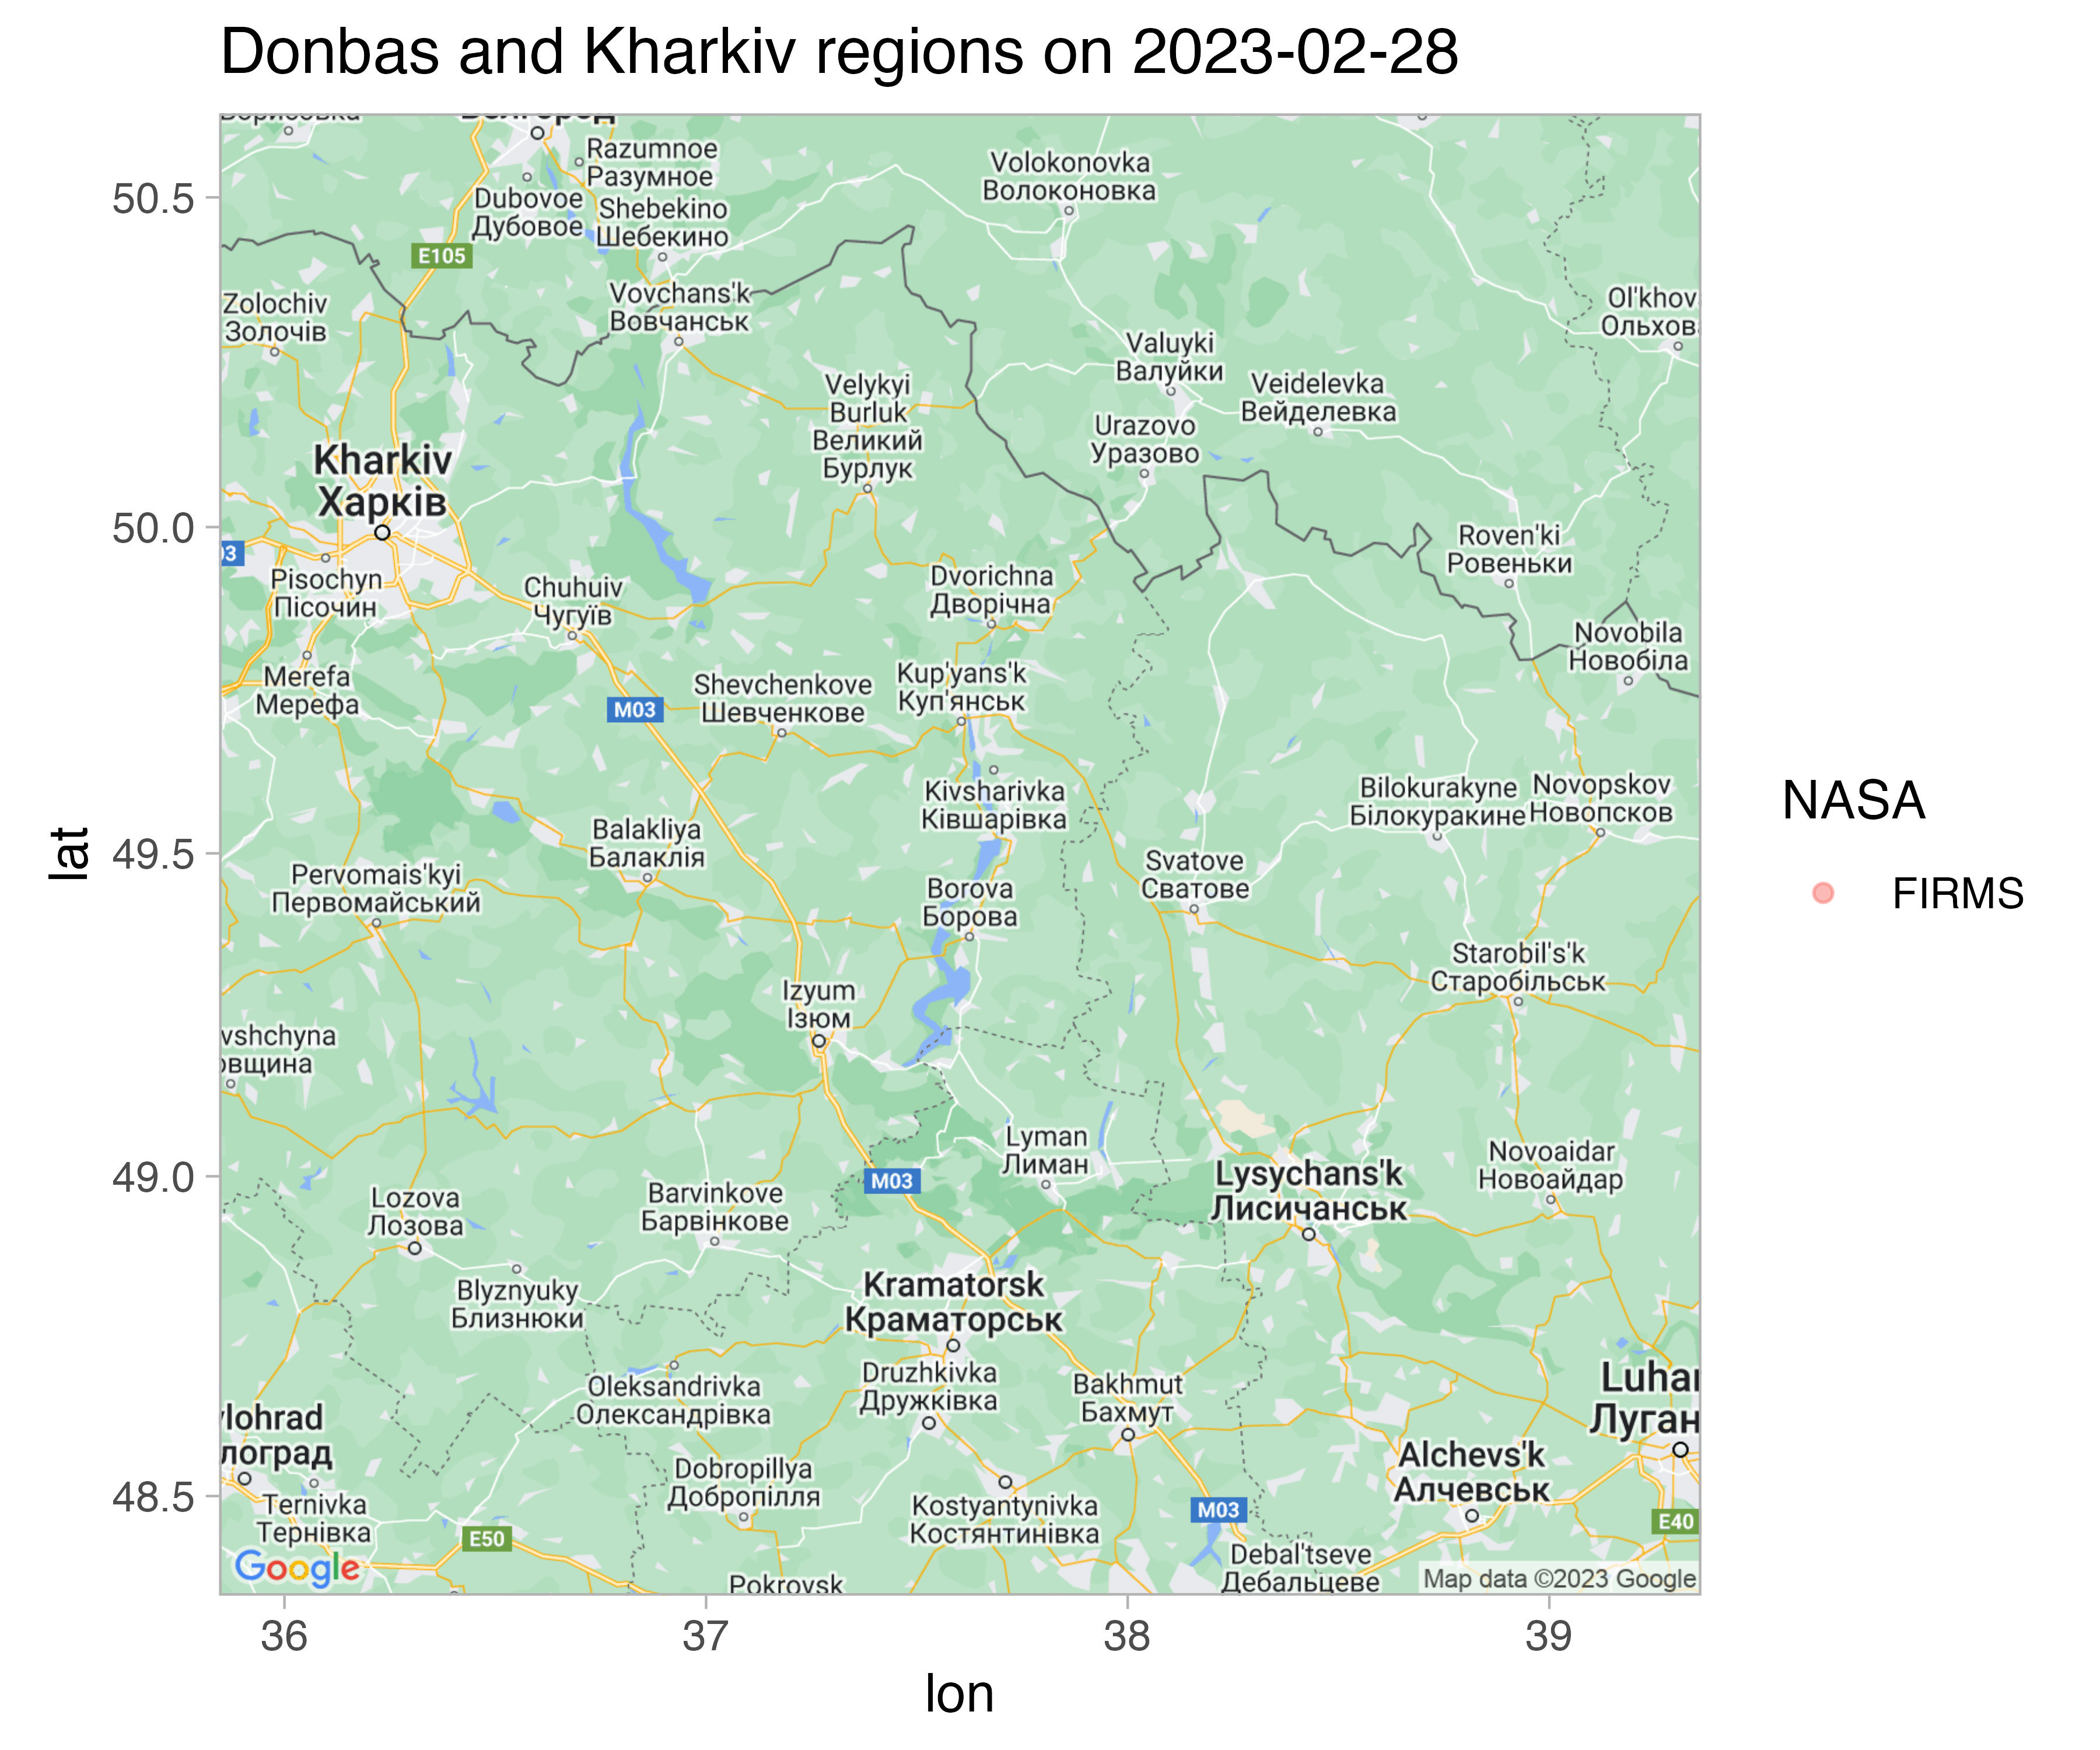
 The [Battle of the Donbas](https://en.wikipedia.org/wiki/Battle_of_Donbas_(2022) has only shown a distinct FIRMS signature since the first week of May, indicating heavy fires all around.
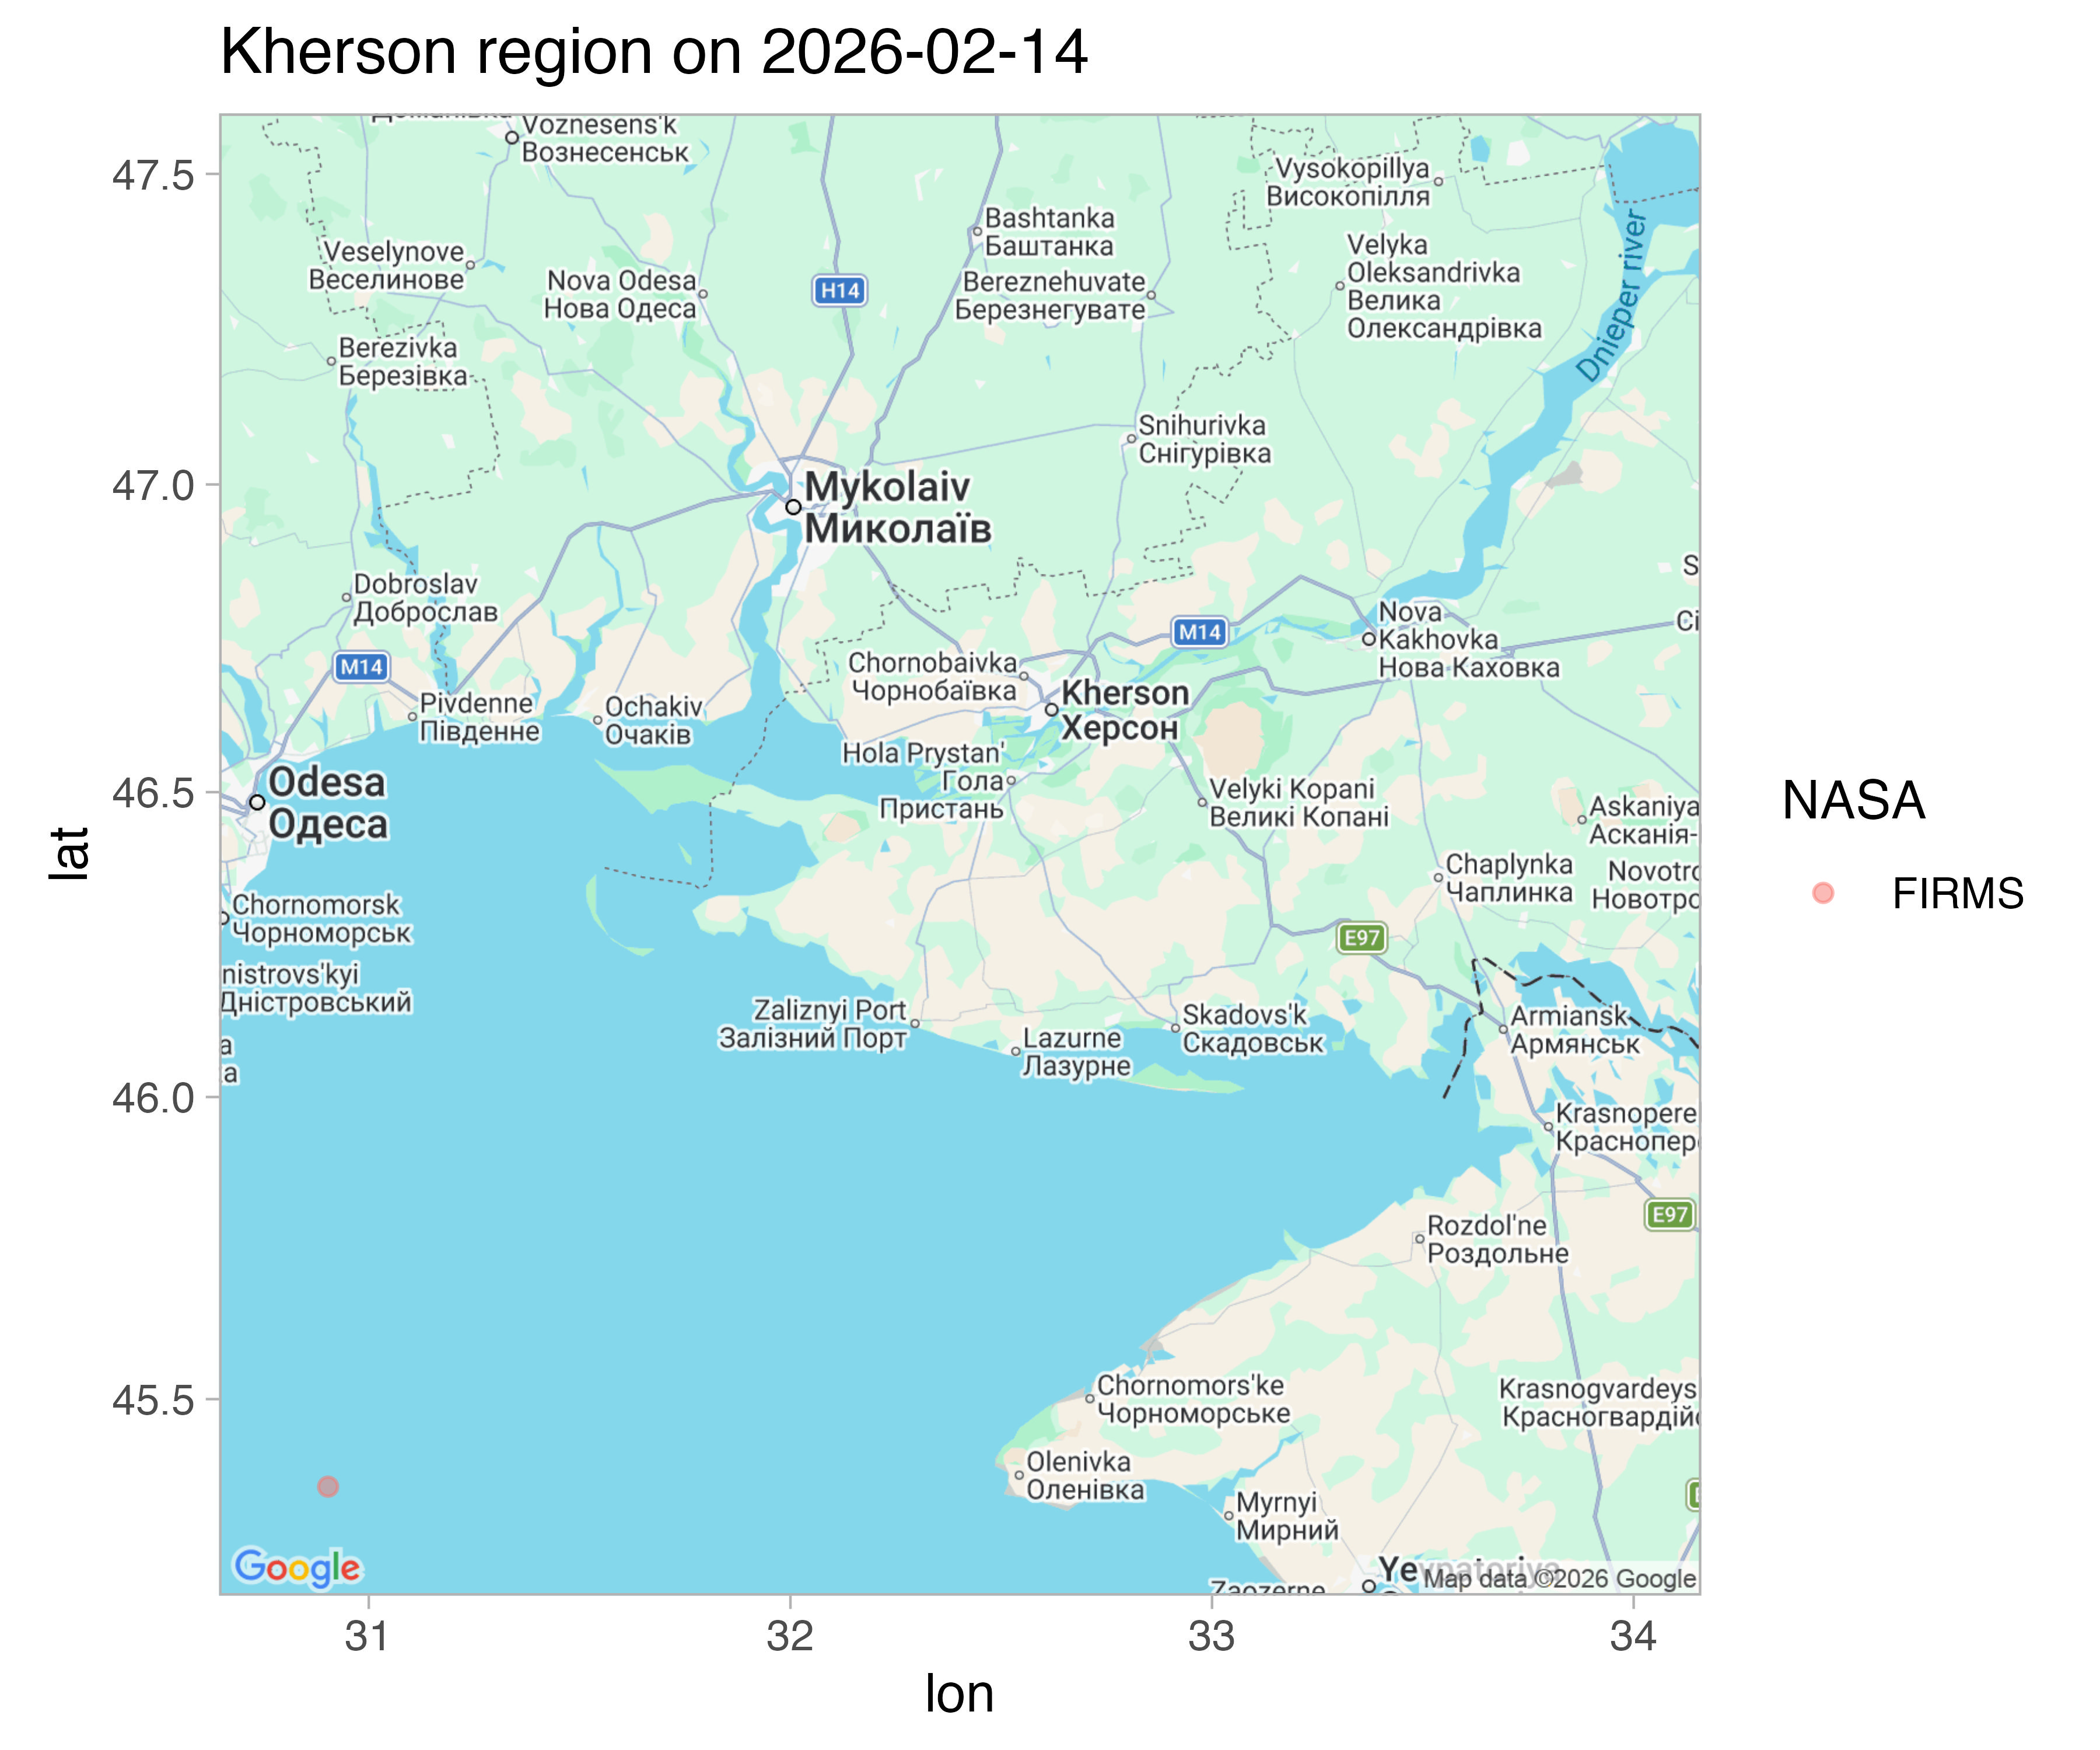 Kherson is an occupied city where the Russian advance was halted. FIRMS data does not indicate heavy combat in the area currently.
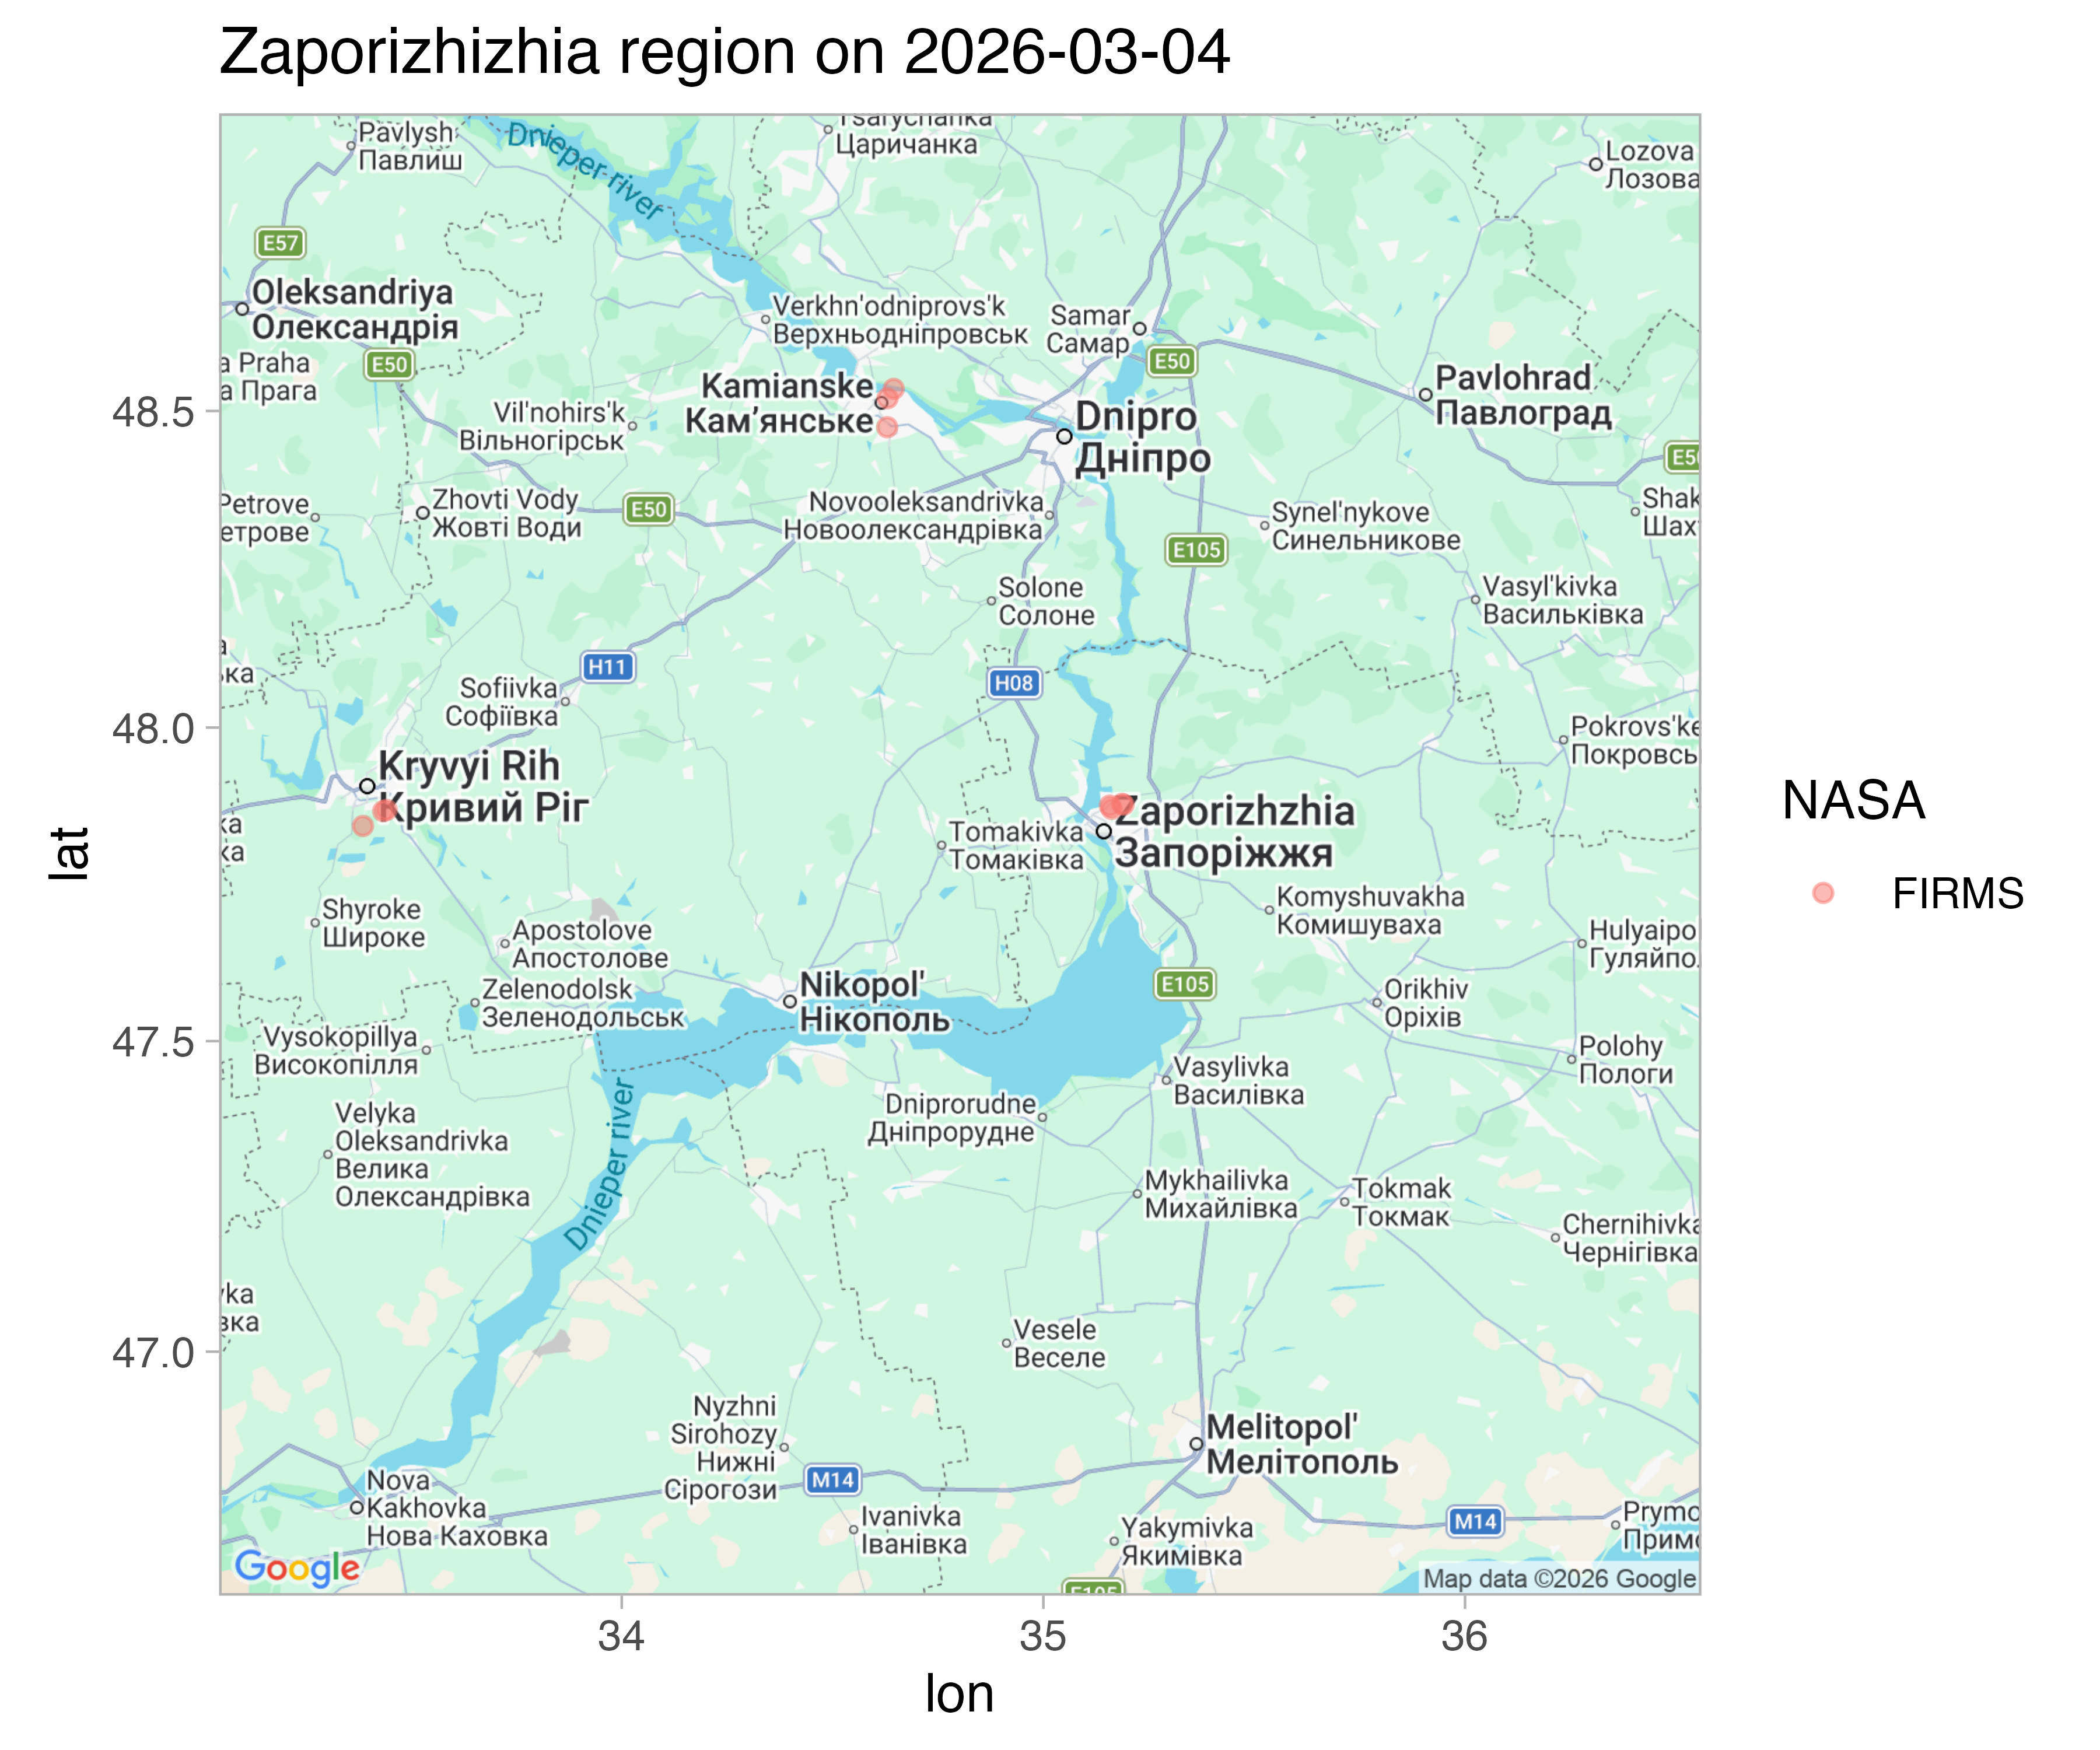 Zaporizhizhia is a comparatively quiet region, but there are isolated artillery strikes around Russian BTGs and missle strikes in population centers.
 Summing megawatts of energy radiated from regions of Ukraine helps highlight the independent war record. The Battle of Kyiv is clearly visible, with detectable fires concentrated in the last two weeks (March 15th - April 1st). The Battle of Donbas, following a repositioning of Russian forces, shows a more brief but just as intense spike in radiation confined to the first two weeks of May.
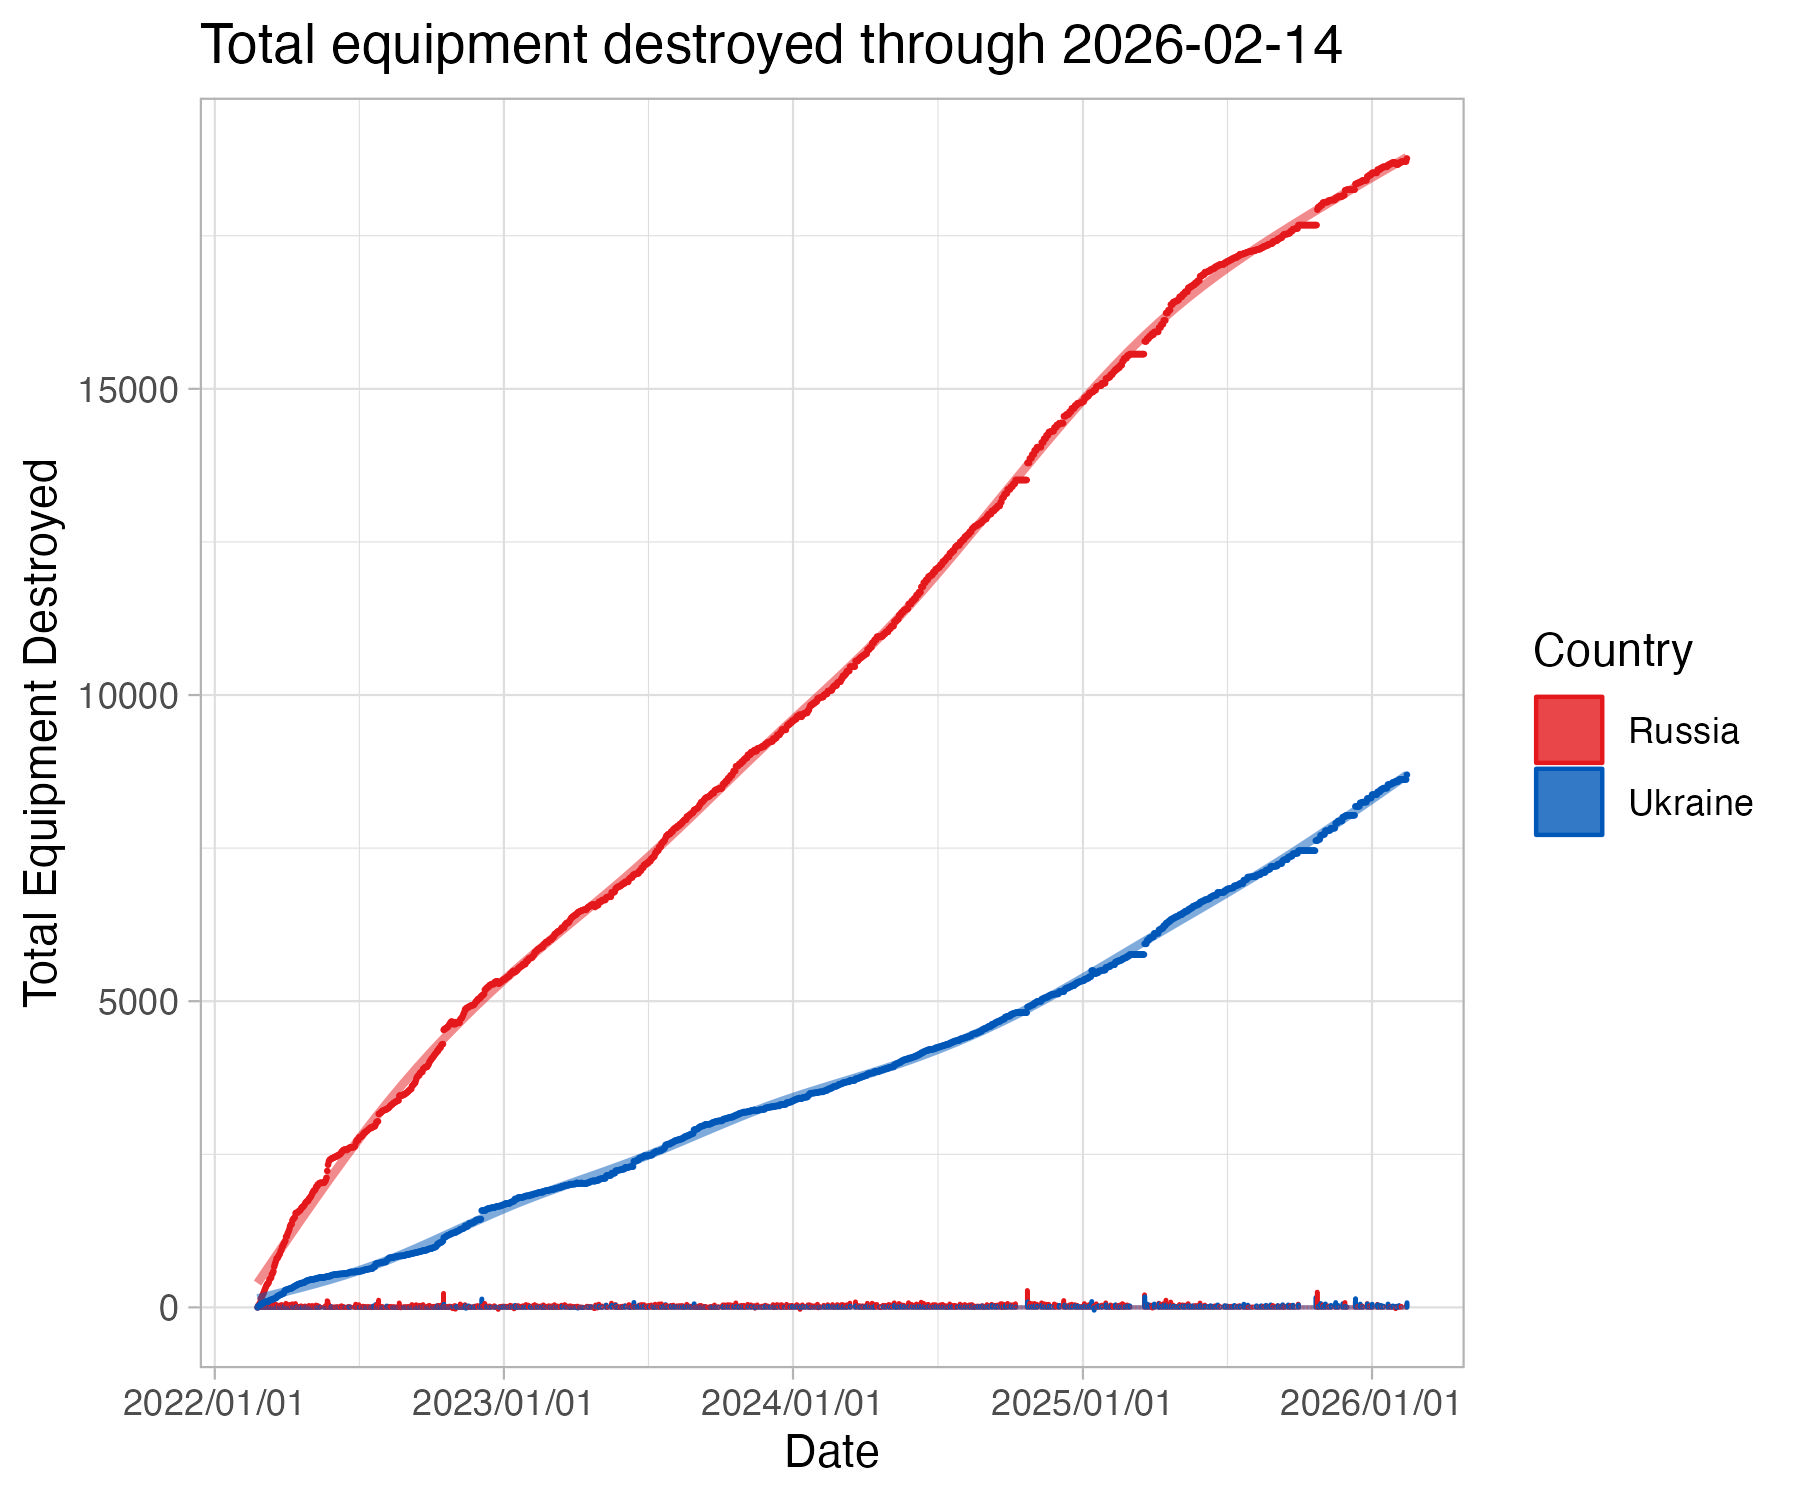 Destroyed Russian equipment outpaced destroyed Ukranian equipment by the second day of the war, though there are signs it is starting to taper.
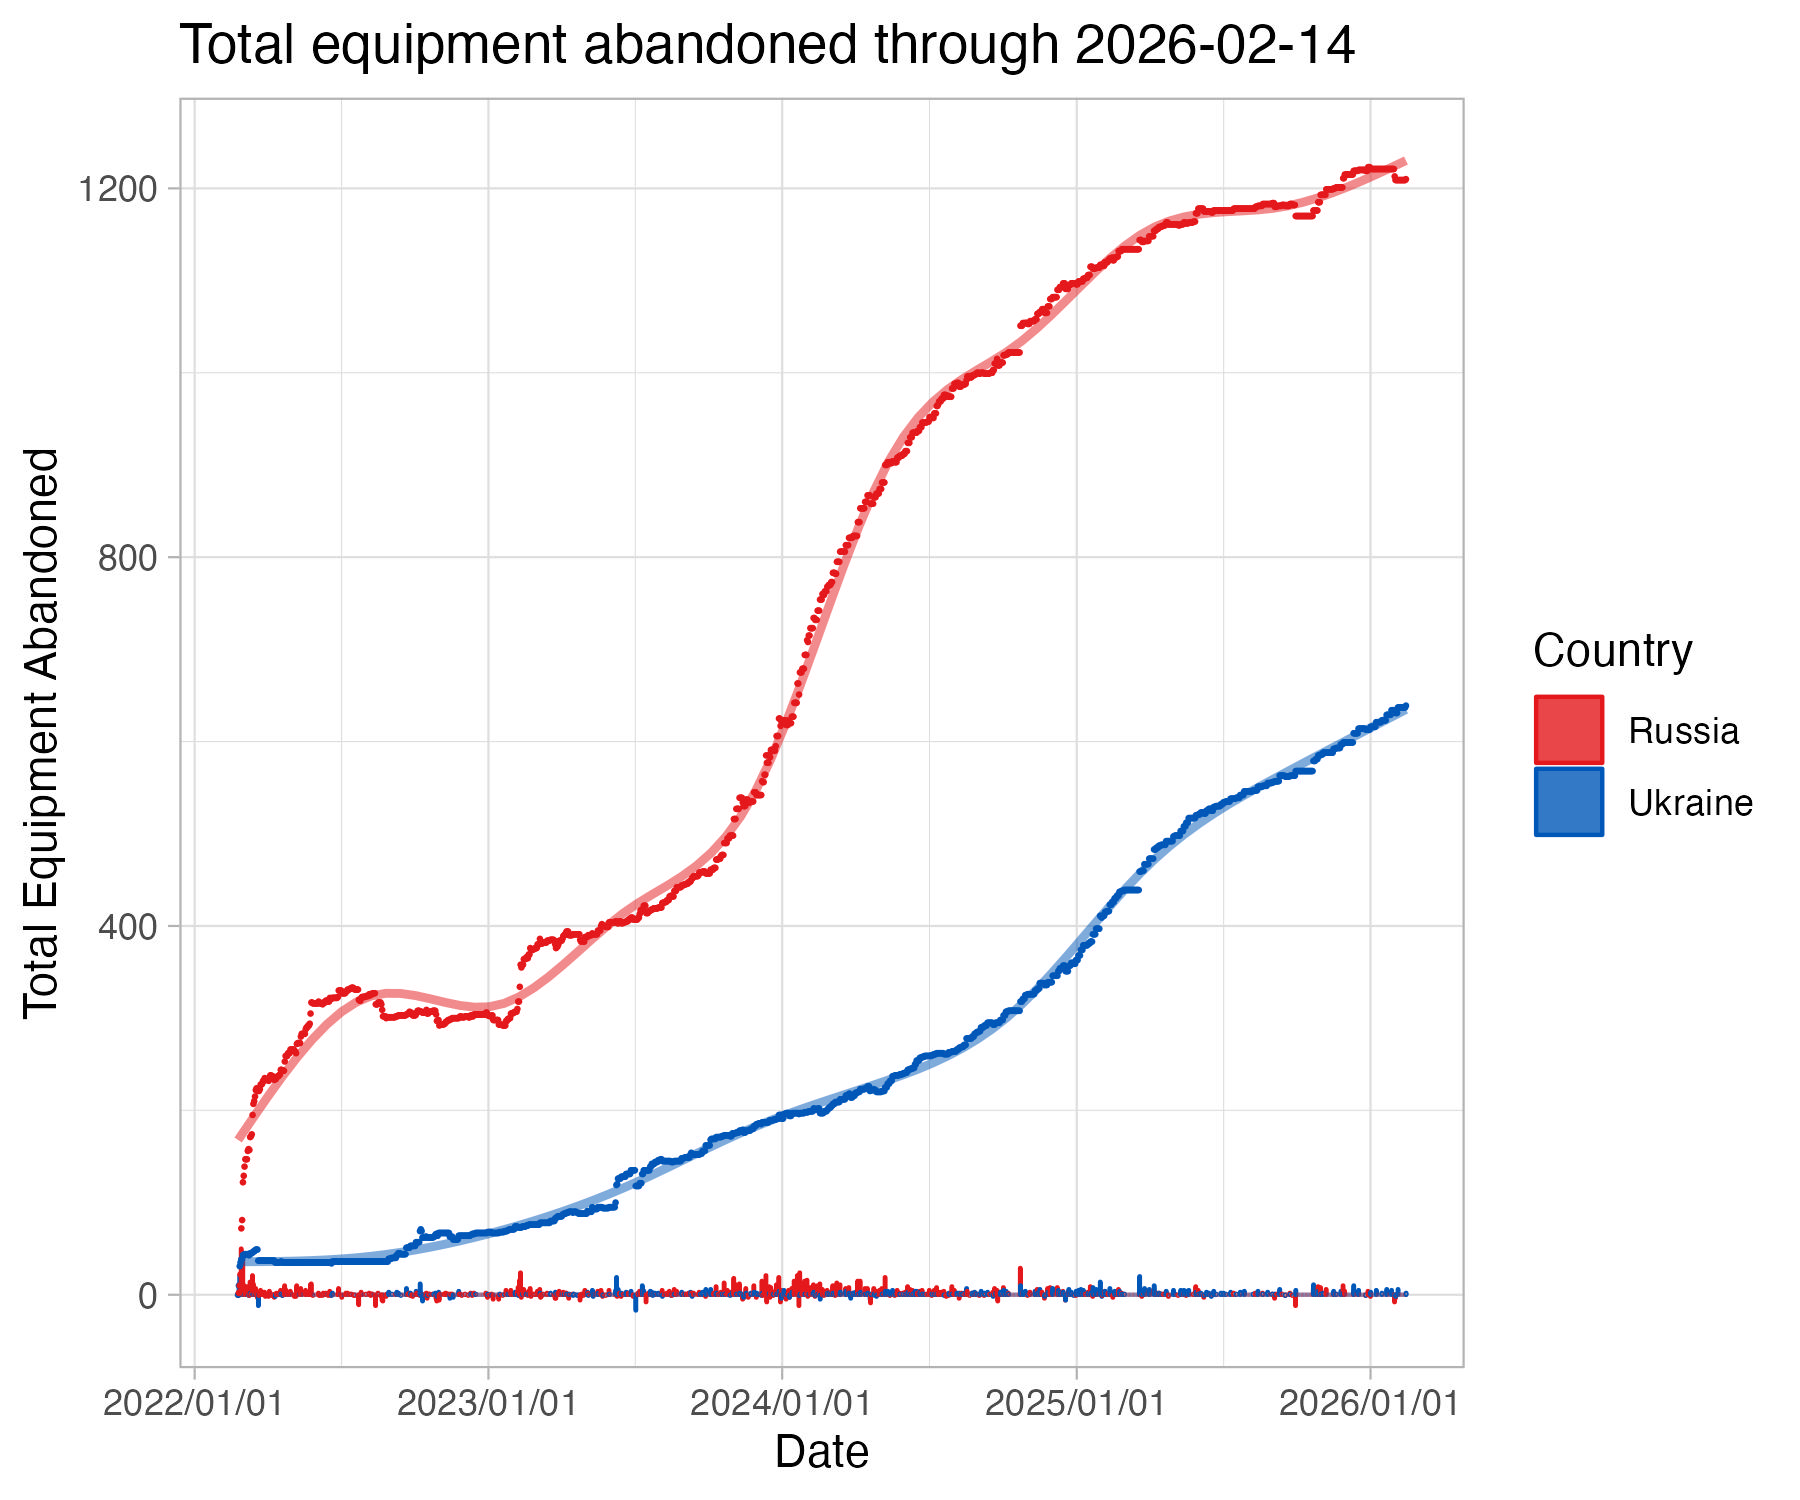 Ukranians abandoned equipment more readily in the early days fo the war, but by the third day this rate plateaued. Russian abandonments increased sharply on the third day, and began to taper at the end of the first week.
 Russians have seen a much higher rate of equipment capture since the start of the war, with a sharp increase in the second week, though this has begun to taper by the start of the third week.
The degree to which Russians have lost more equipment (in every category type) is very striking. It is certaintly possible this is a product of Ukranians focusing on documenting Russian losses, though this can't be a complete explanation.
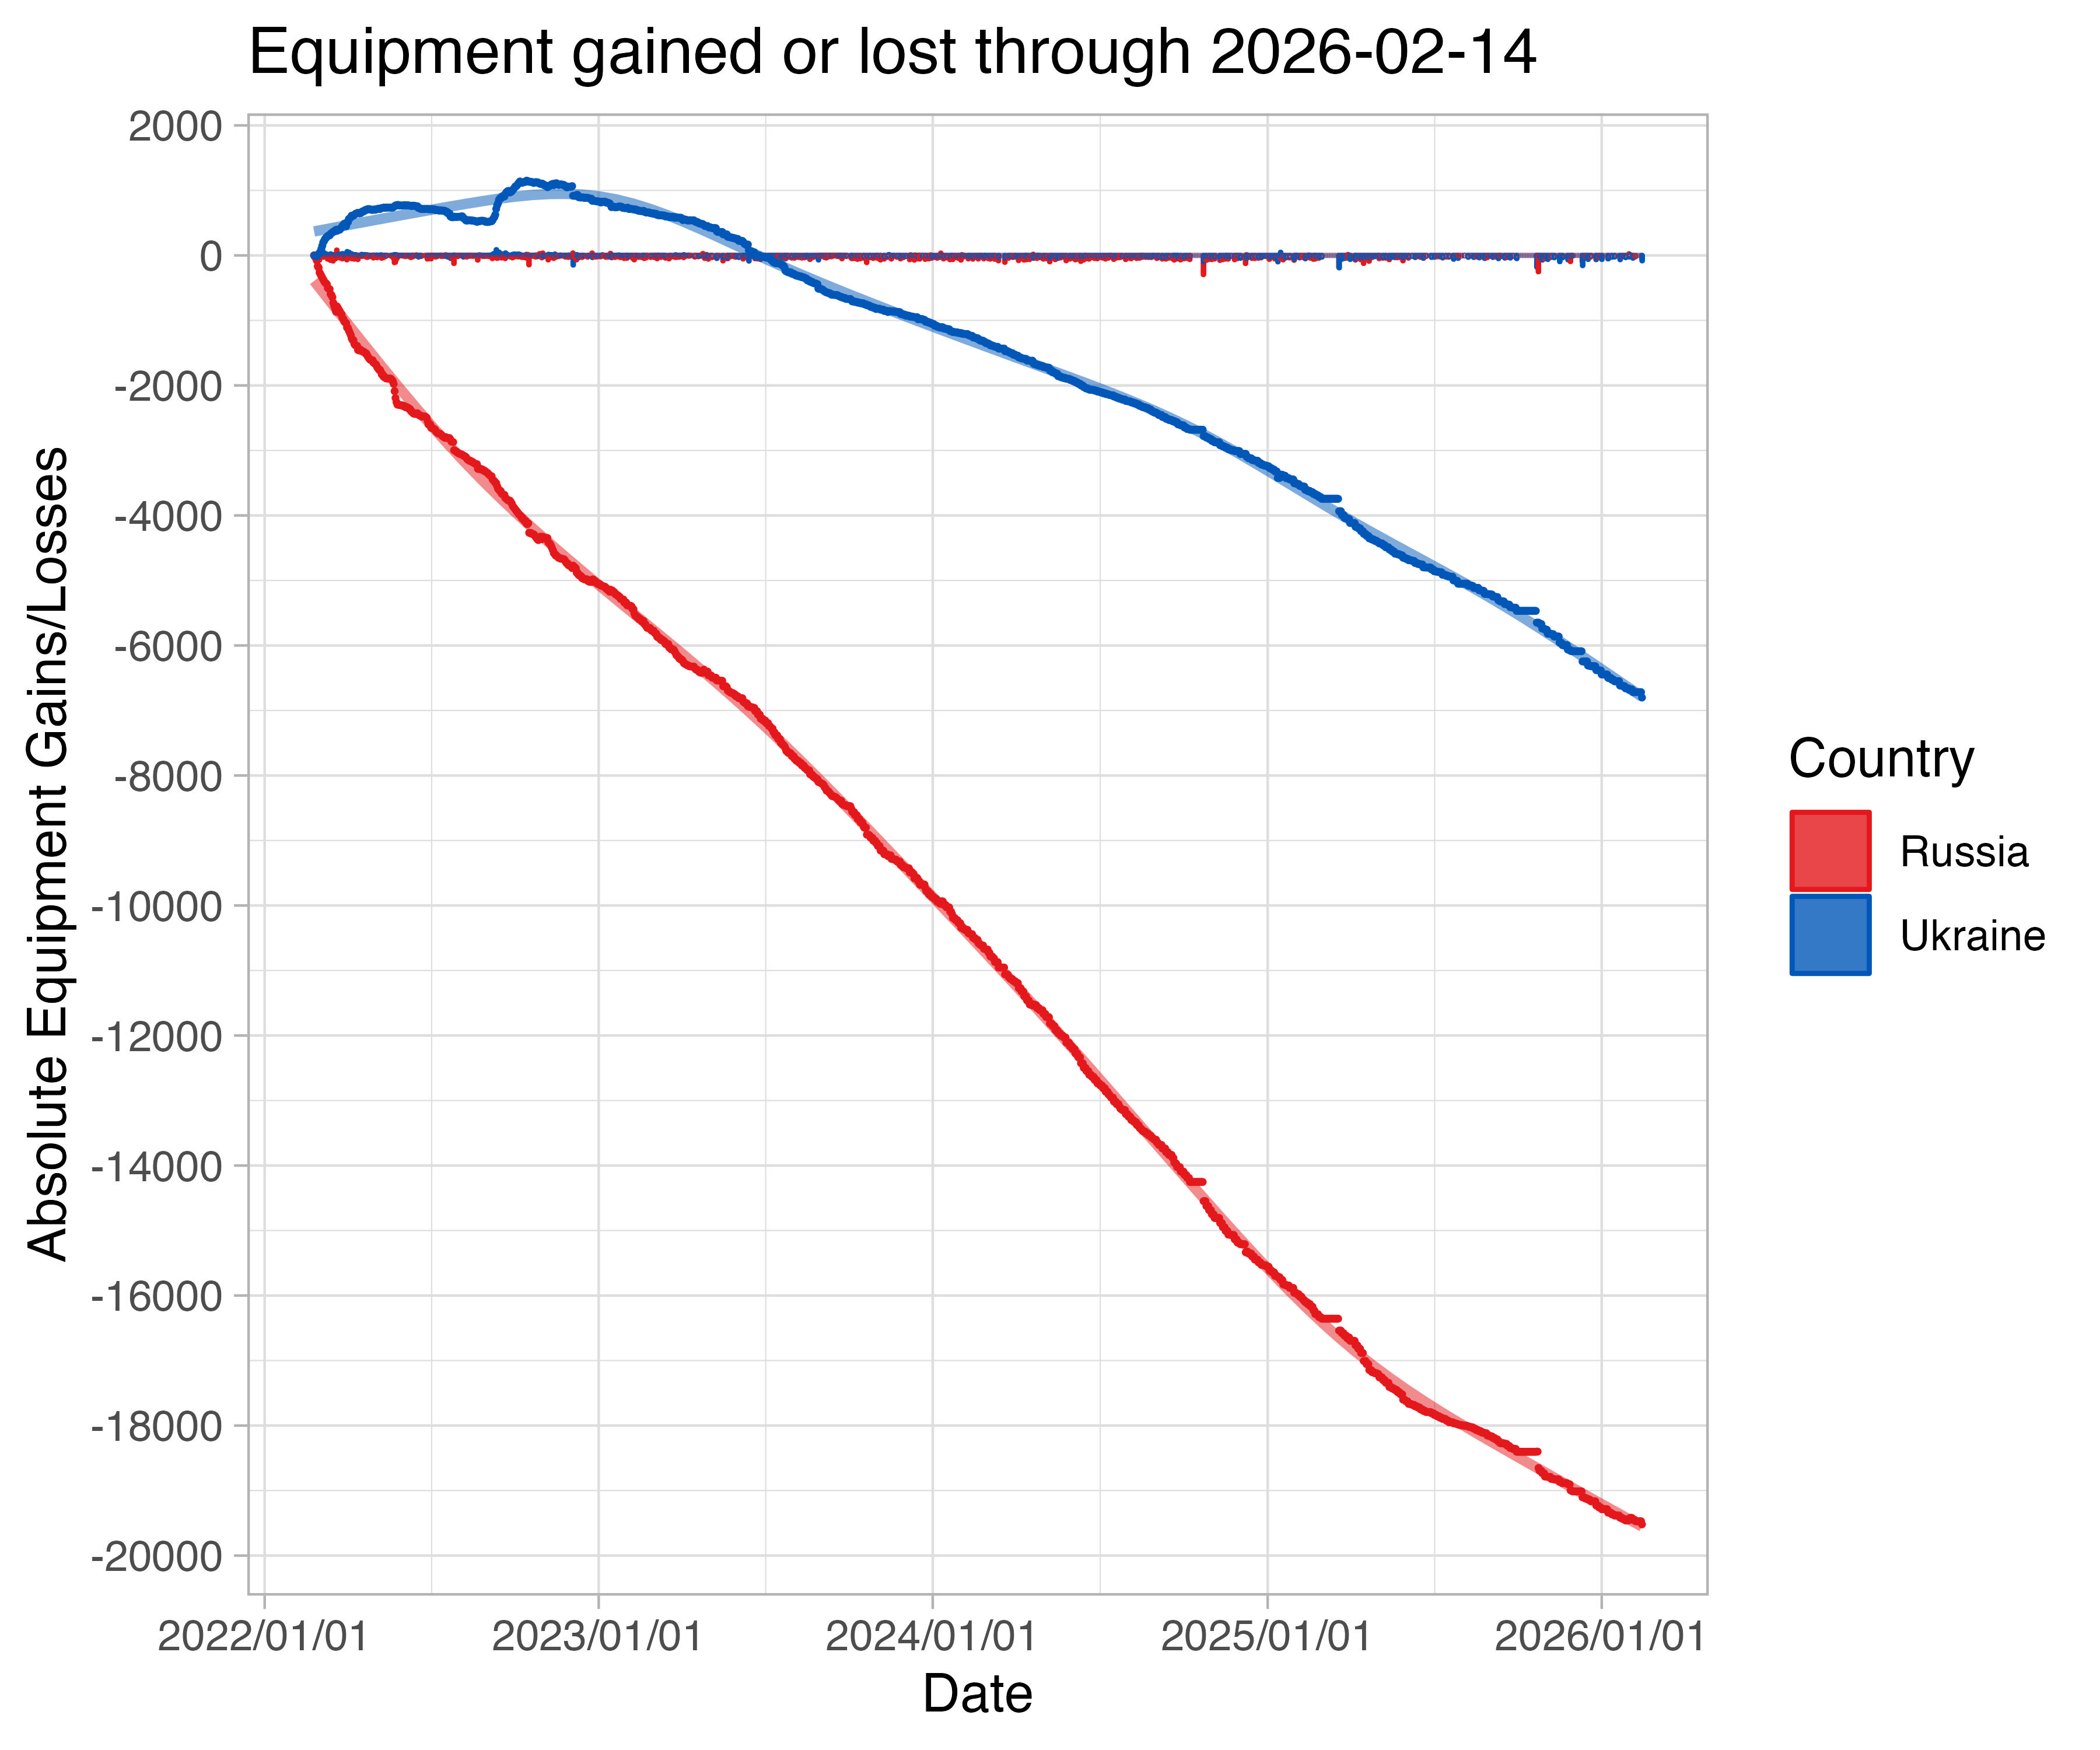 This calculation subtracts units captured by each combatant with their other loss types (destroyed, damaged, and abandoned). It is arguable if a proportion of abandonded should be included as captures. Ukraine has a net positive change in equipment - meaning they've captured more than they've lost. Russia however has lost many more units than it has aquired from Ukraine.
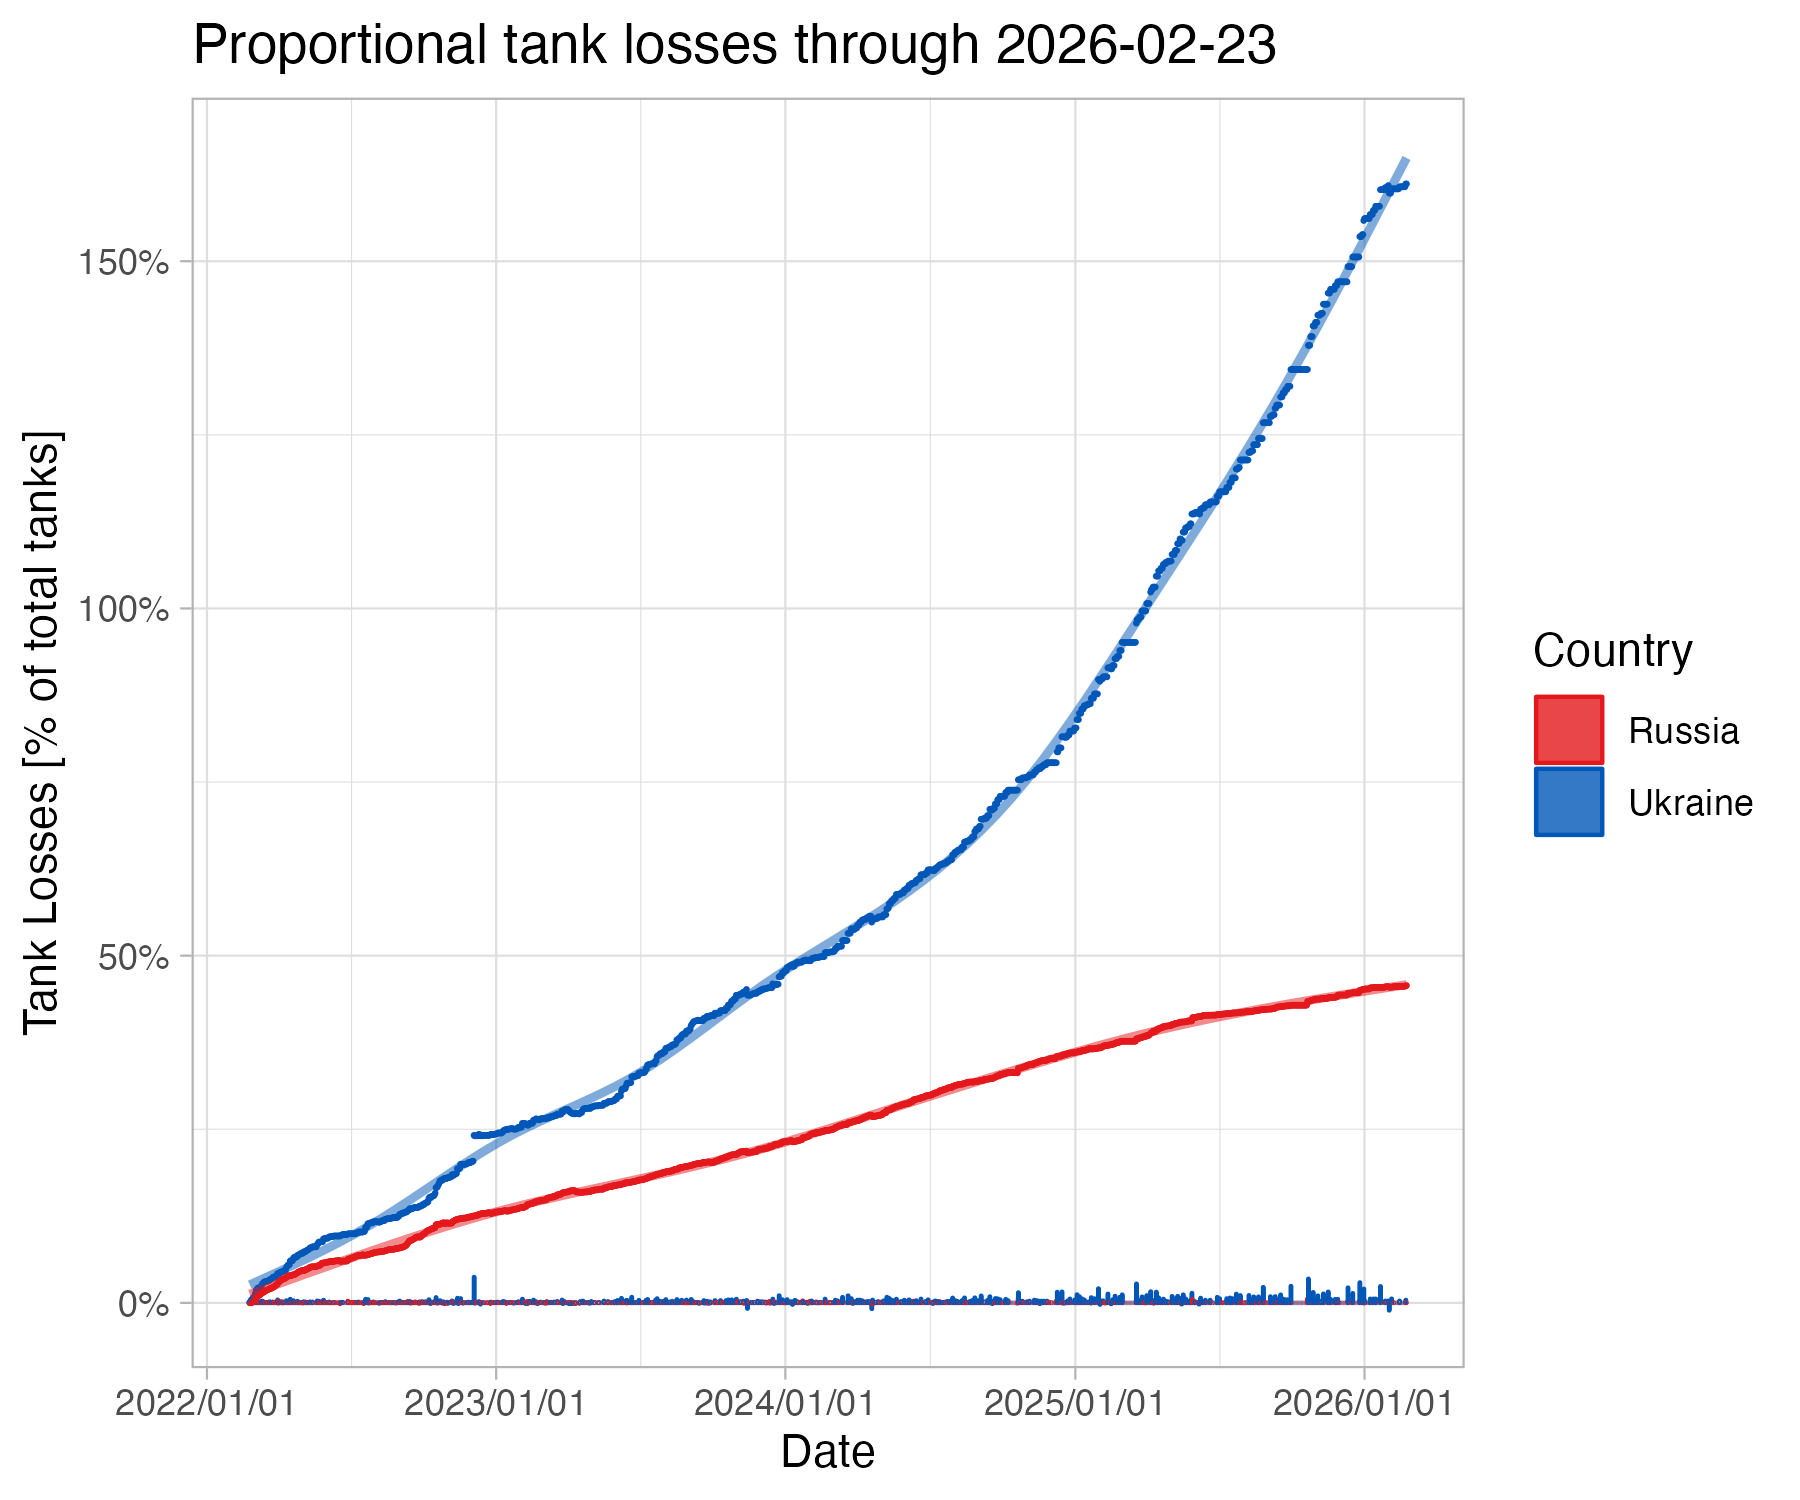
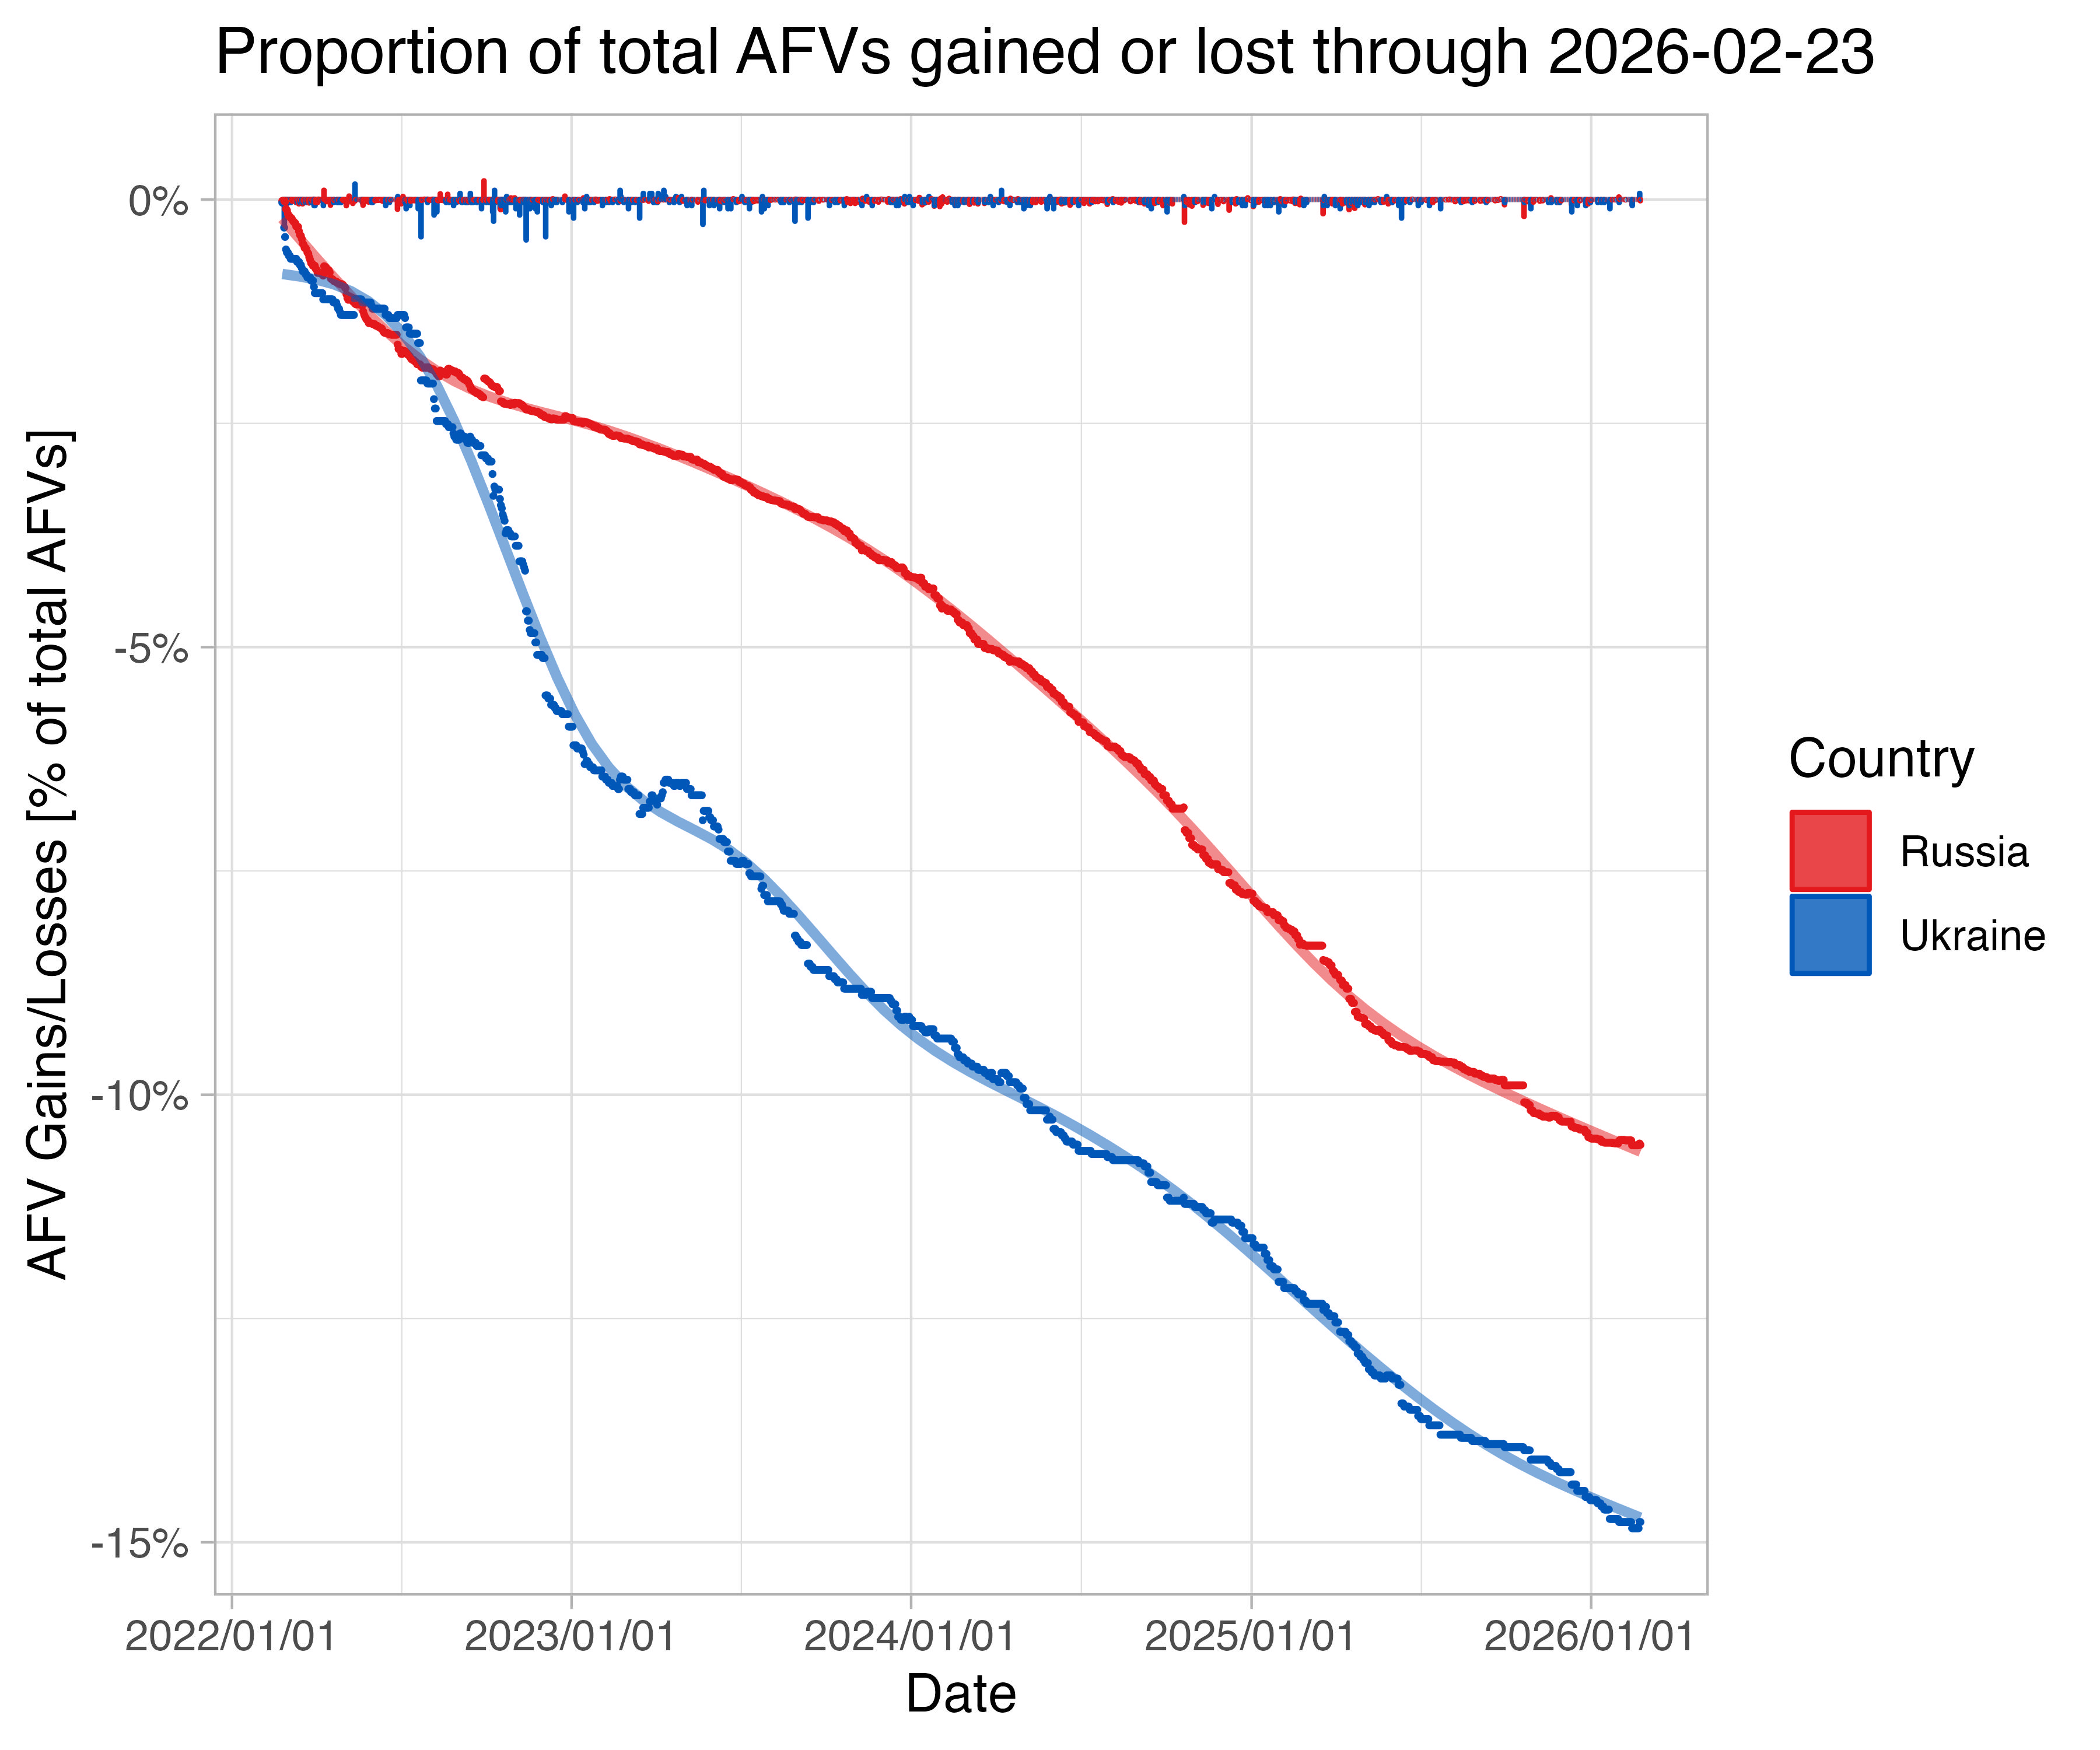
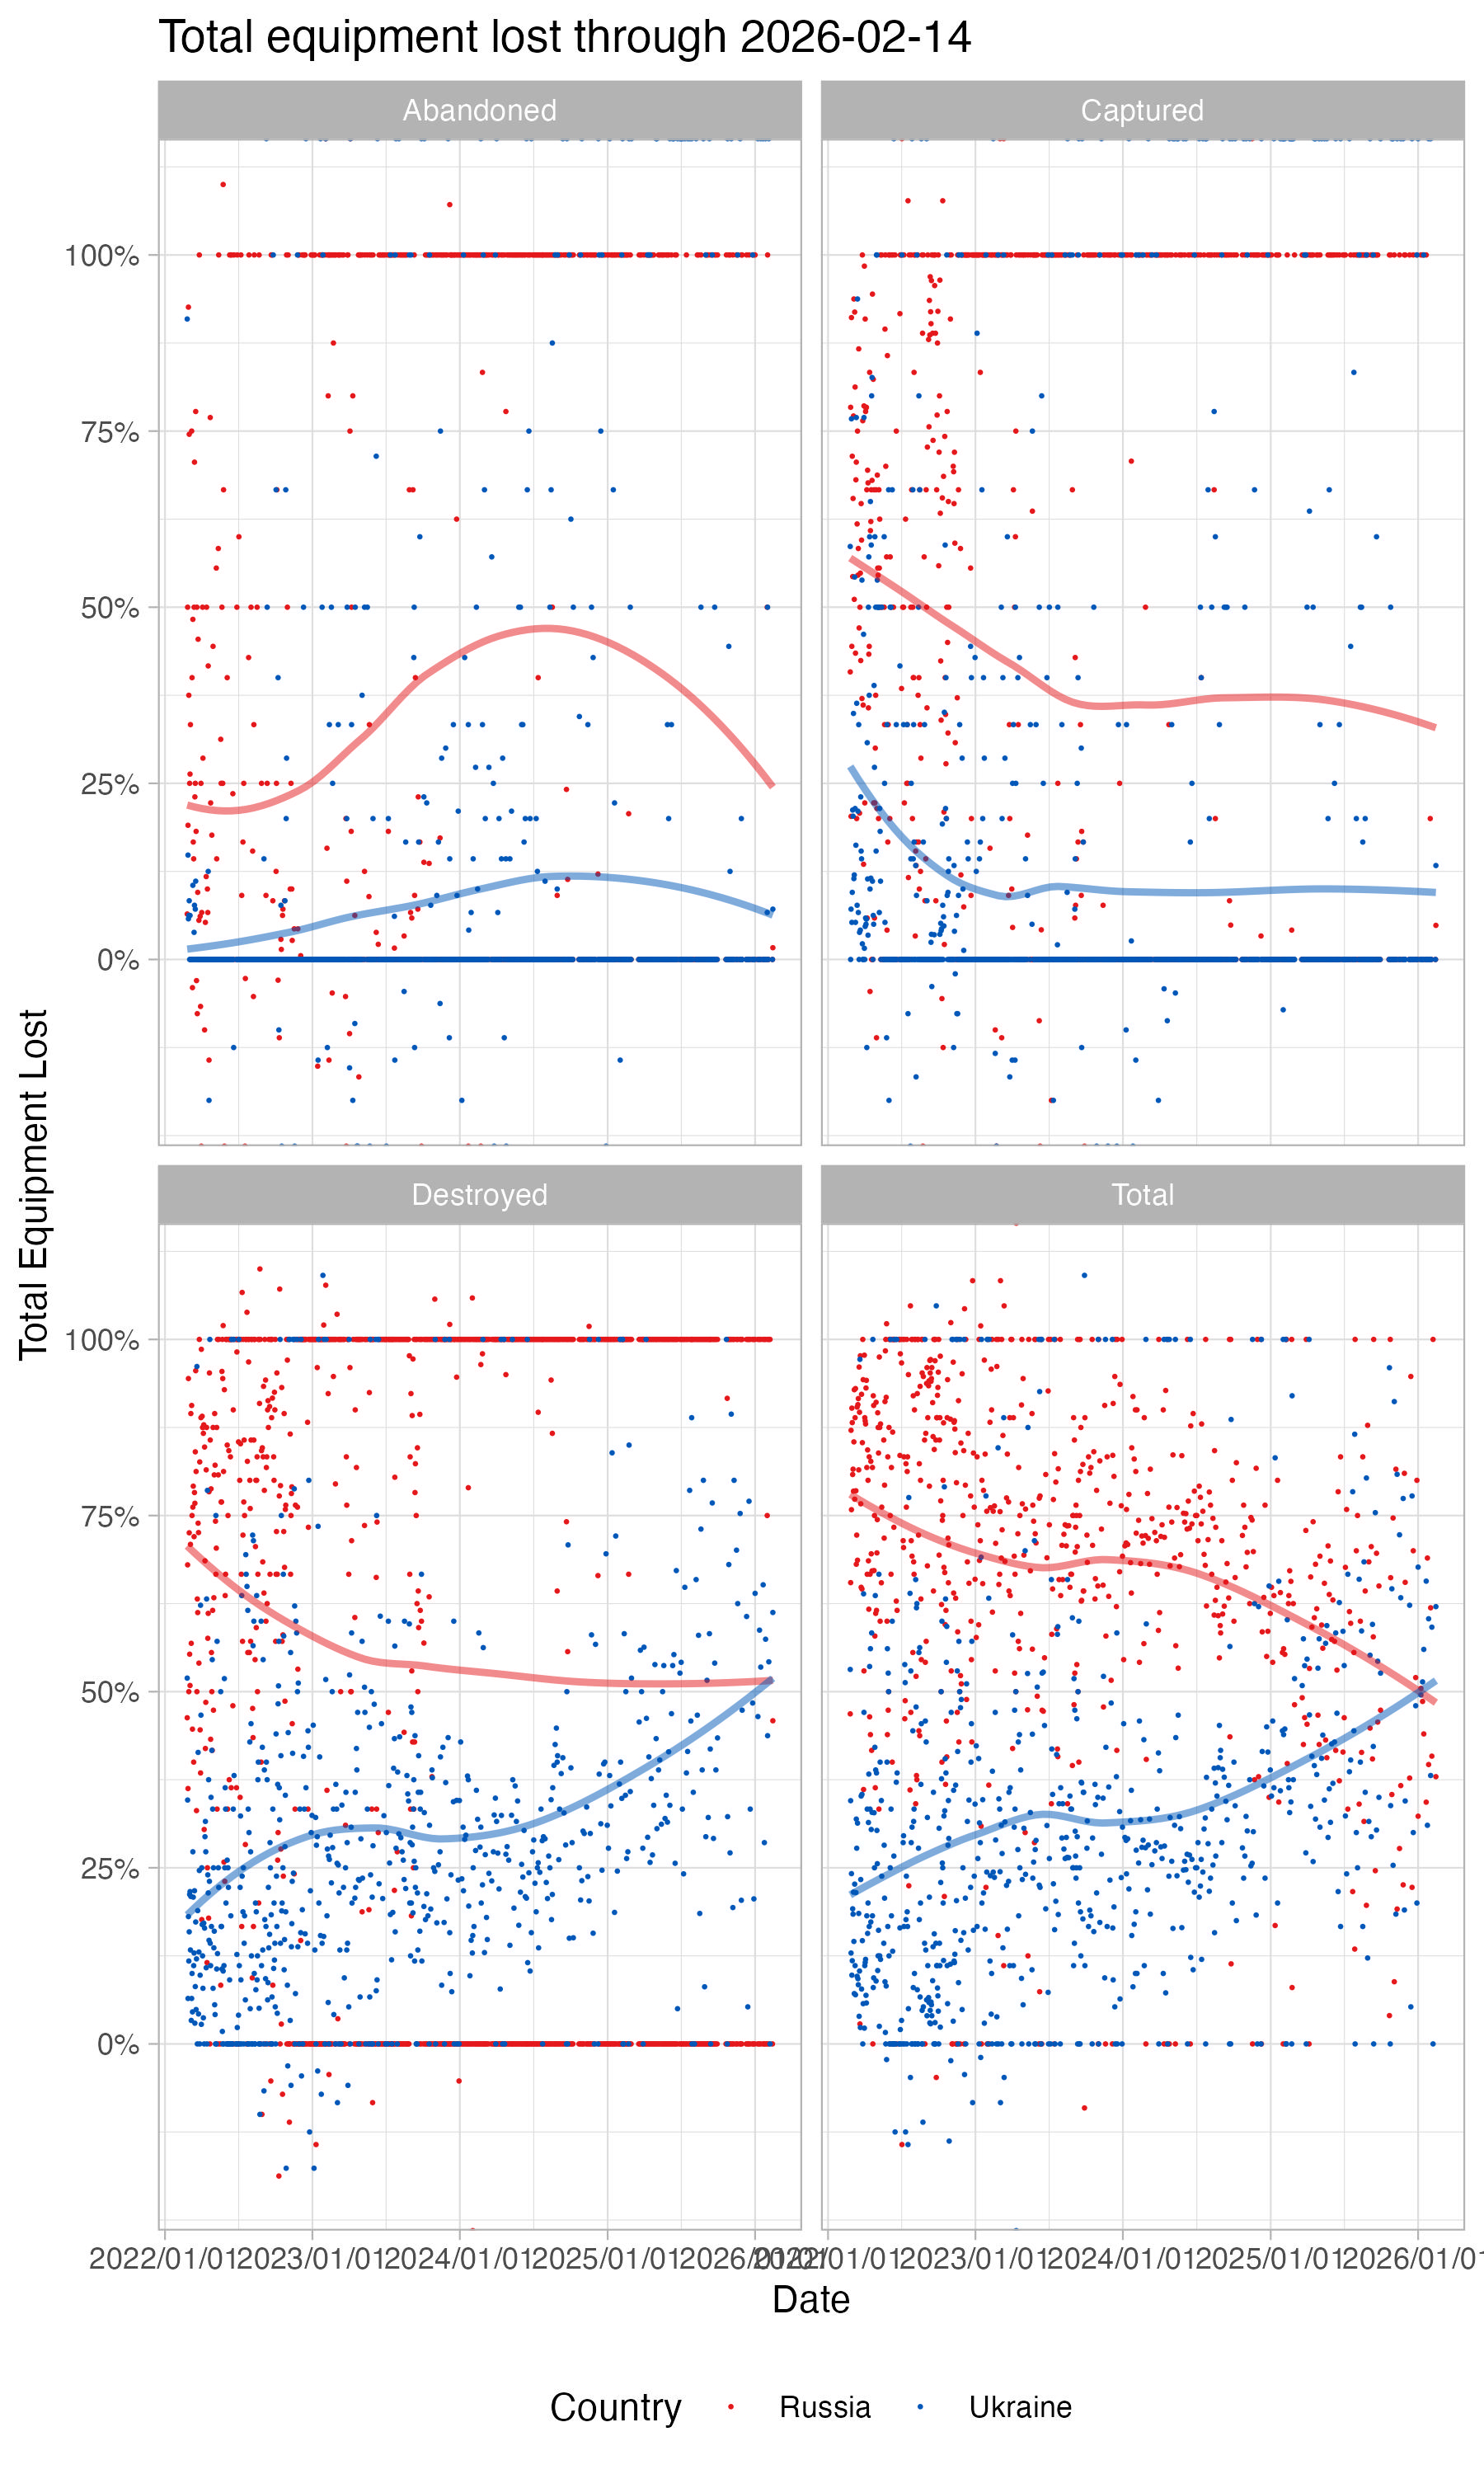 This plot shows the ratios of losses (e.g. proportion of total) for Russia and Ukraine for each loss type.
These data are gathered by the United Nations High Commissioner on Refugees (UNHCR) operational data portal (ODP) here. The line represents total refugees, while the bars below indicate daily totals.
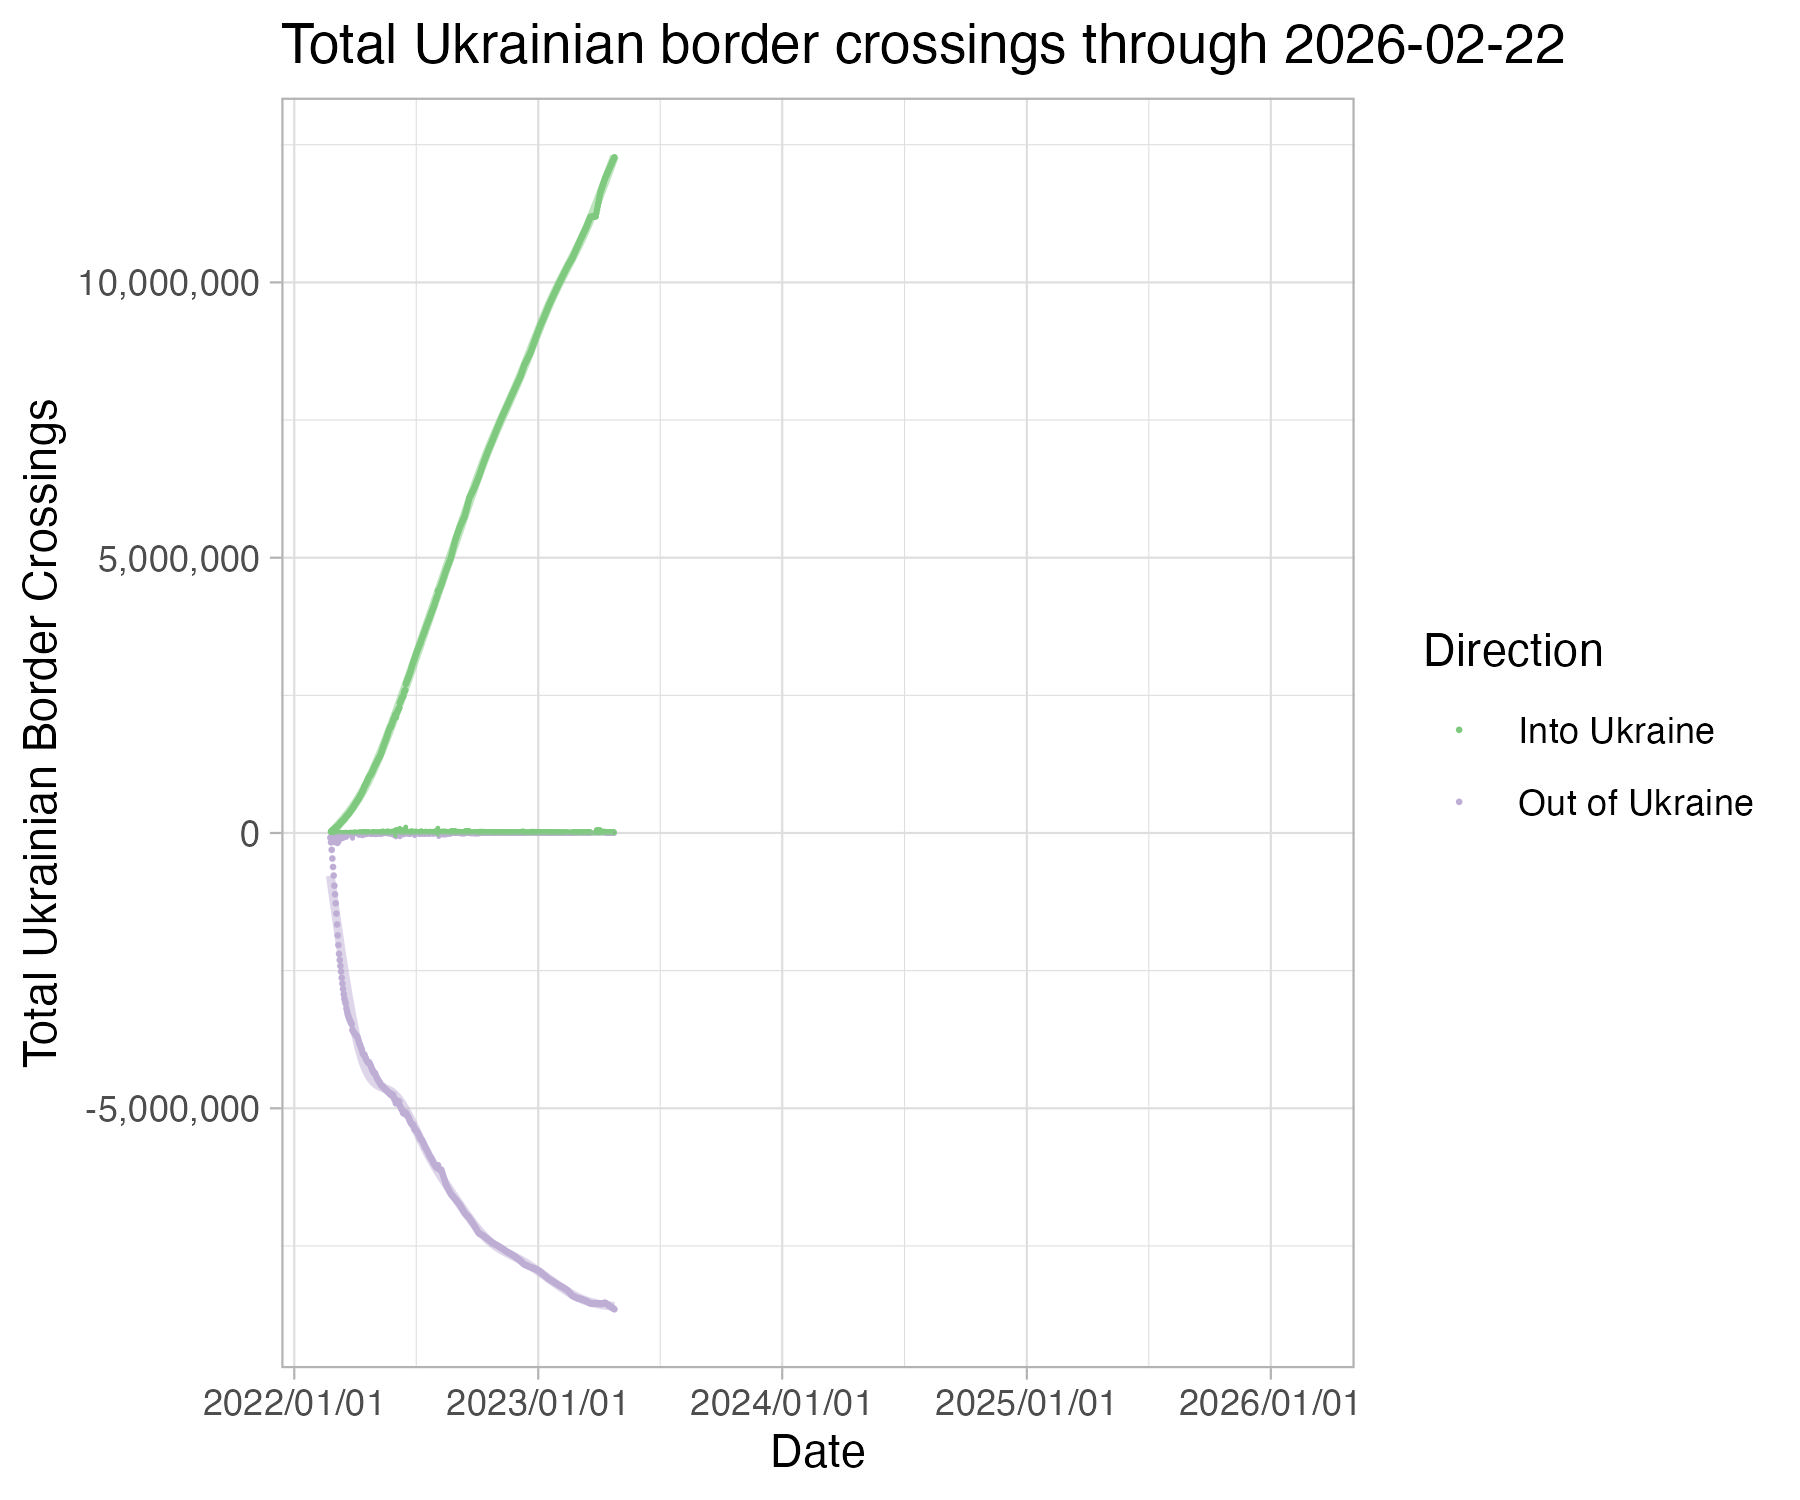
Refugee outflows peaked on the 7th of March, but migration continues to be heavy. Returning Ukrainians increased around the same time and has occured at a faster rate than more recent departures.
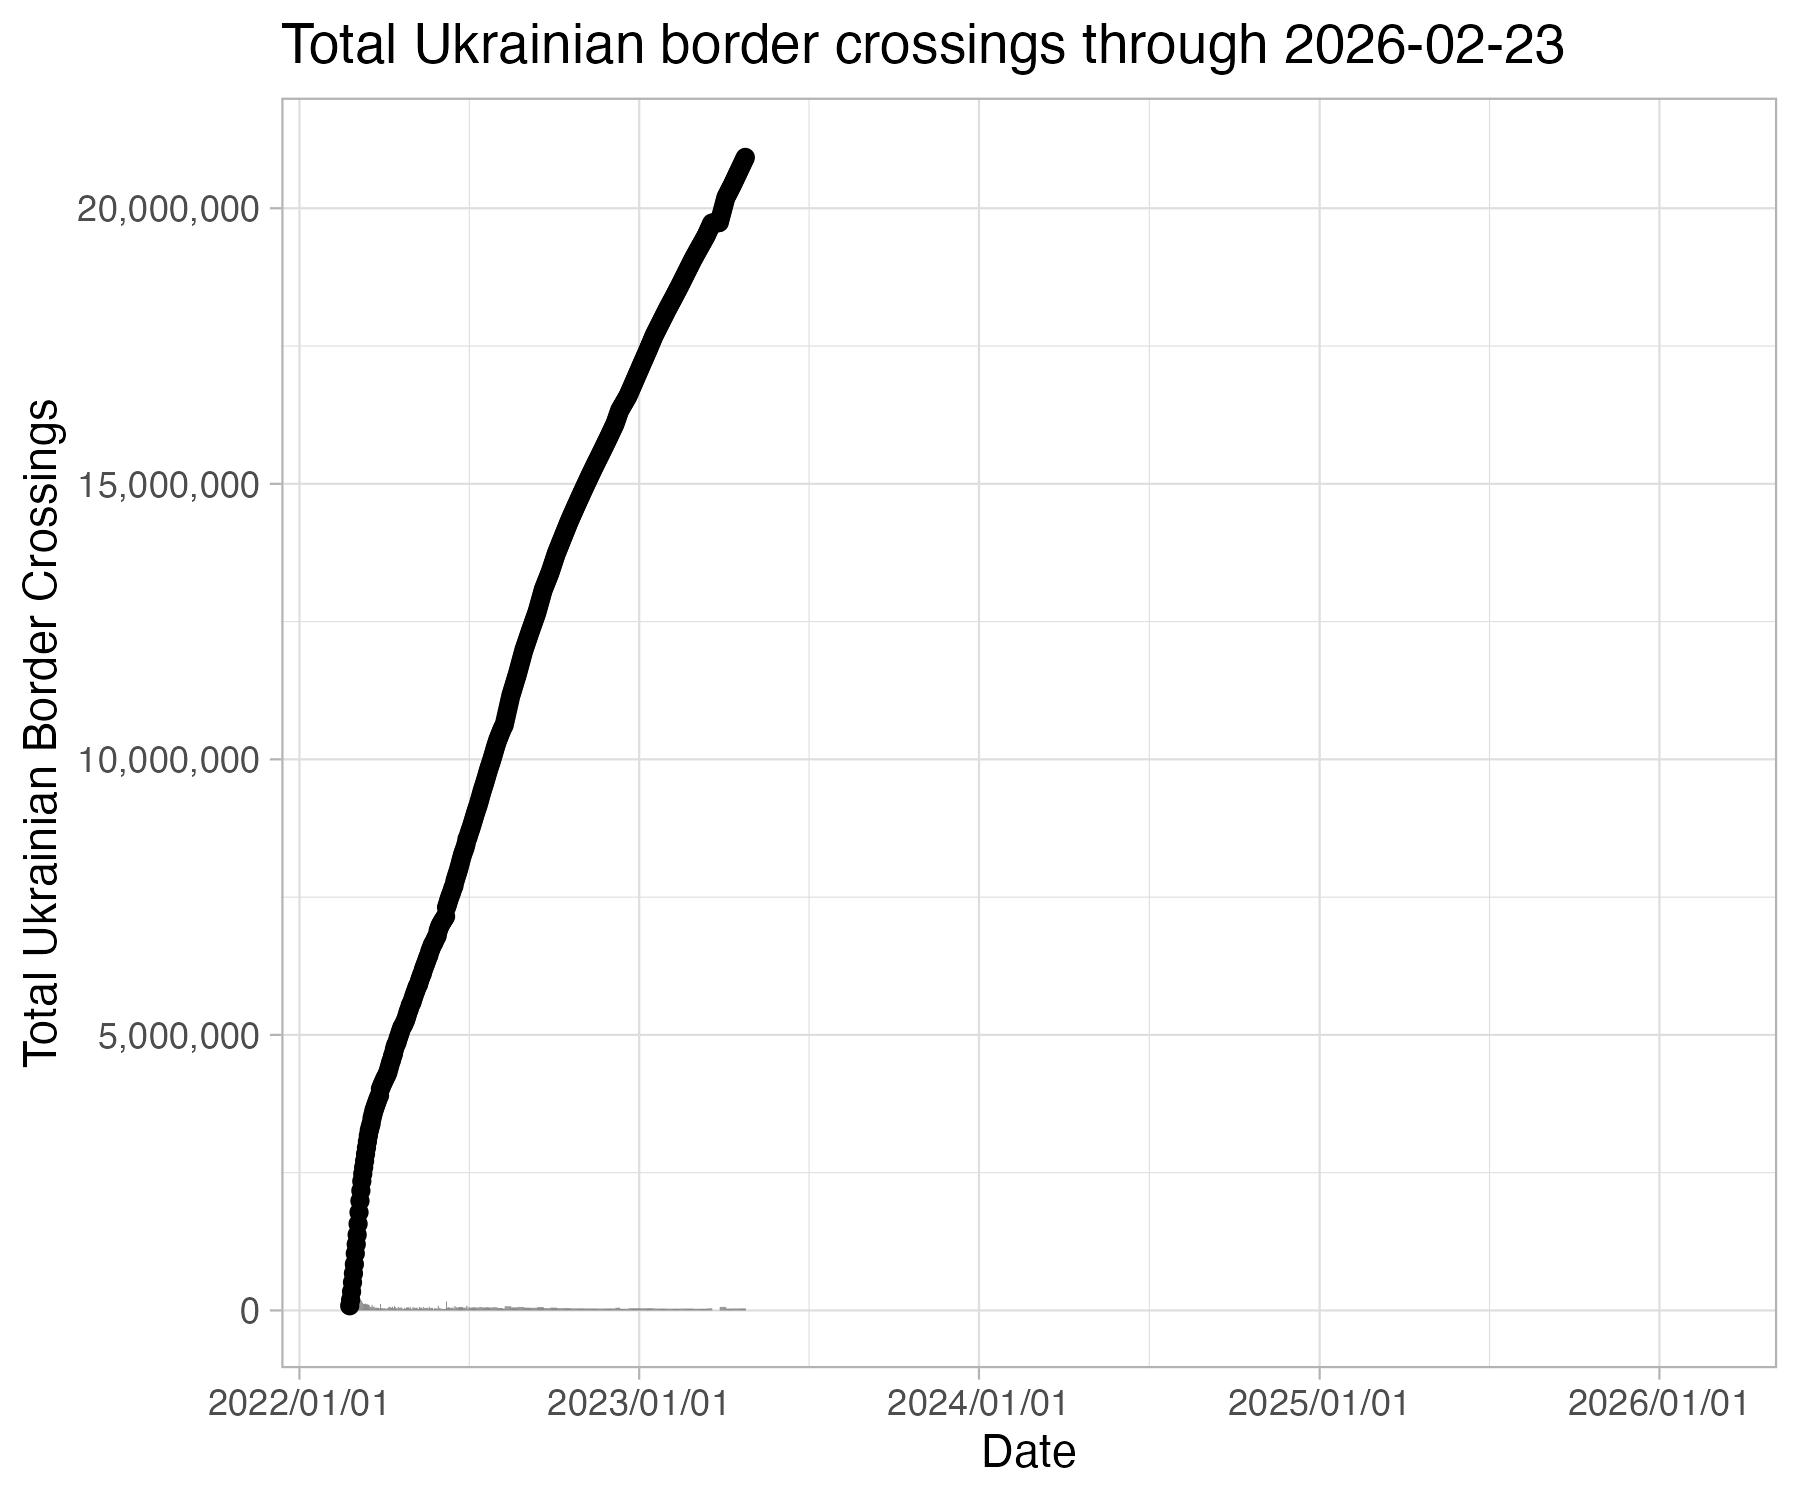
Refugees are primarily destined for Poland initially, though other nearby countries such as Moldova and Hungary are taking large numbers as well. This only counts migration out of Ukraine - internal displacement of 7.1 million people has occured since the conflict began. All together over 25% of Ukraine's population, or more than 1 out of every 4 Ukrainians, has had to move since the war began.
"Raw" refers to a specific type of vehicle, such as a tank or armored personell carrier
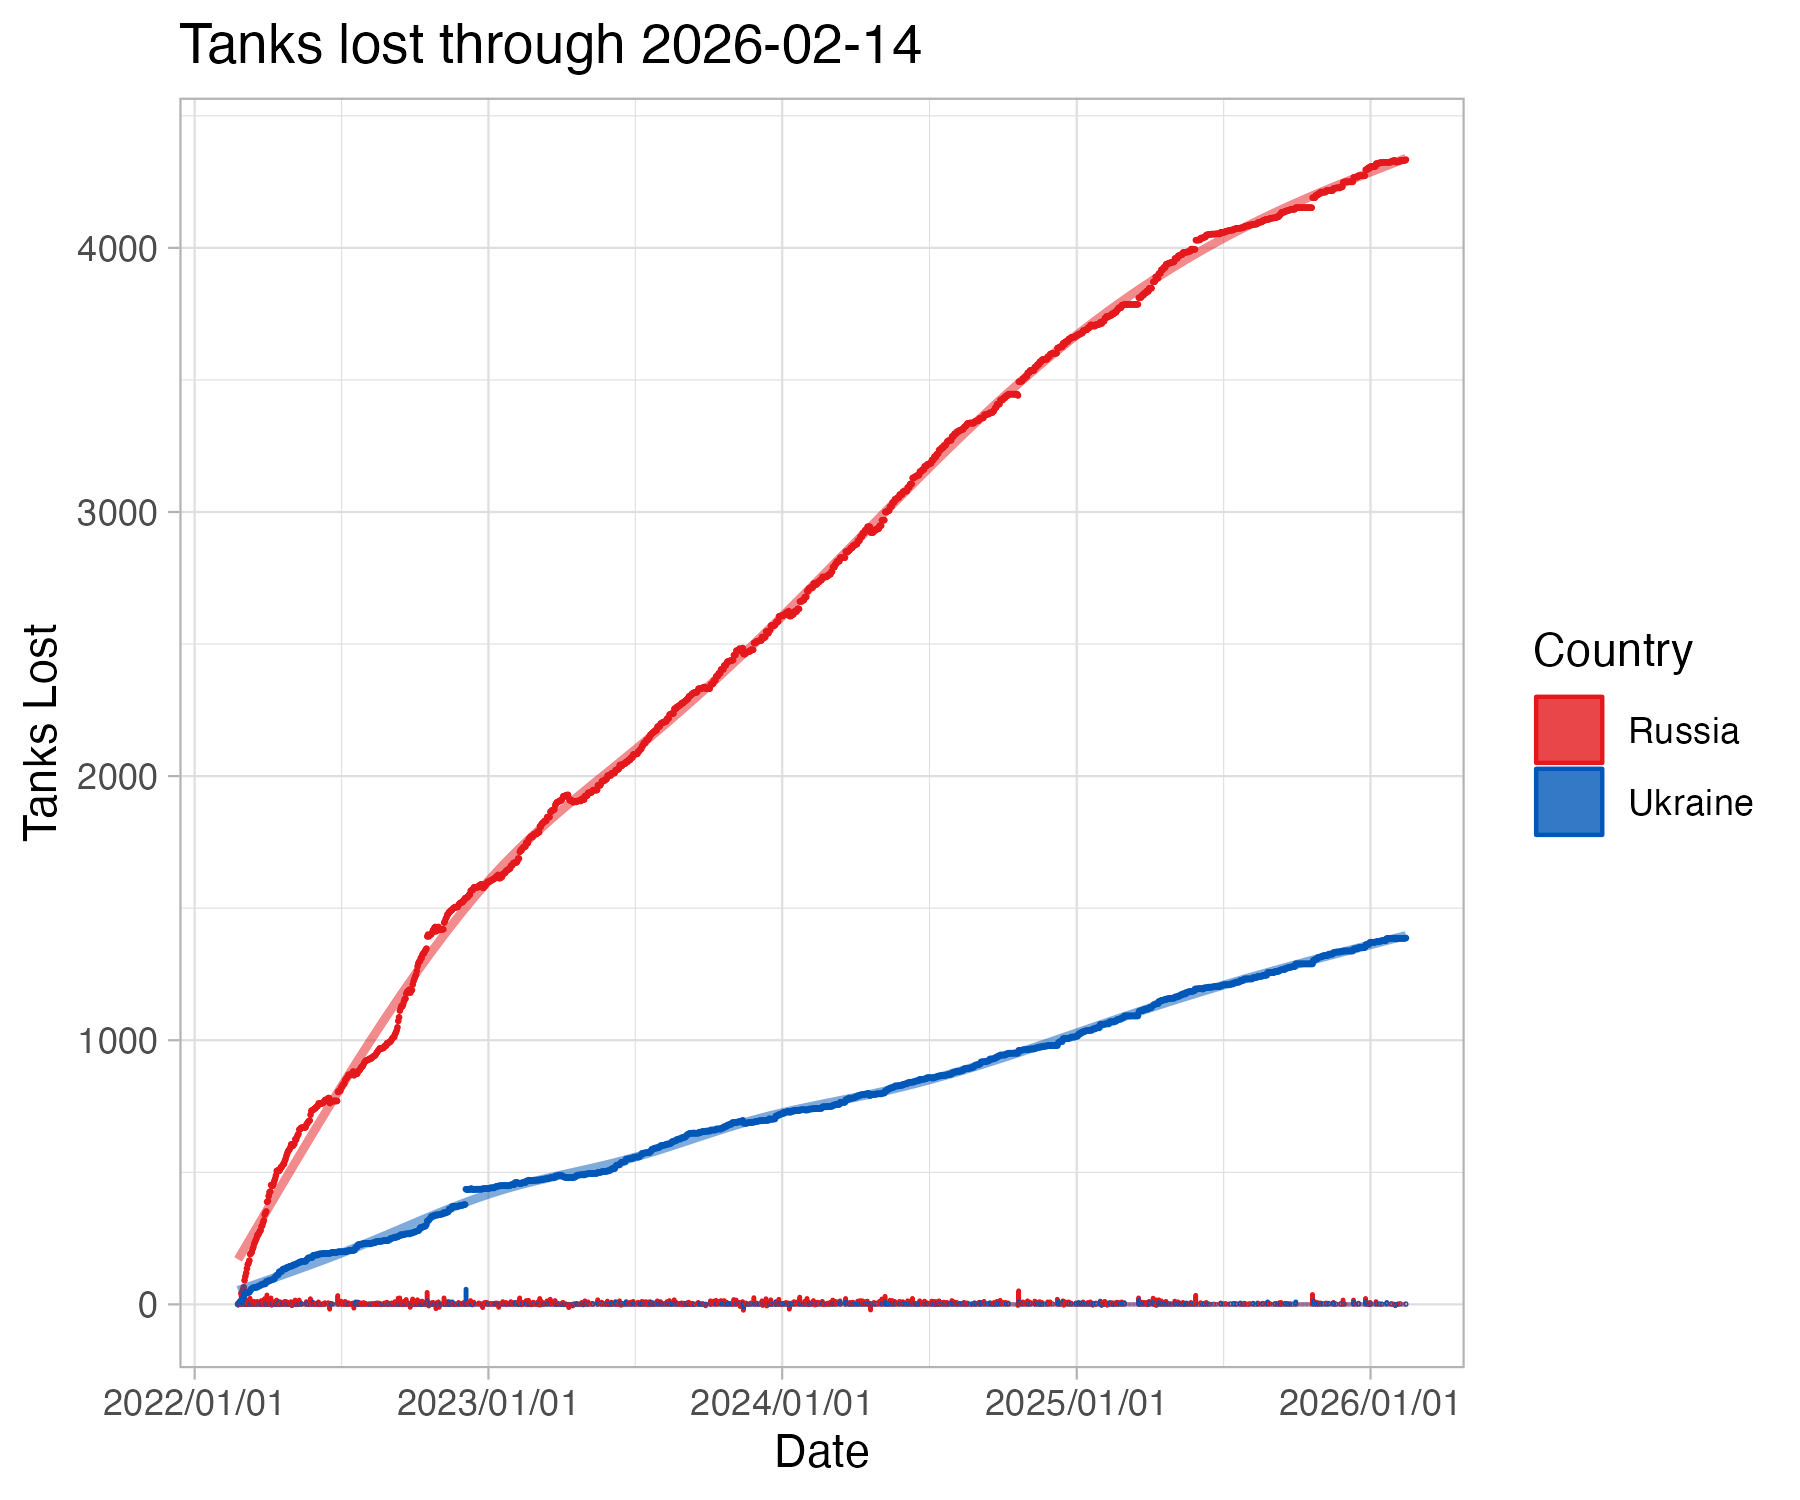 Tank losses were equivalent in the first four days of the war, with Russian tank loses increasing sharpely thereafter, though a jump in Ukranian tank losses can be seen at the start of the second week of the war.
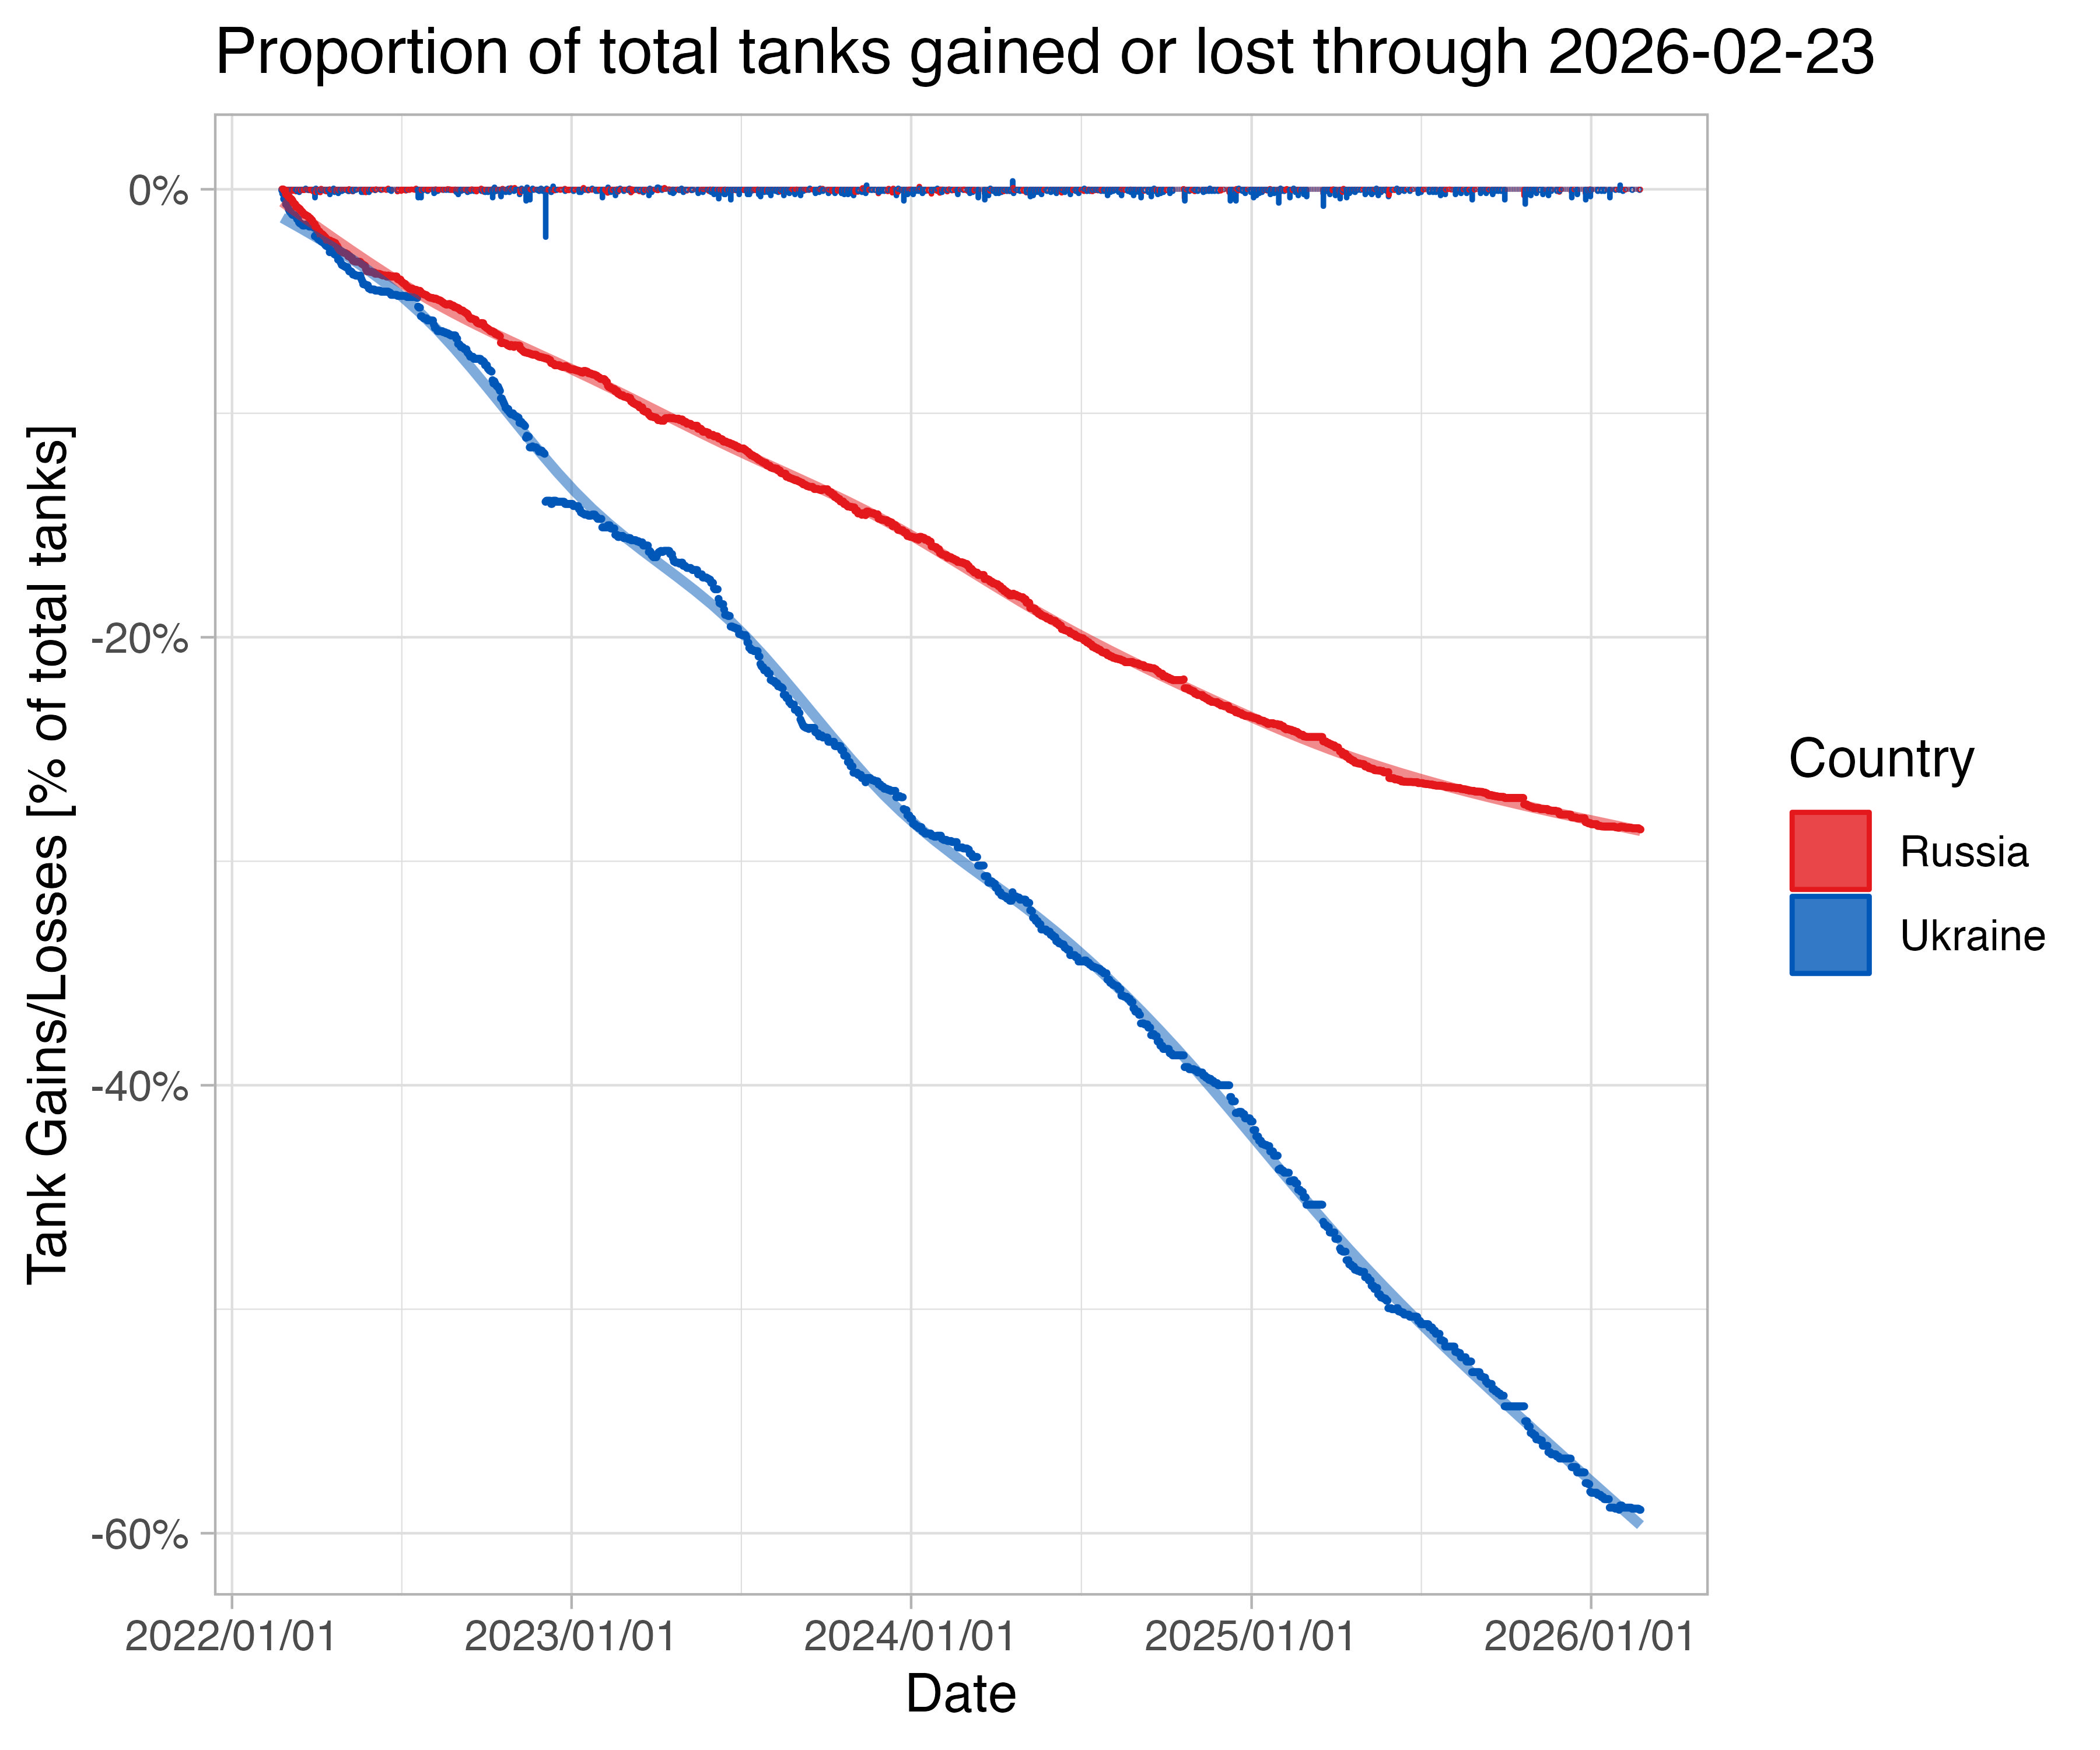
 This graph, however, highlights the challenges Ukraine still faces. When the sheer scale of Russian tanks are considered (13,300 vs. 2,100 for Ukraine), the steep Russian losses are not yet bringing parity. In general, Ukraine loses 1 tank for every 3 it takes from Russia. This ratio has to get to 4 or higher to be sustainble. Note that this estimate factors in verified tank captures by both Russia and Ukraine.
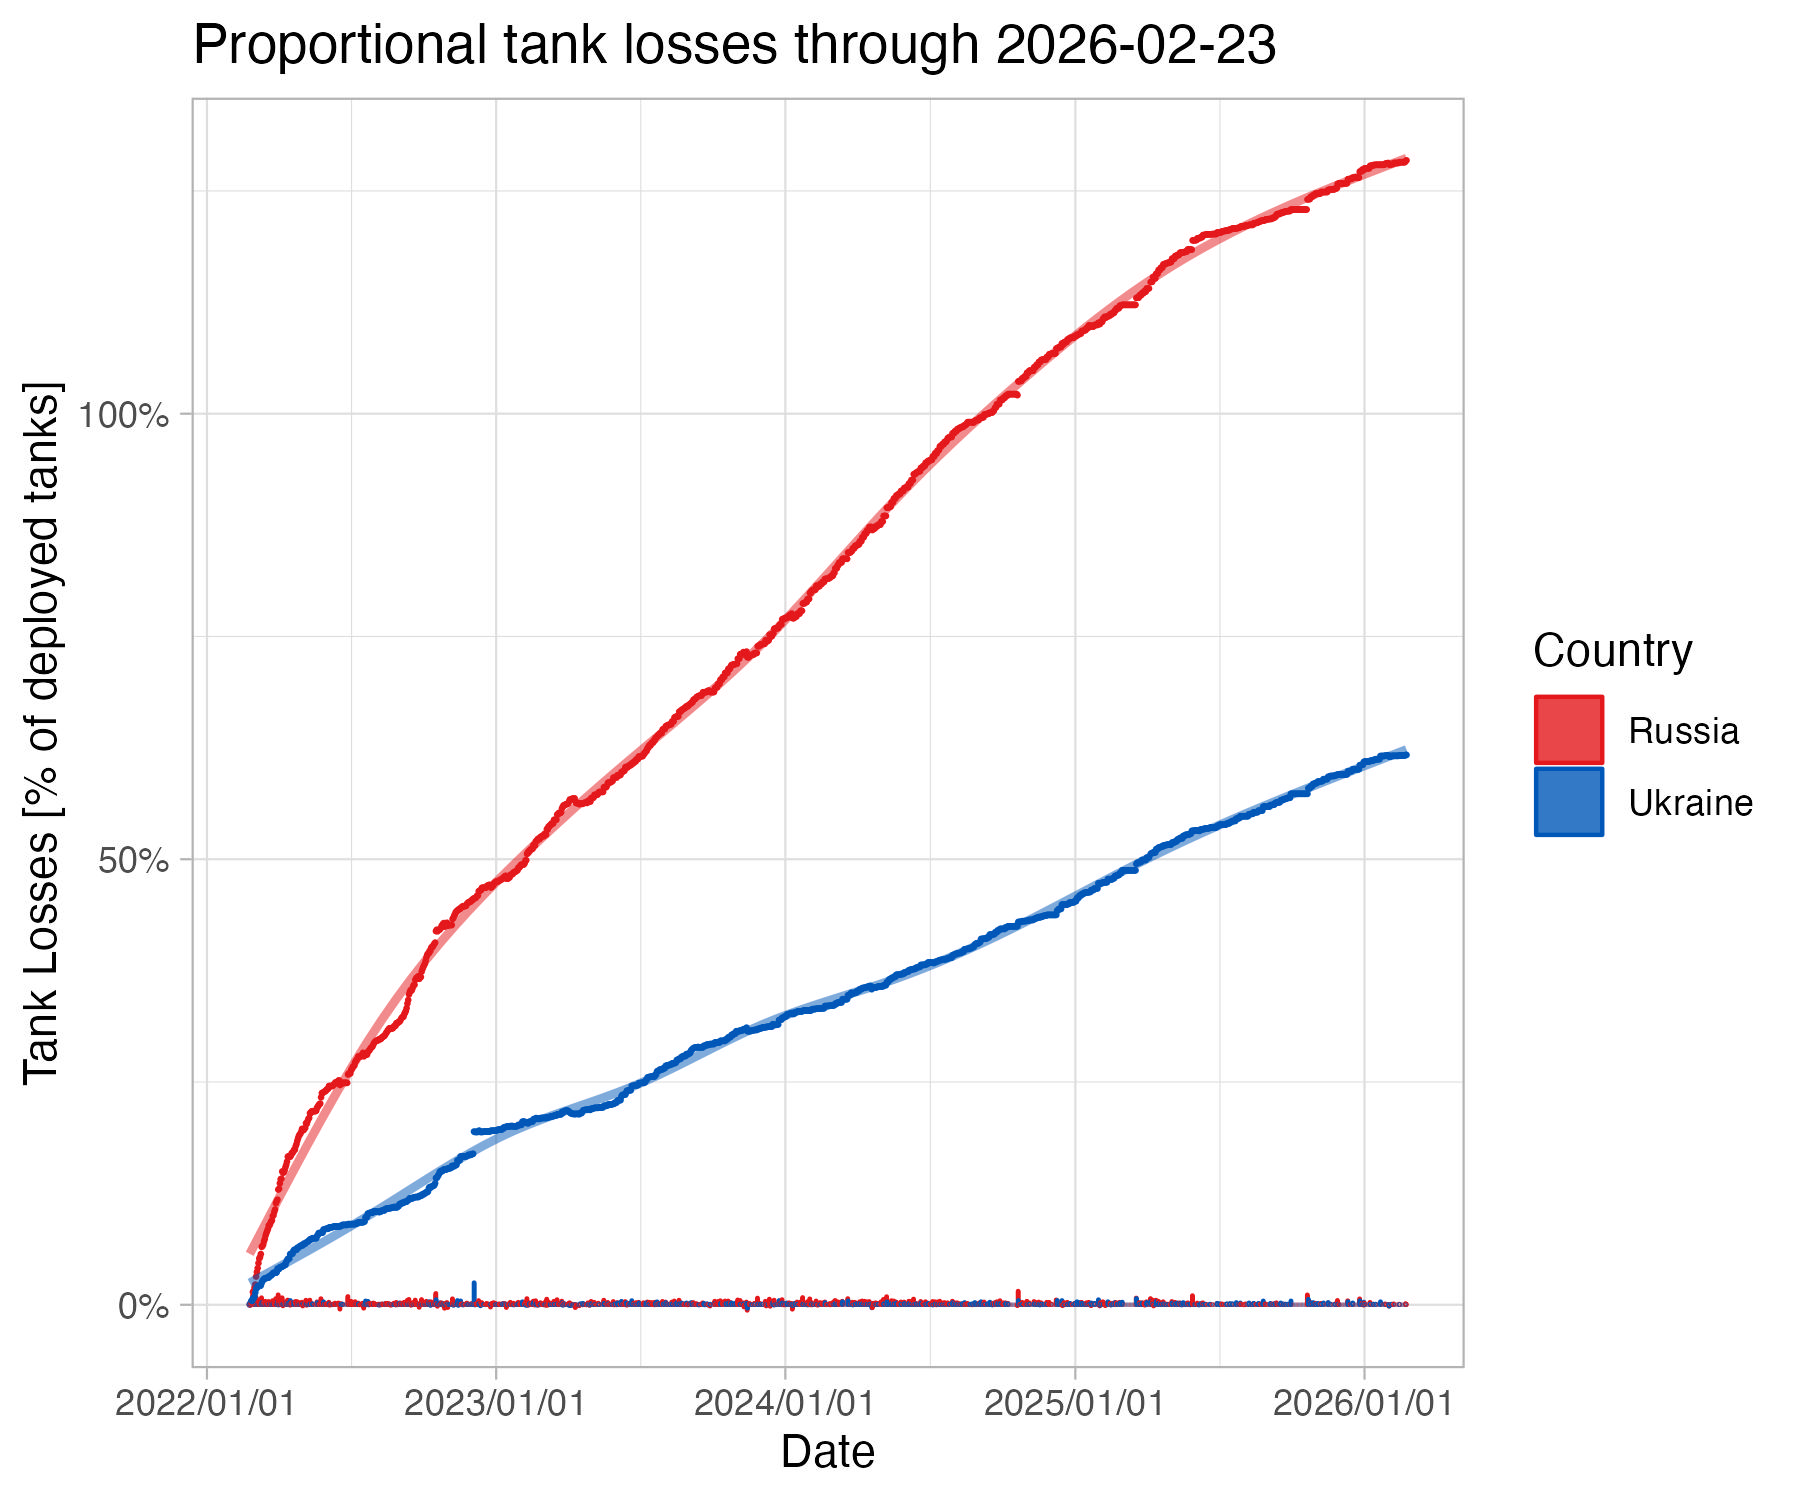 If we consider estimates of deployed Russian tanks instead of their total (2,840 vs. 2,100 for Ukraine), the picture is not as dire for Ukraine. This estimate likely is closer to the battlefont picture, as not all Russian tanks could be deployed at once, though Russia can sustain attrition longer than Ukraine. Note that this estimate factors in verified tank captures by both Russia and Ukraine.
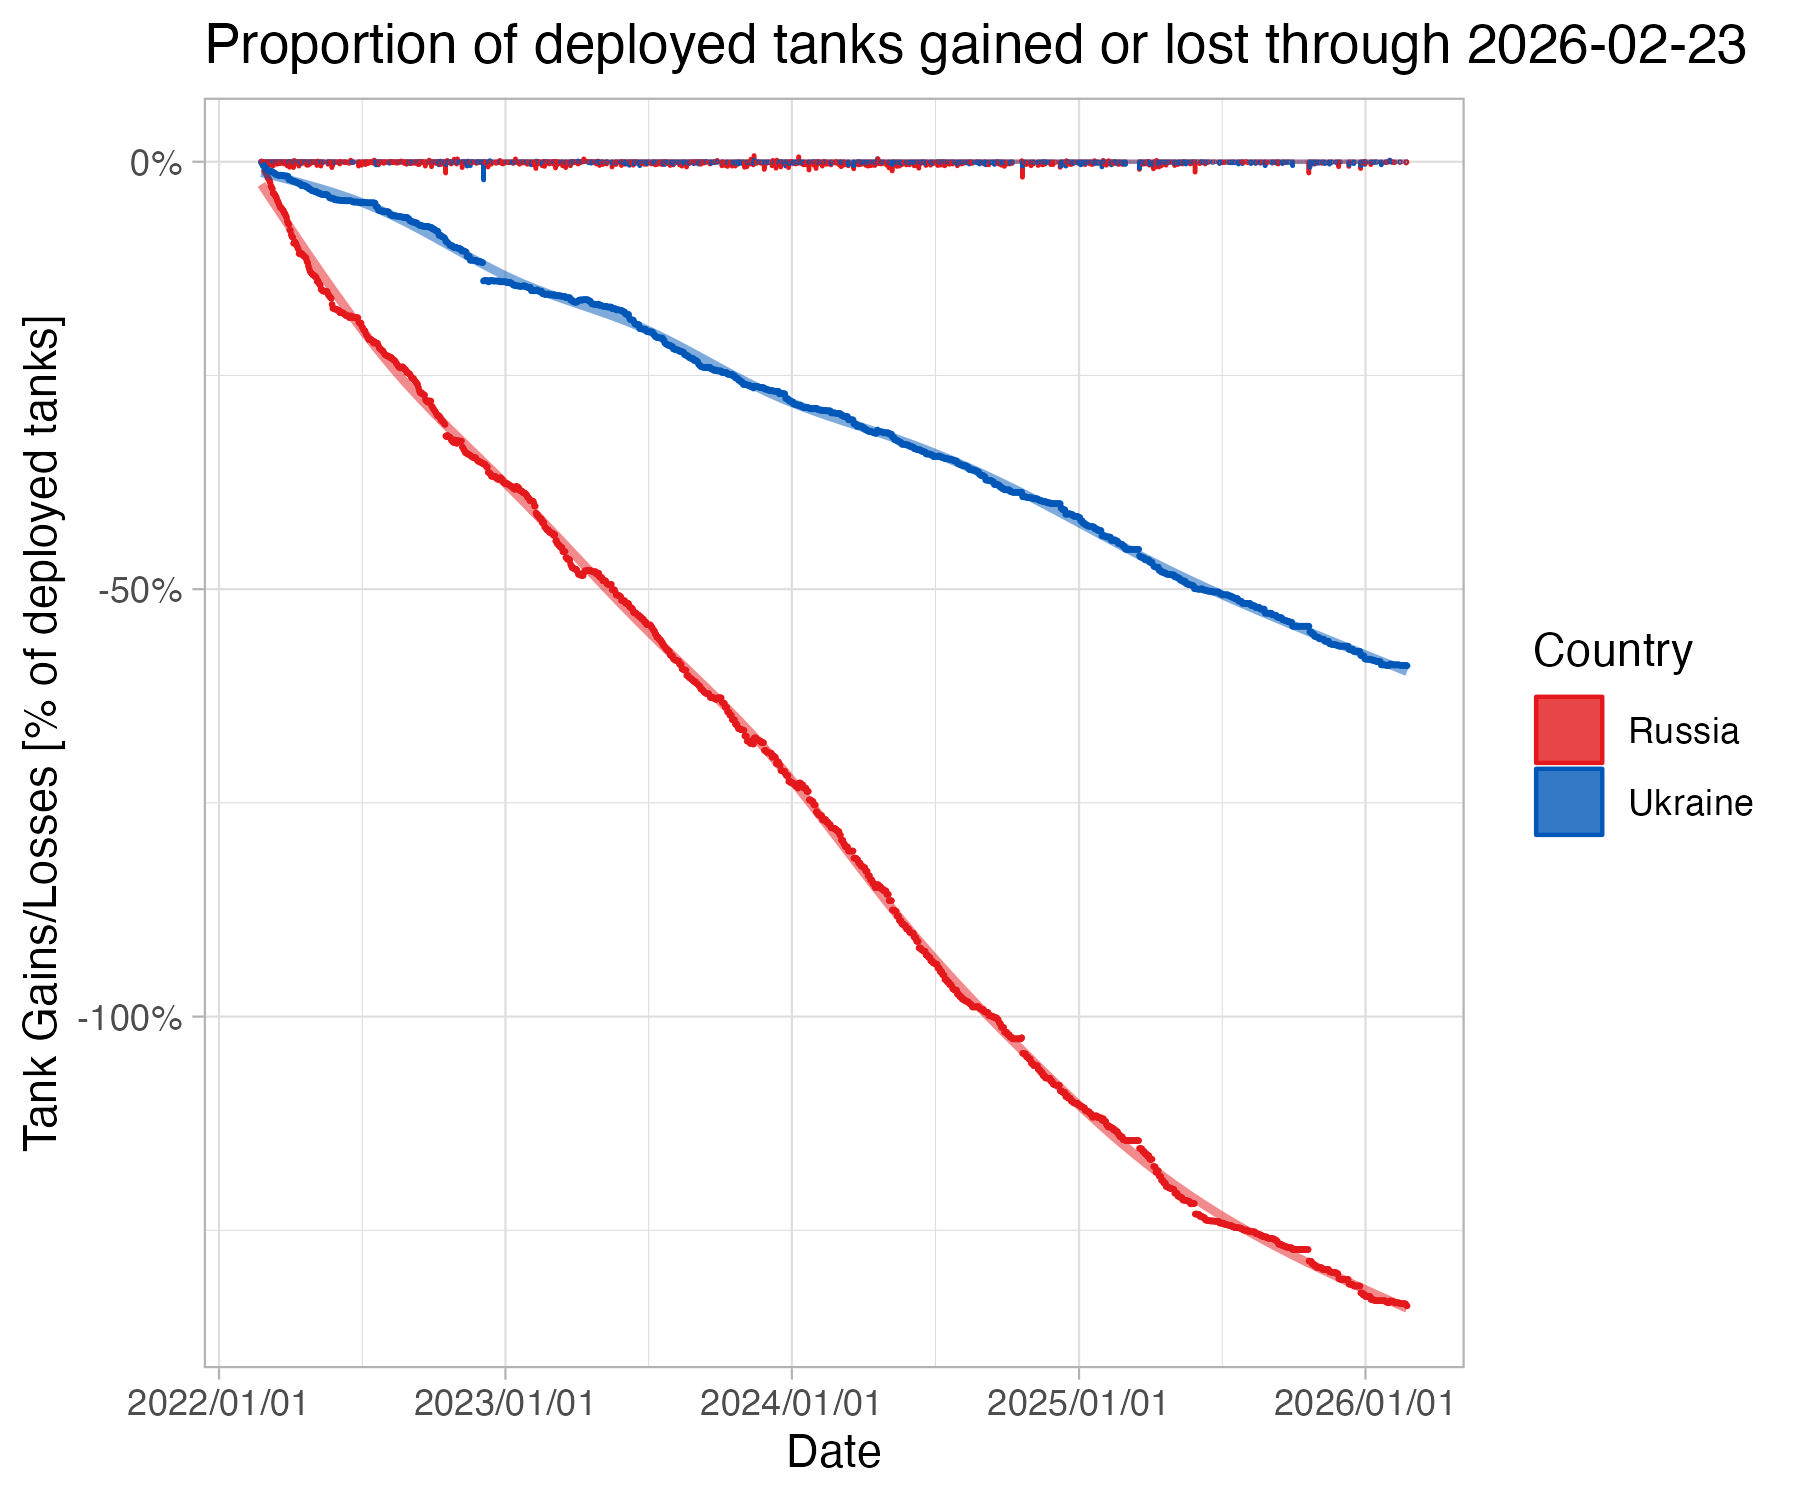
 If we consider estimates of deployed Russian tanks fixed to their total inventory, it is clear that Ukraine is adding to its tank fleet near the rate Russia is losing theirs. Though note that this measure assumes Russia has the capability to use all 13,300 of its tanks in Ukraine if needed.
 If we consider estimates of deployed Russian tanks fixed to their starting number, the picture is considerably more positive for Ukraine. Instead of recording only losses, this fixes the baseline (2,840 for Russia vs. 2,100 for Ukraine) and factors both tank losses and gains (e.g. captures). By this metric Russia has lost well over 5% of its tanks while Ukraine has supplemented its by 2% (e.g. captured more than it has lost).
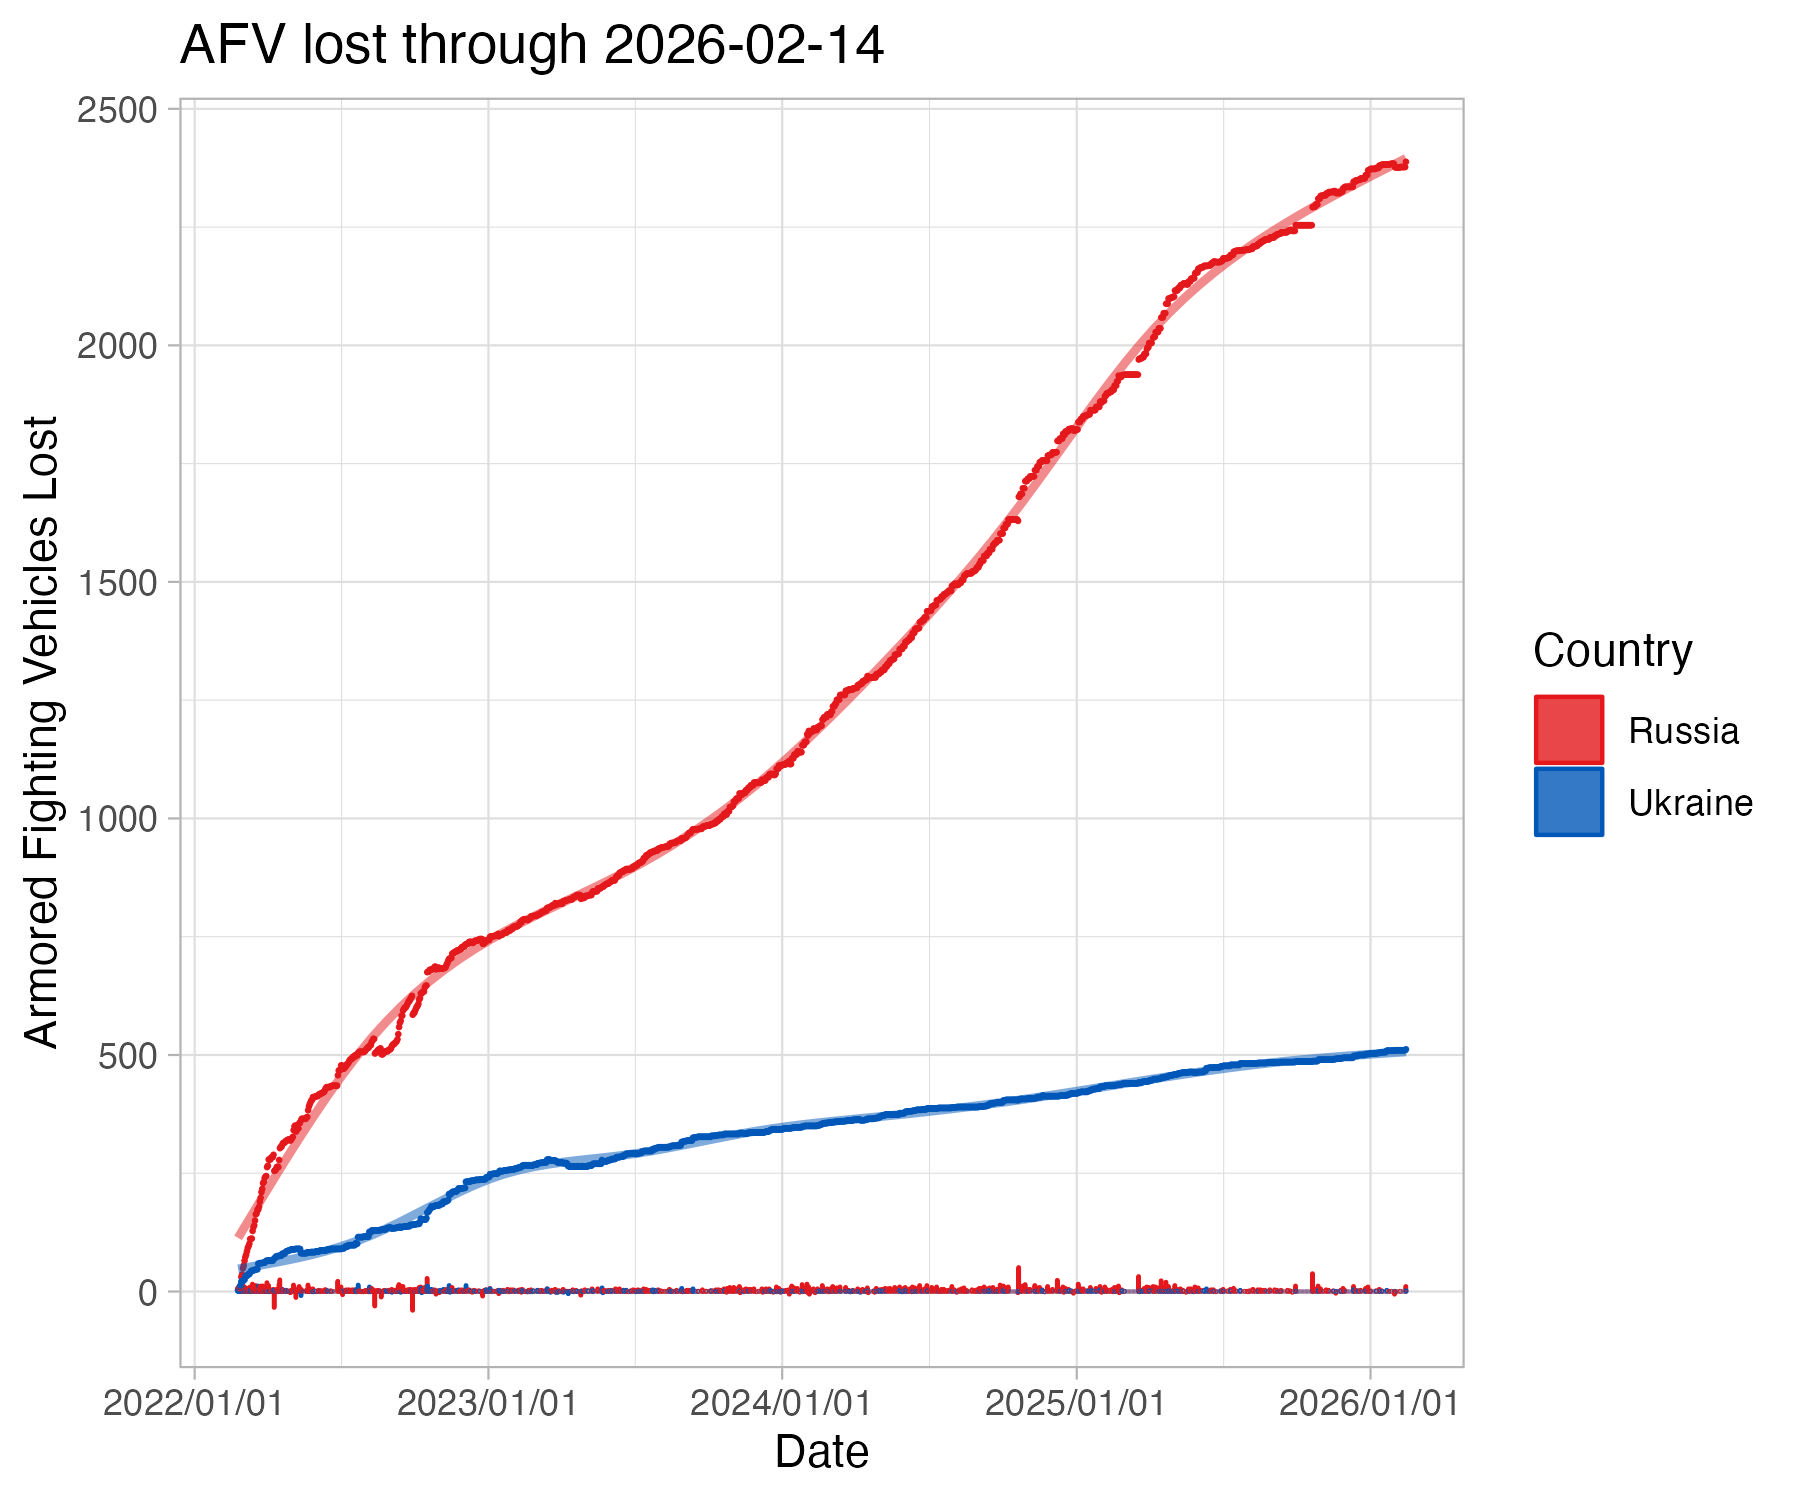 Armored Fighting Vehicles also see parity in losses in the first 4 days of the war, though Russian losses increase less dramatically than is seen with tanks. Note that this estimate factors in verified AFV captures by both Russia and Ukraine.
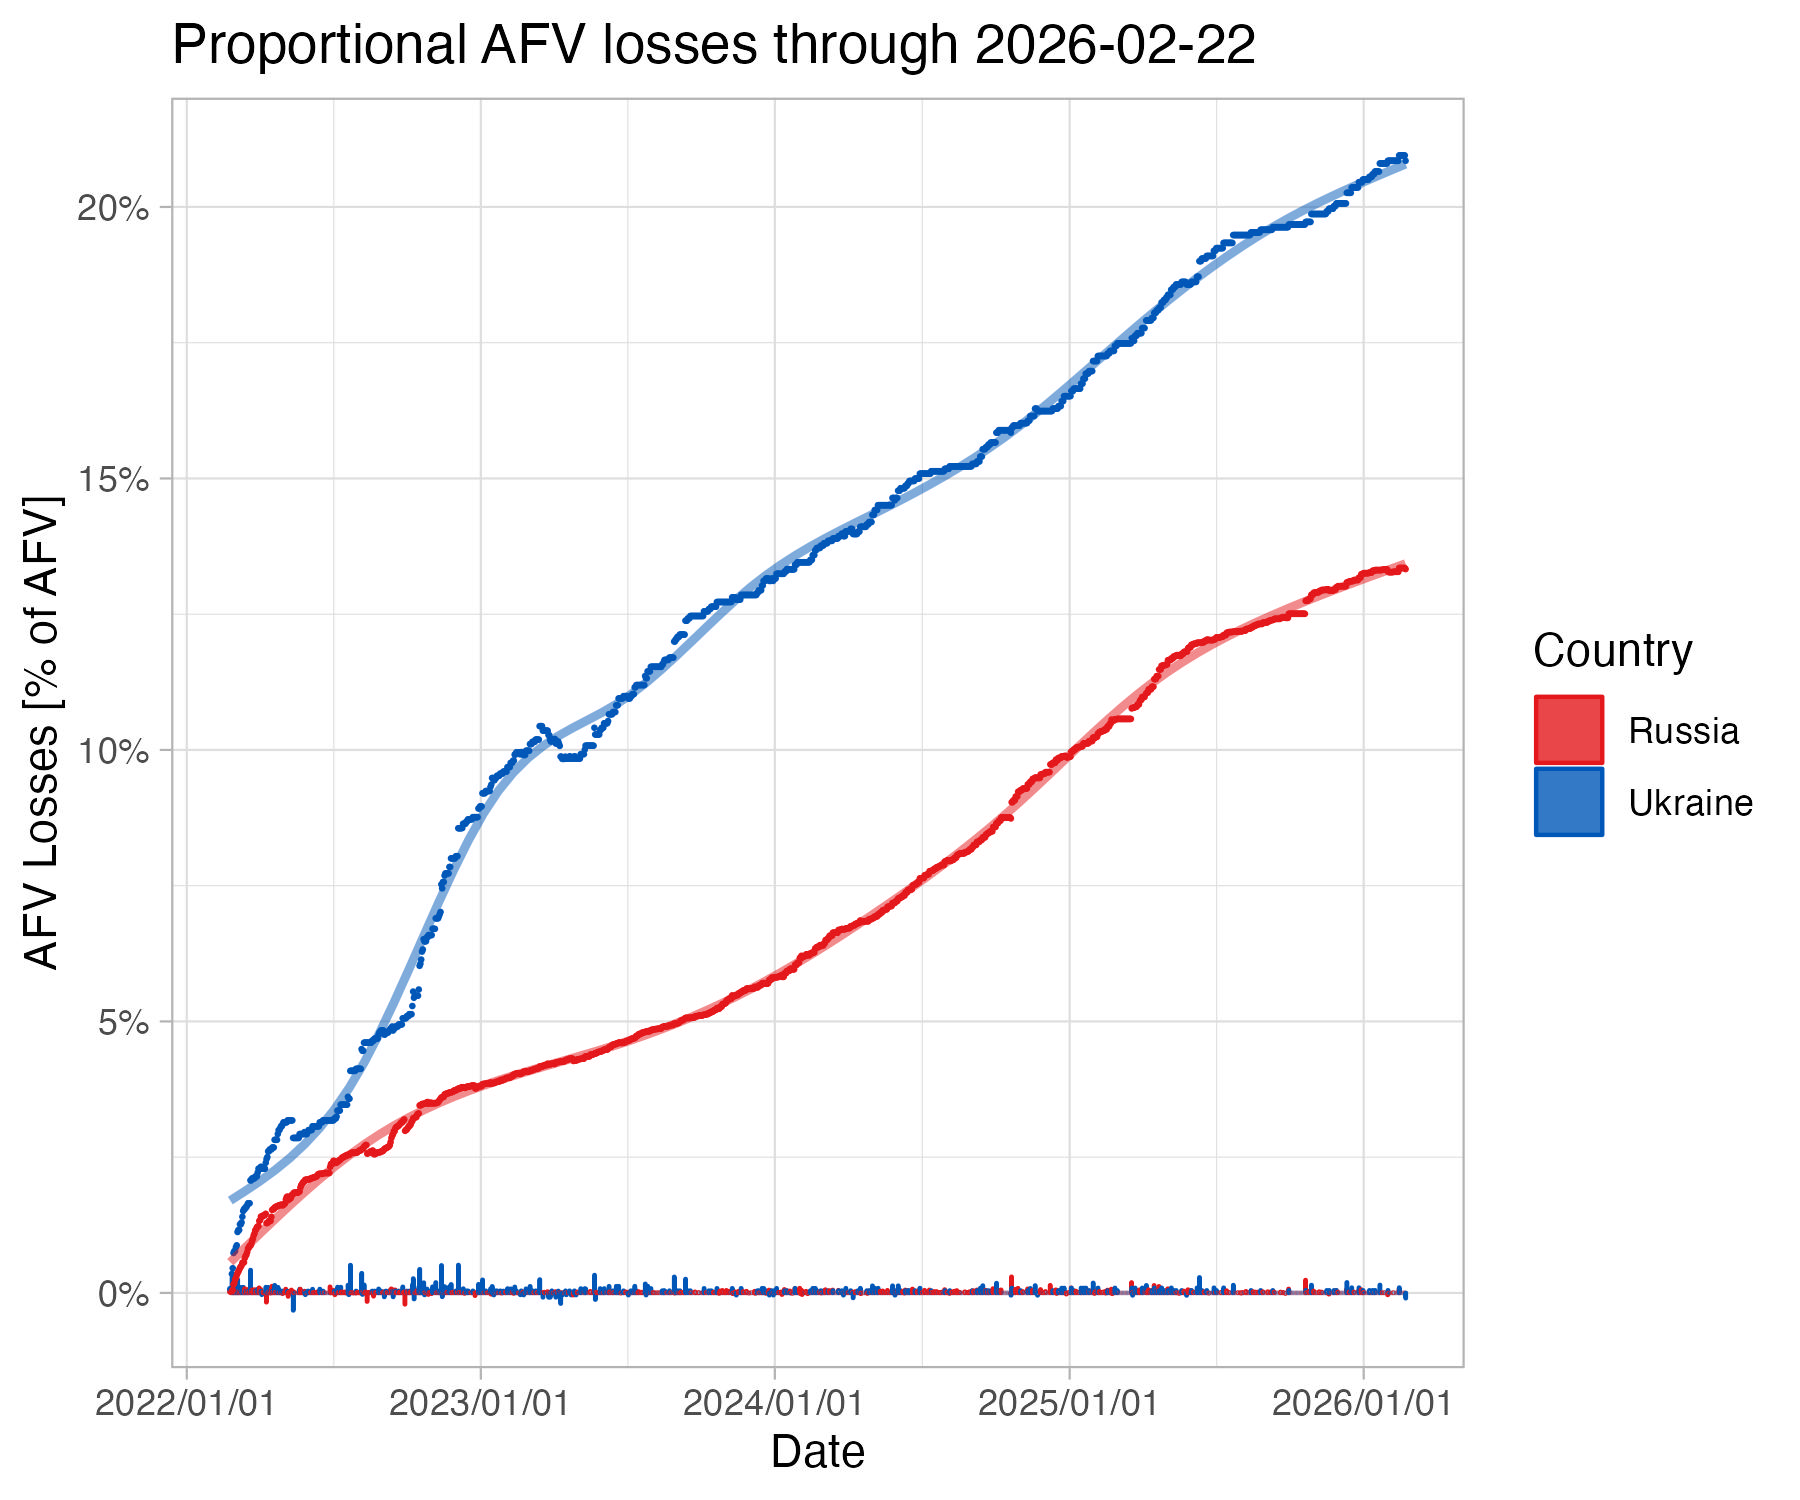 When normalized to standing inventory, Russia's losses are a less significant fraction of their total inventory compared to Ukraine. This higlhights the steep challenge Ukraine faces. In general, Ukraine loses 1 AFV for every 3 it takes from Russia. This ratio has to get to 4 or higher to be sustainble.
 If we consider estimates of deployed Russian AFV fixed to their total inventory, Ukraine is adding modestly to its AFV inventory at the same rate which Russia is losing its AFV.
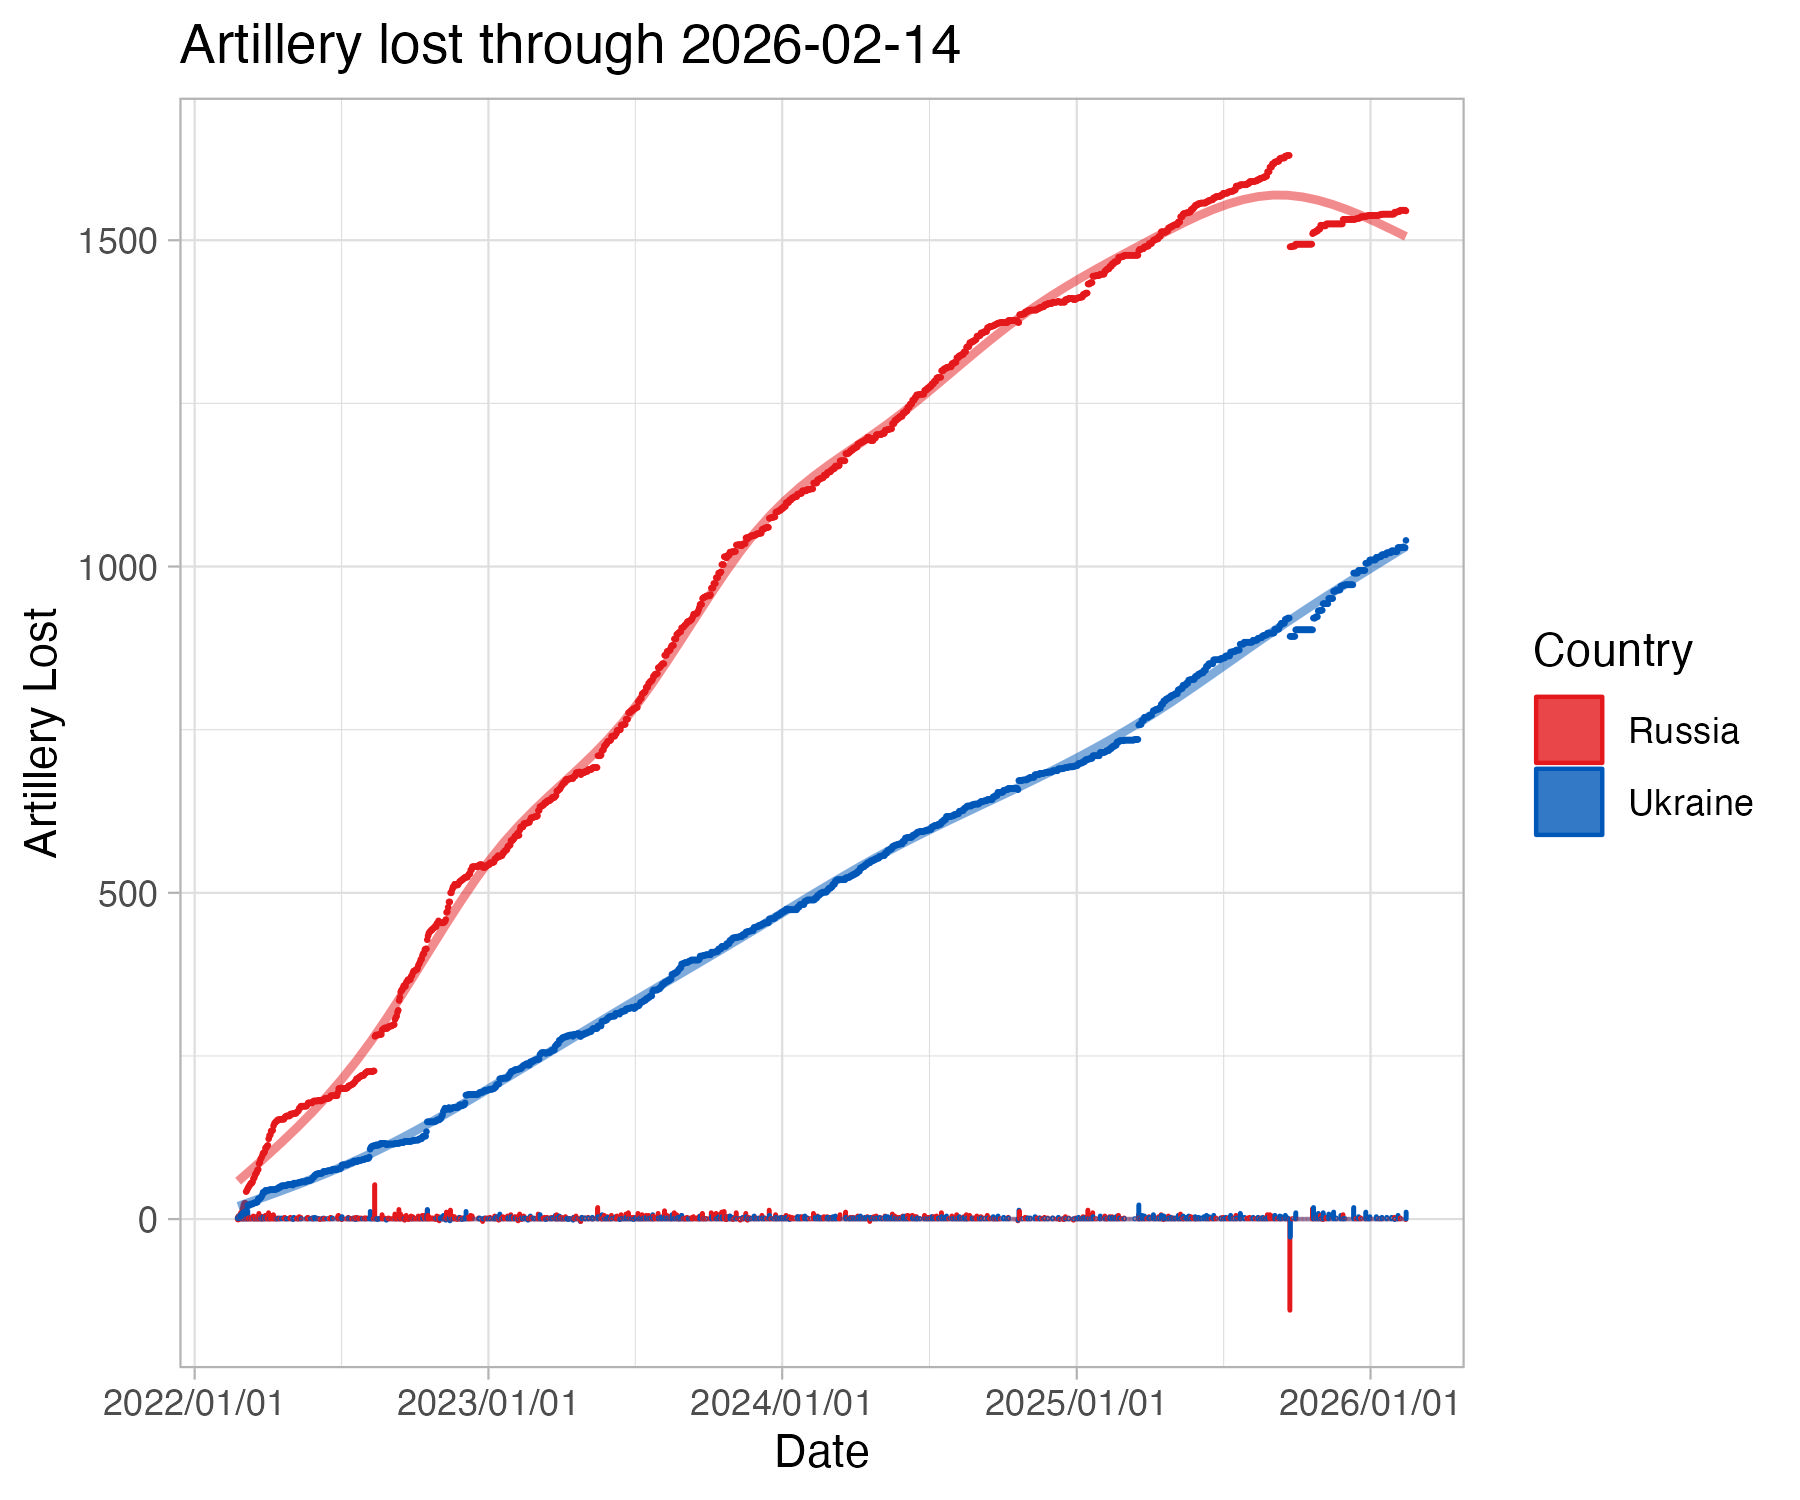 The ratio of Russian to Ukrainian artillery losses is 3:1, though Russia's losses have plateued since the first week of April.
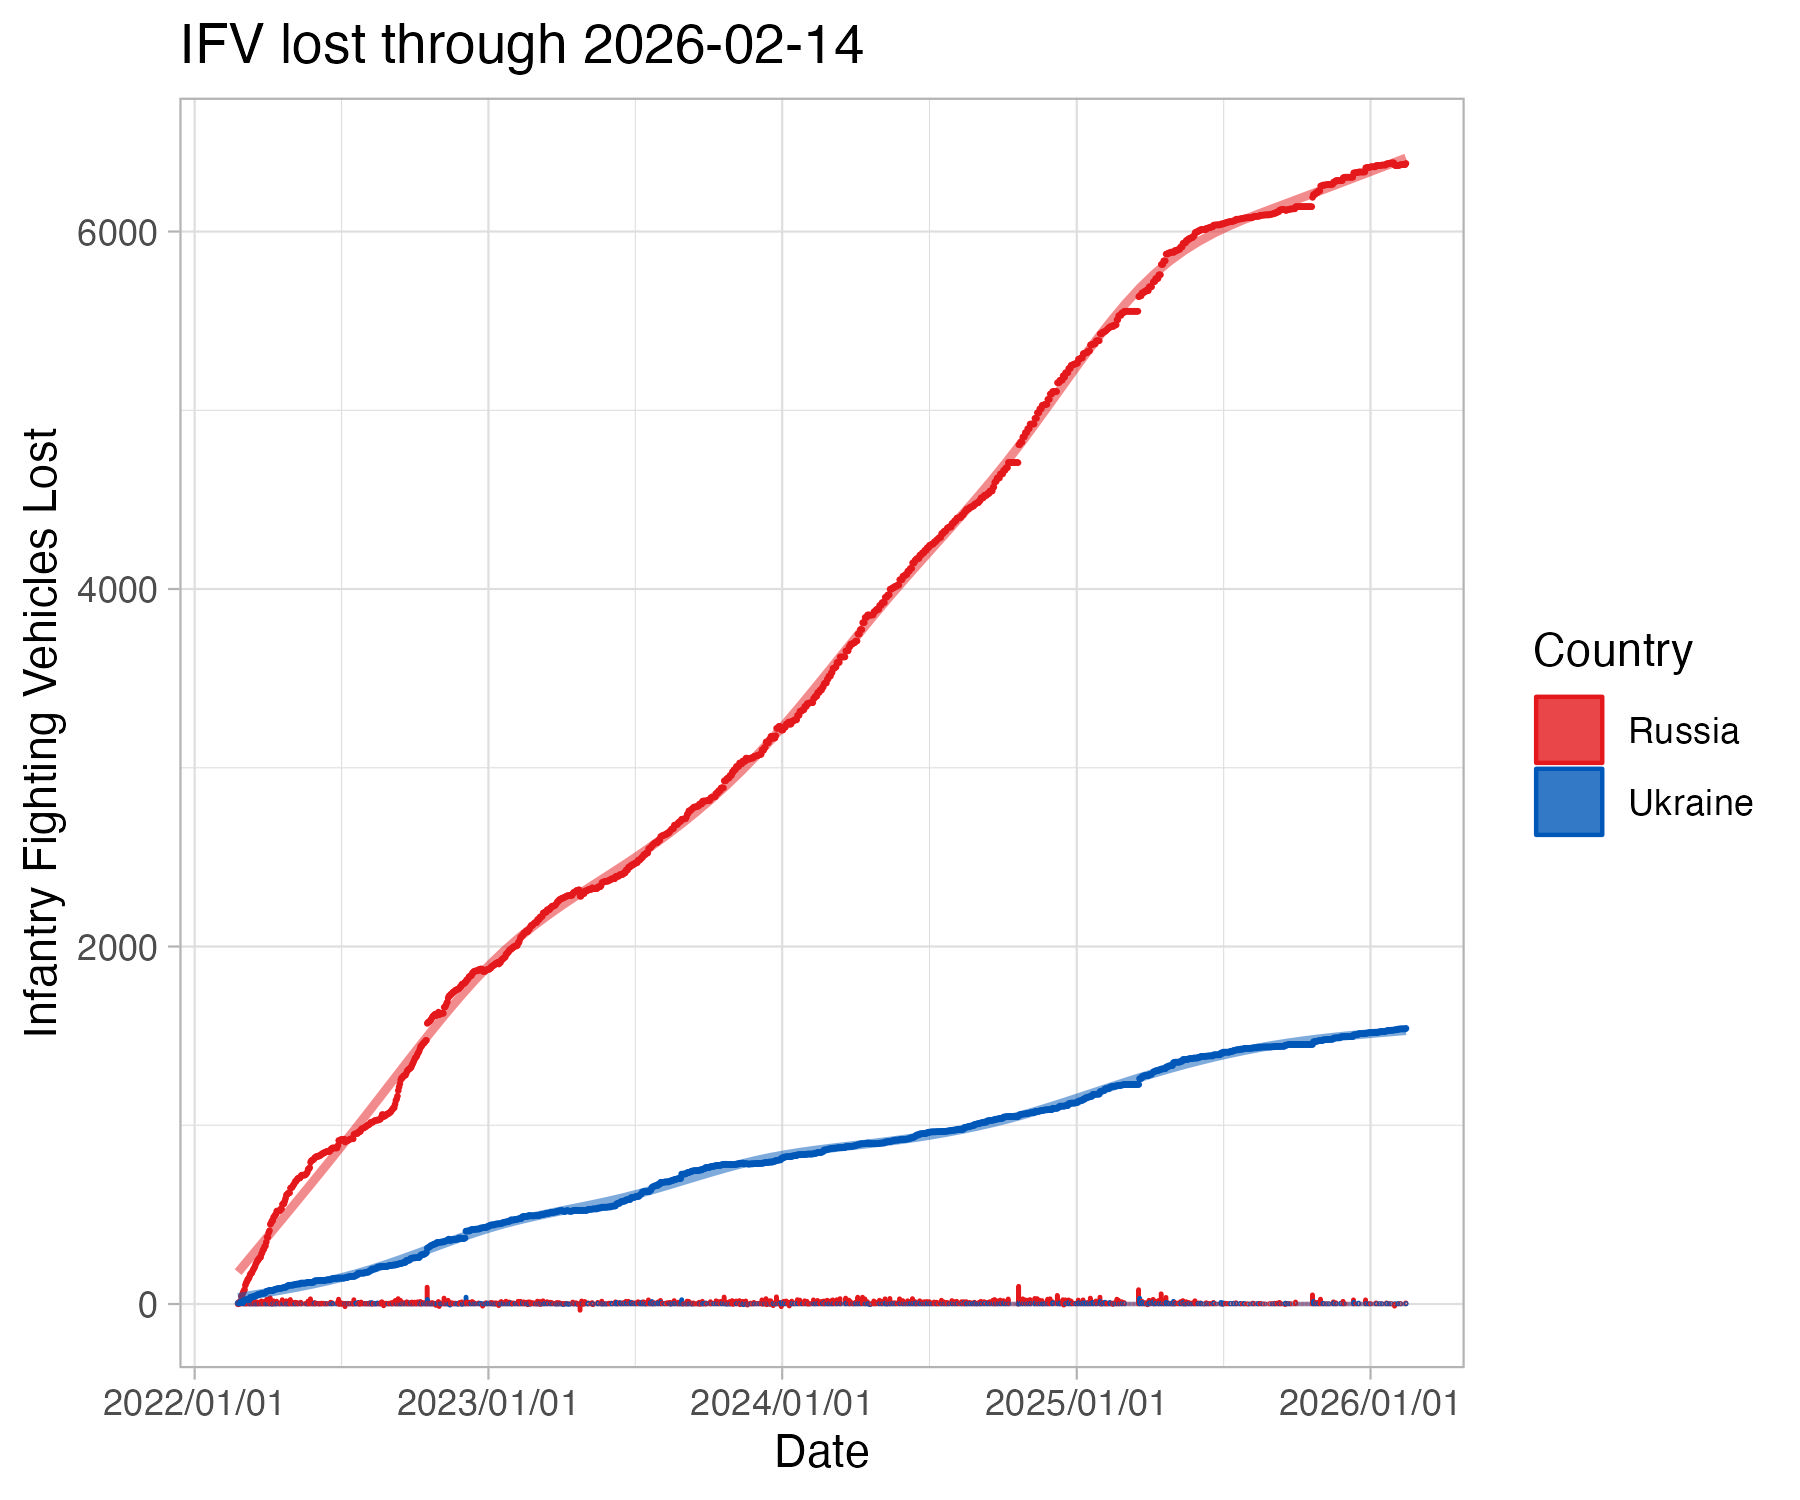 Ukranian's lost more Infrantry Fighting Vehicles in the first two days of the war, with Russian losses acellerating linearly until the end of the second week.
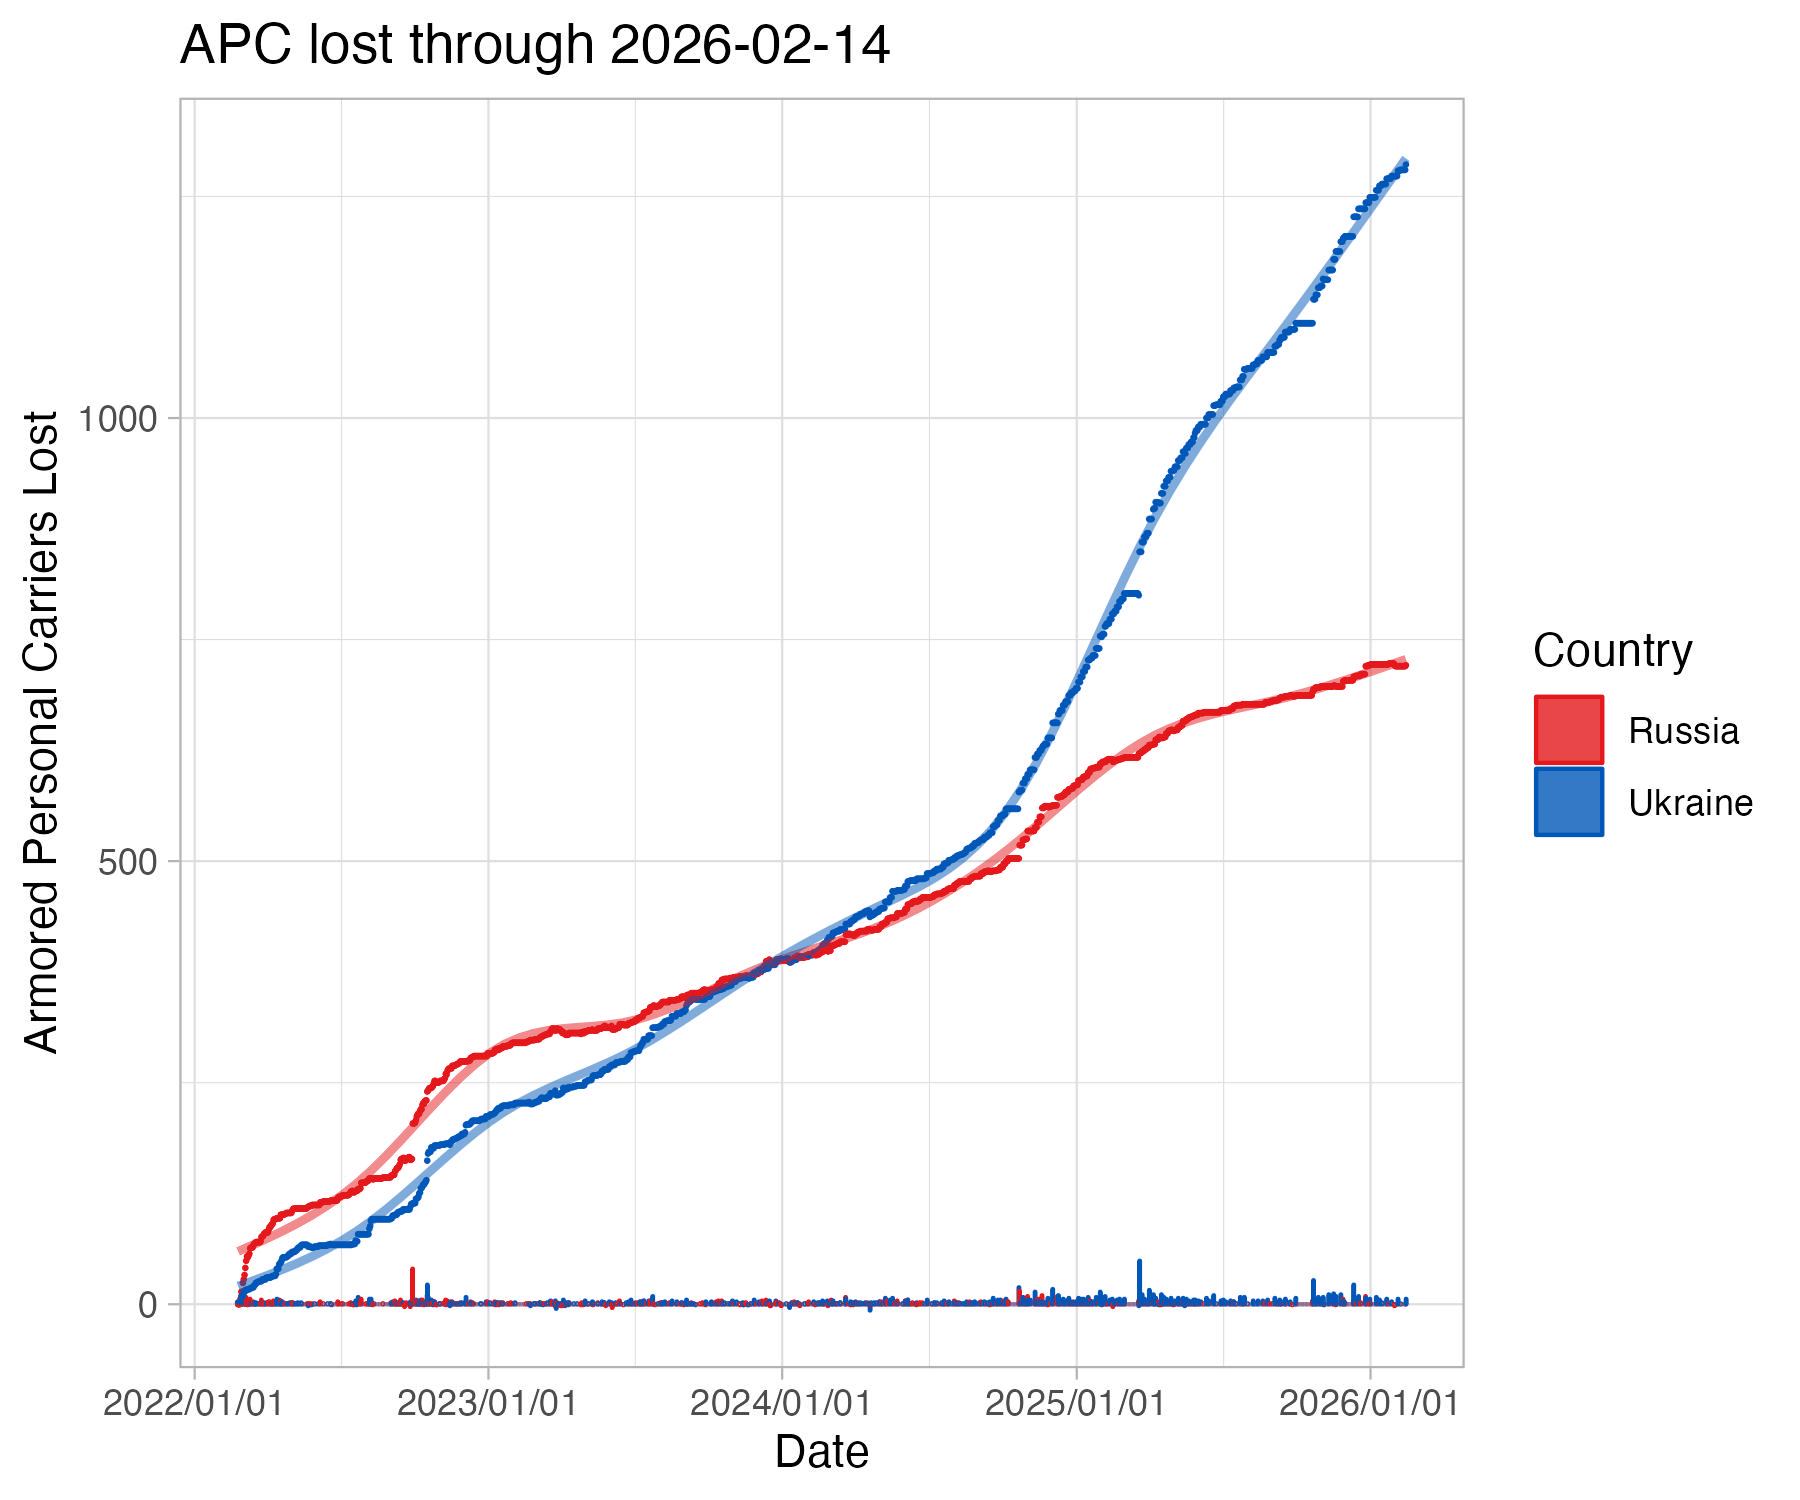 Ukranian's lost more Armored Personel Carriers in the first two days of the war, with Russian losses acellerating linearly until the end of the second week, though the differential is less dramatic than with AFVs.
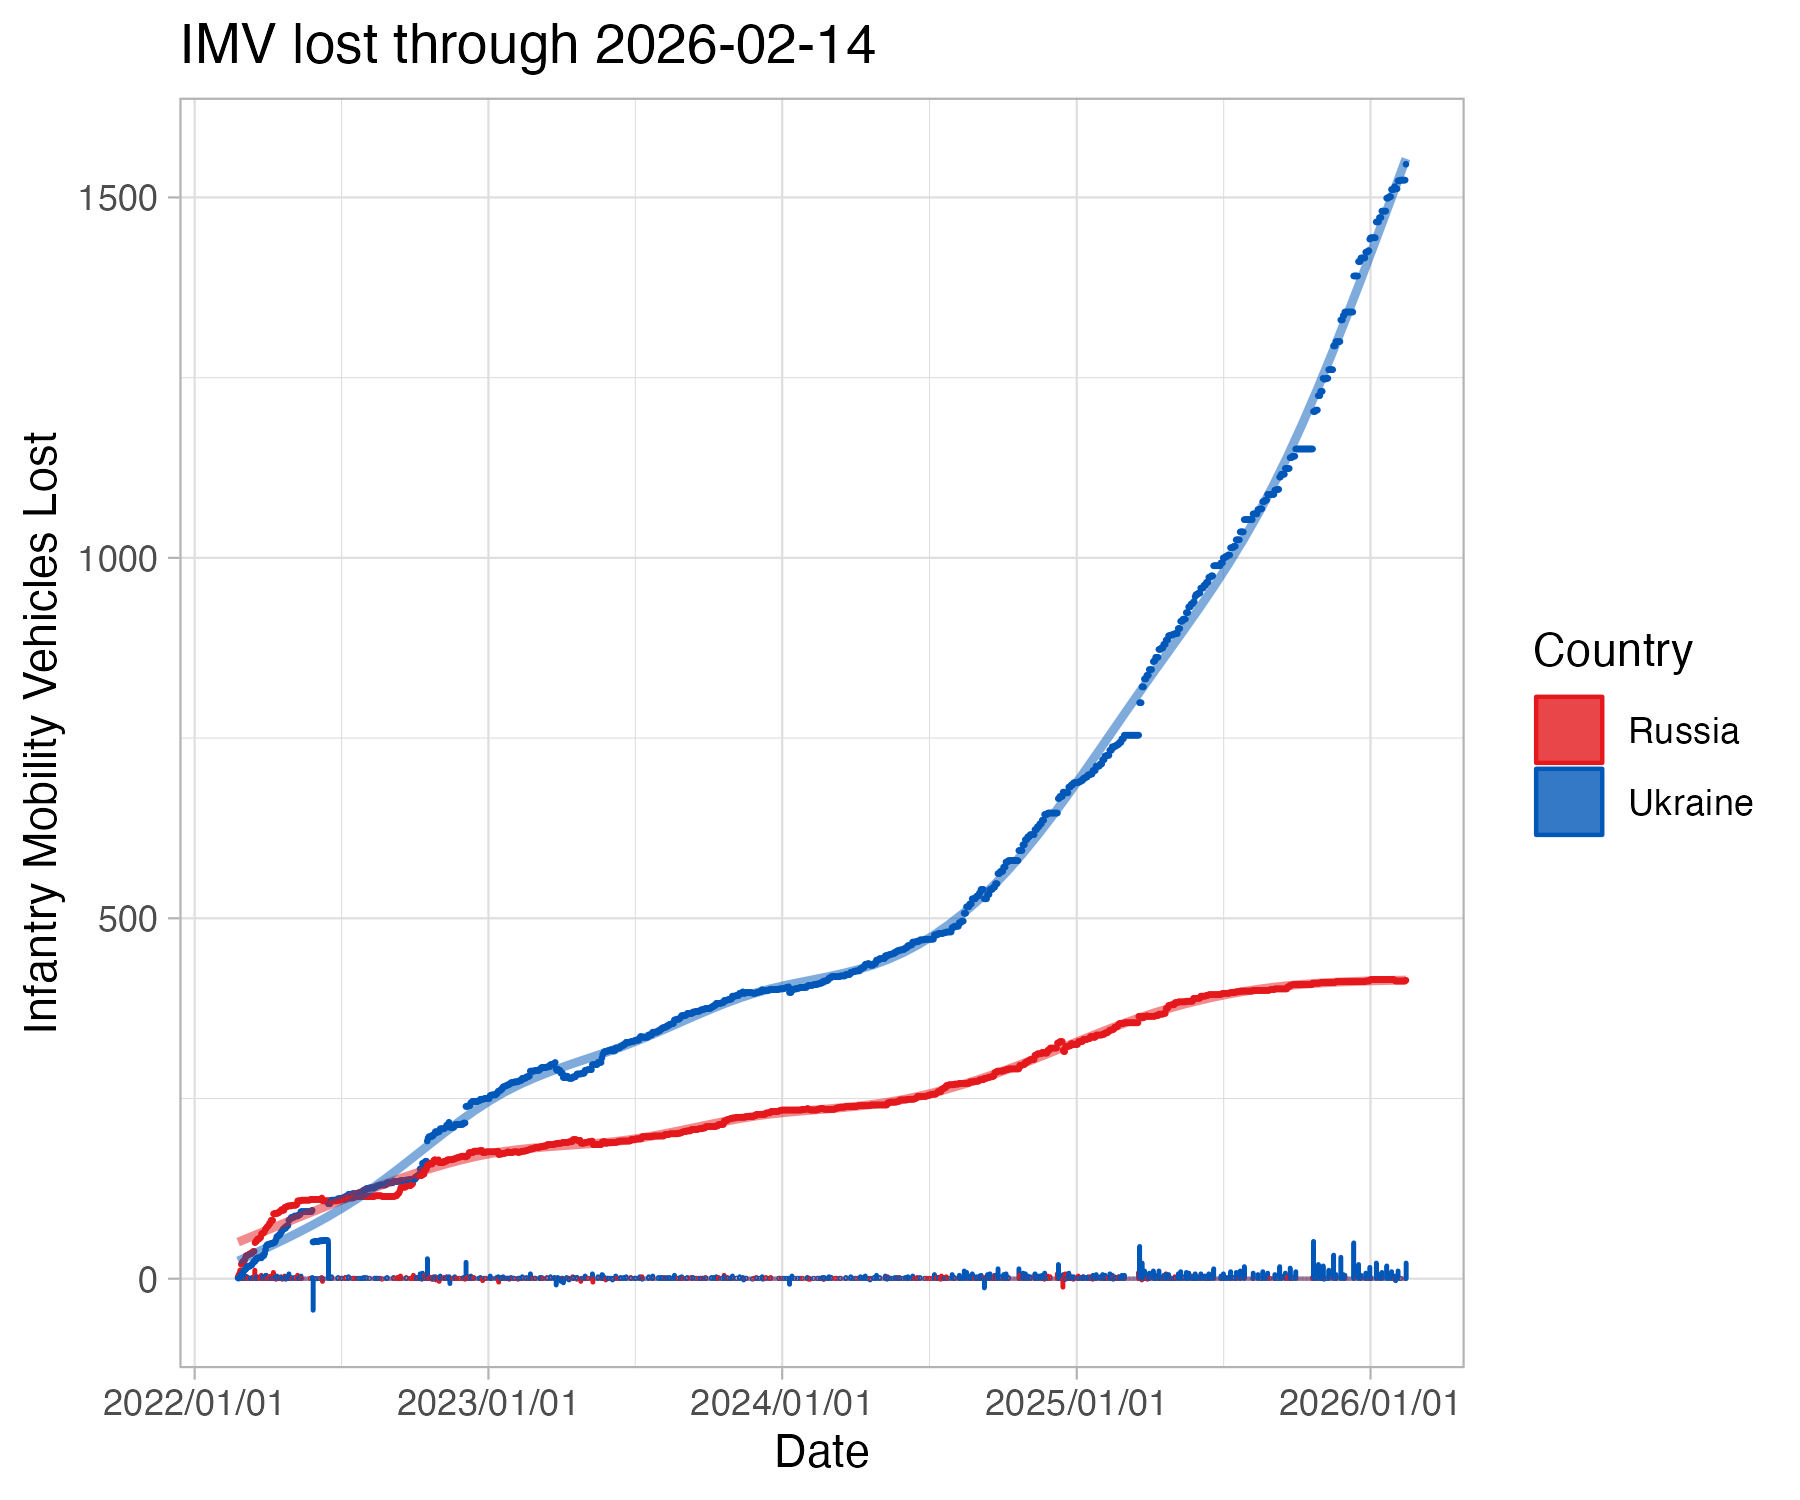 Infantry Mobility Vehicle losses are more or less equivalent between Ukranian and Russian forces through the first two weeks of the war.
"Synthetic" refers to a combination of vehicle types to form a theme - such as aircraft (fighters + helicopters + drones) or anti-aircraft (SAM + MANPADS), etc.
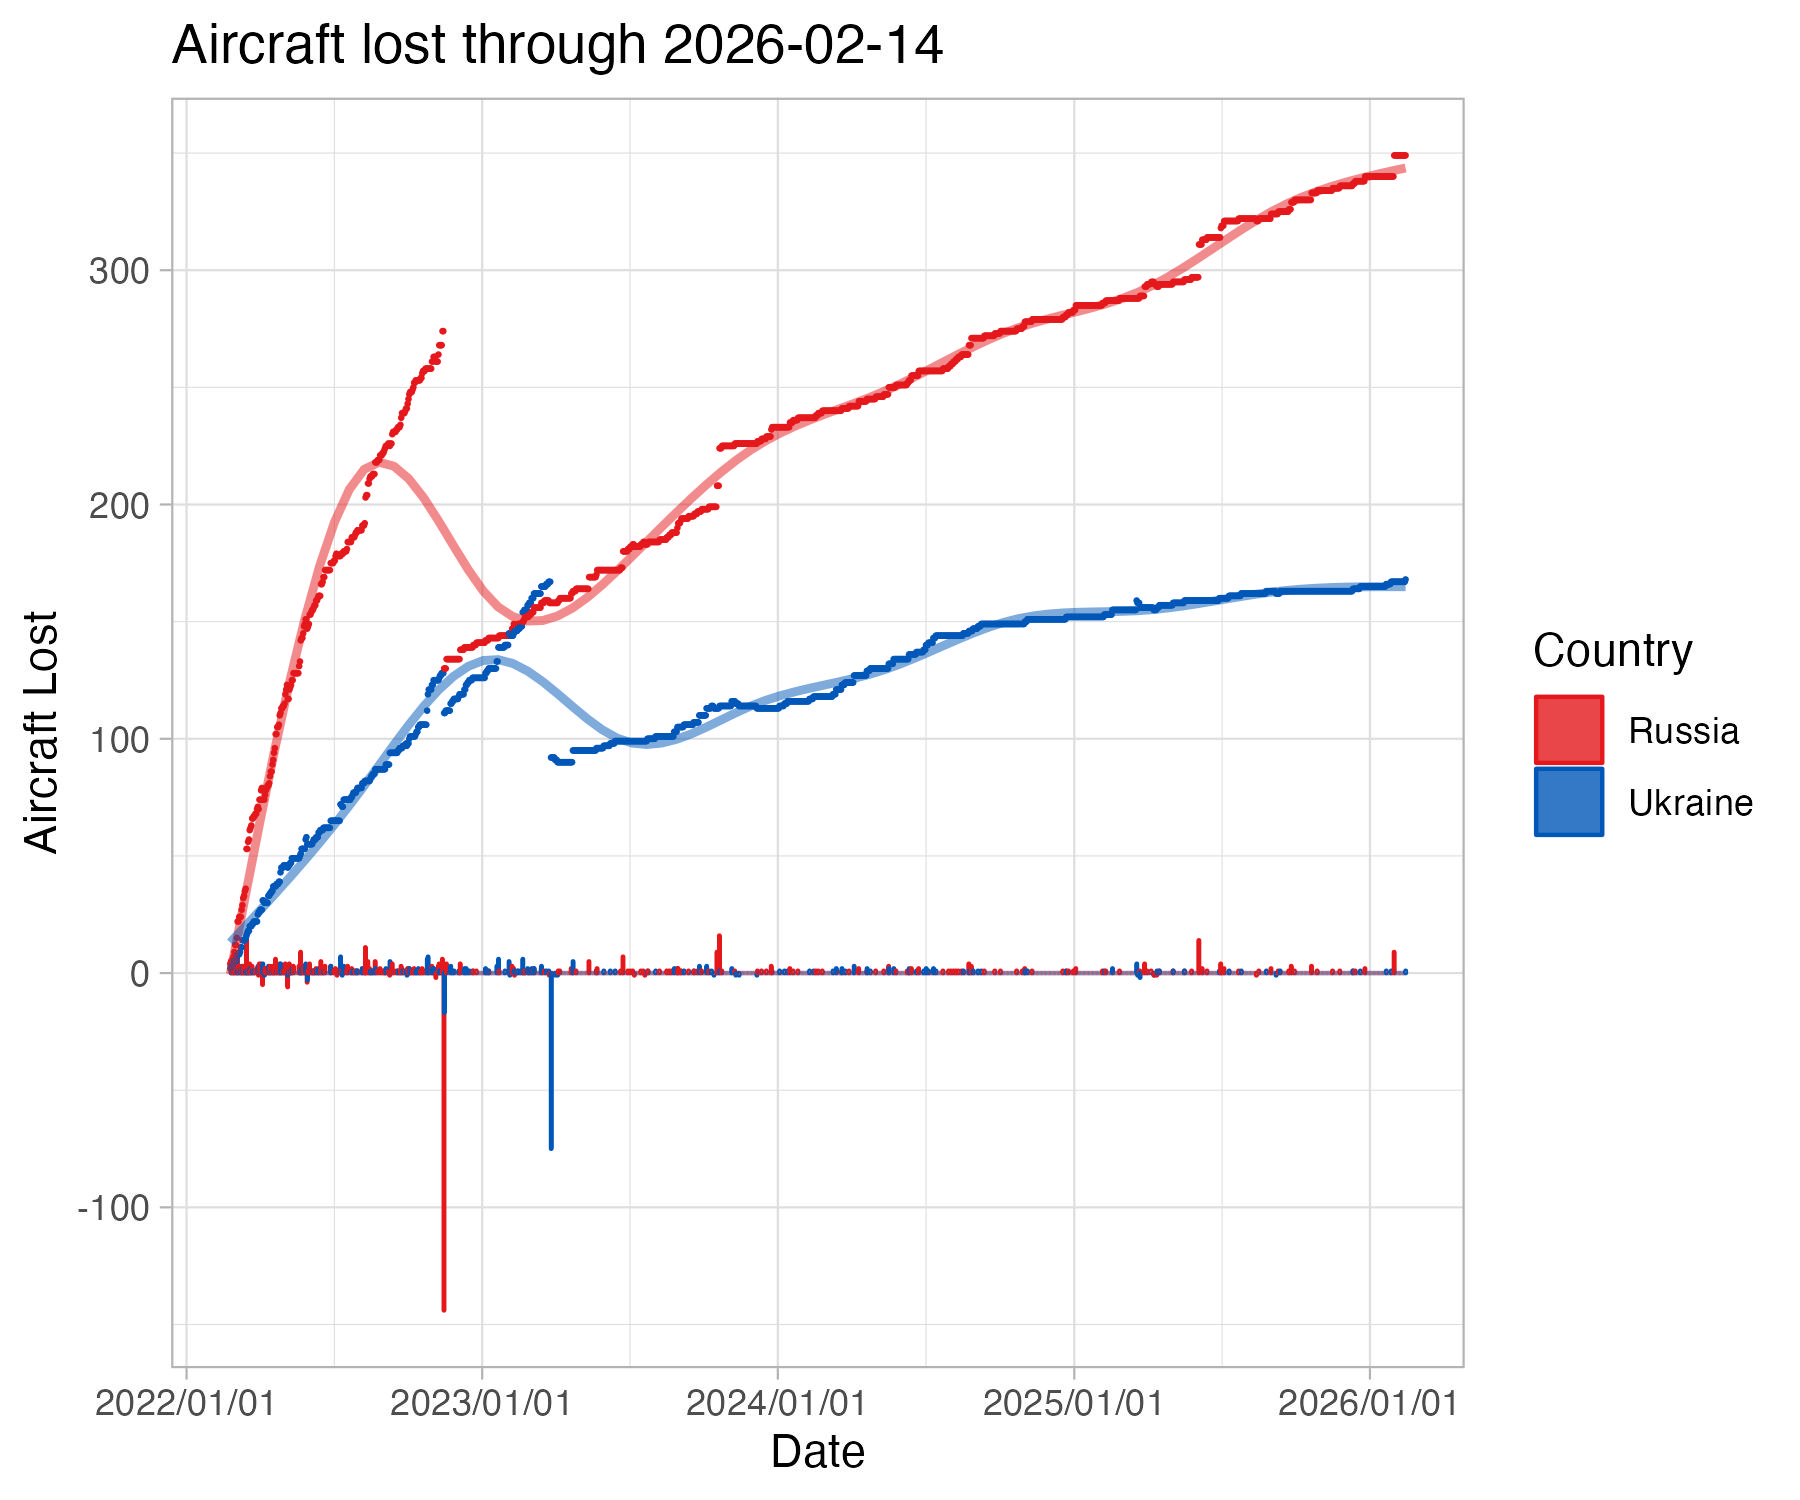 Ukranians have lost aircraft linearly, while Russians lost them almost exponentially in teh first two weeks of the war, though there are signs this is tapering sharpely. This calculation includes fighters, helicotpers, and drones.
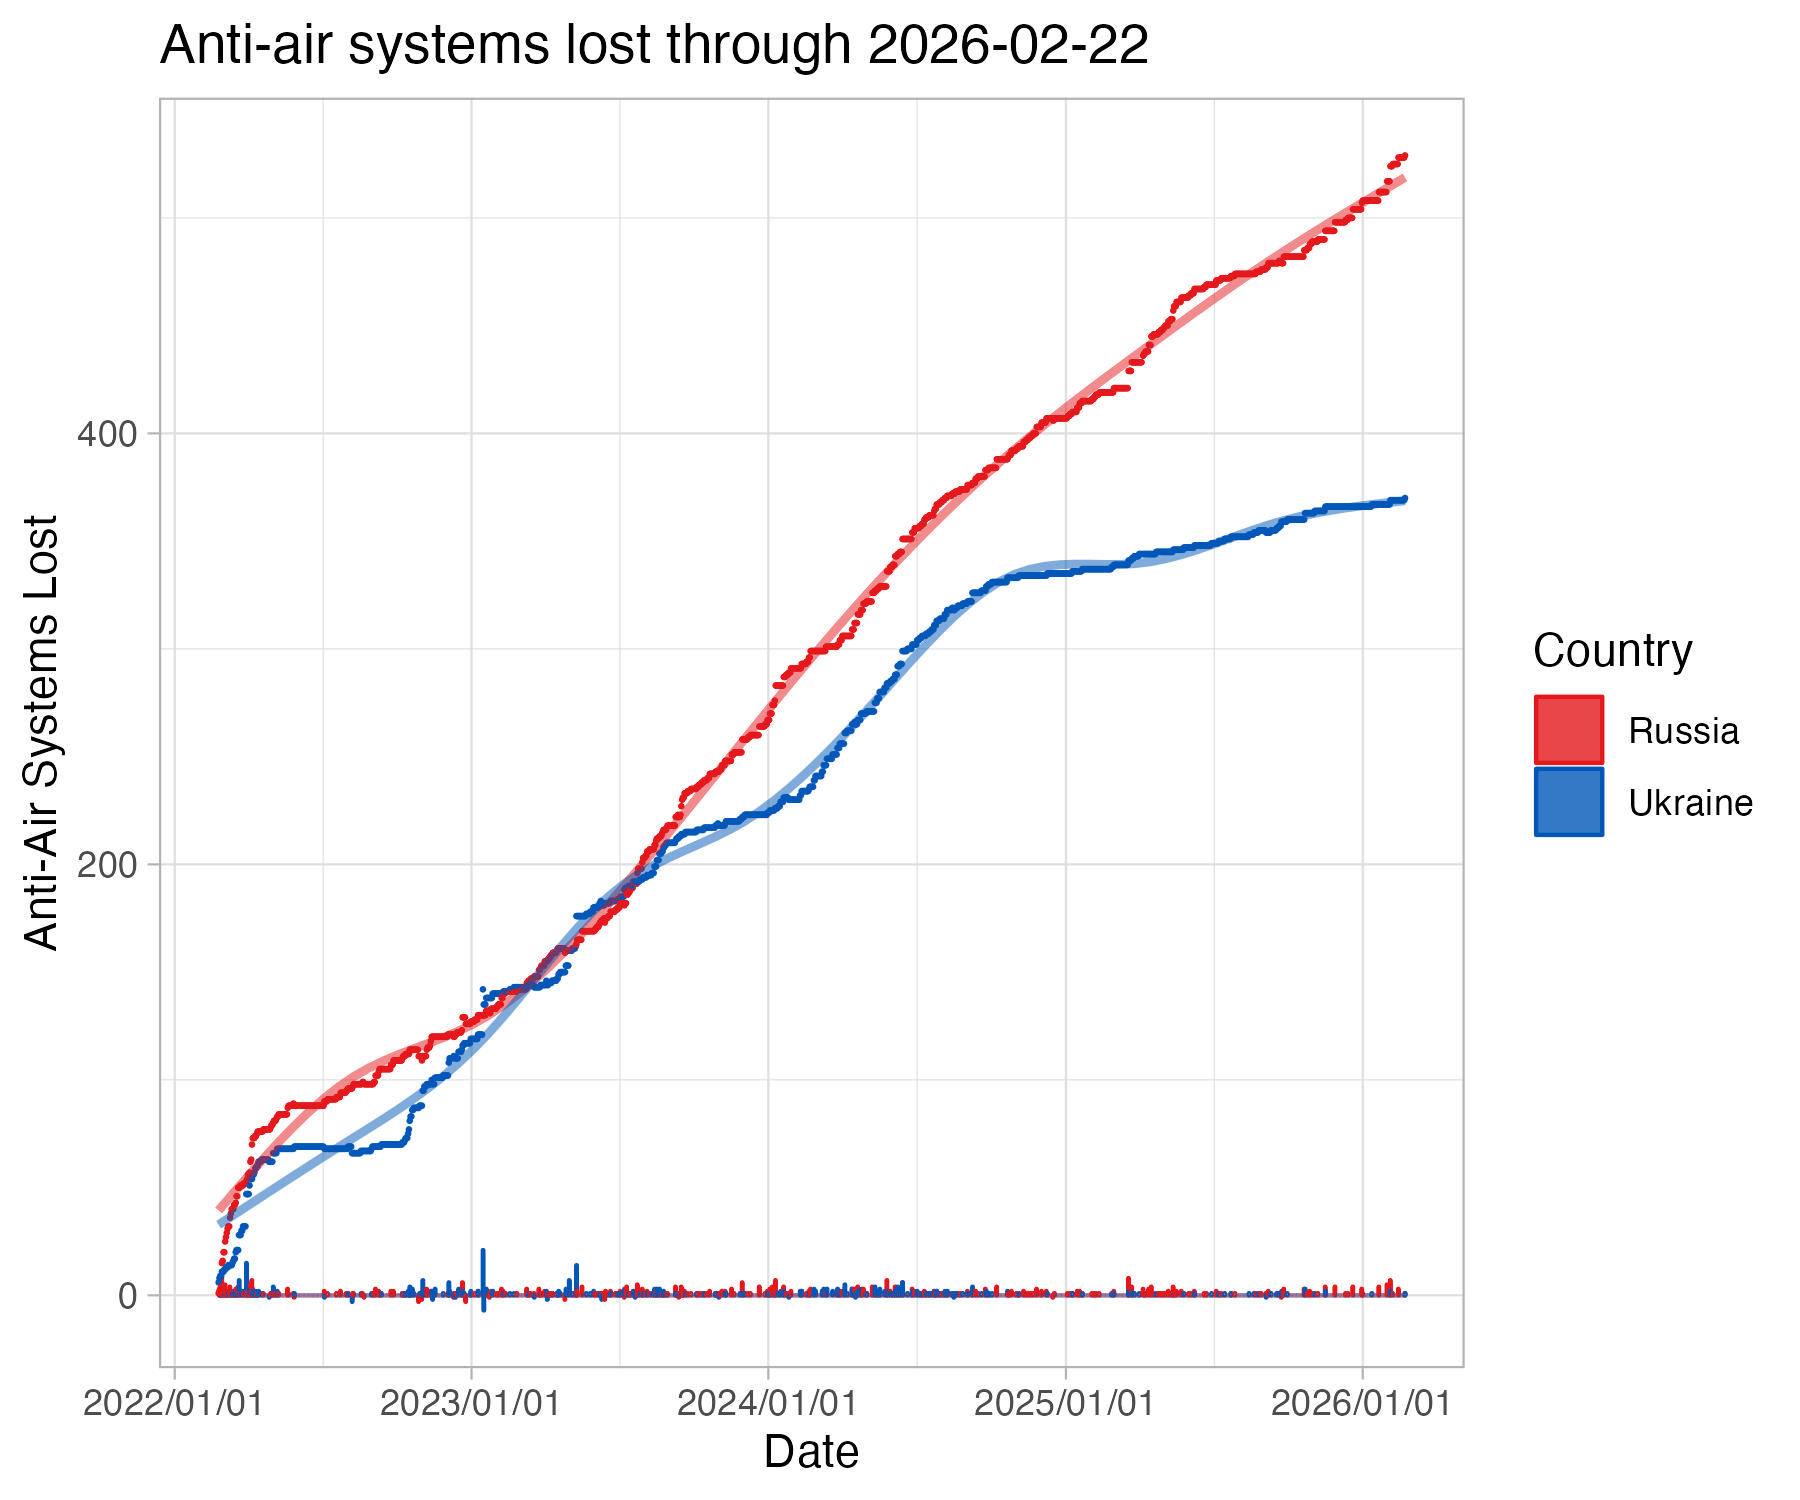 Ukranians sustained higher rates of loss of anti-air systems through the first week of the war, though Russian losses have since outpaced them by the second week of the war. This calculation includes MANPADS, SAMs, self-propelled anti-aircraft guns, radar, and jamming systems.
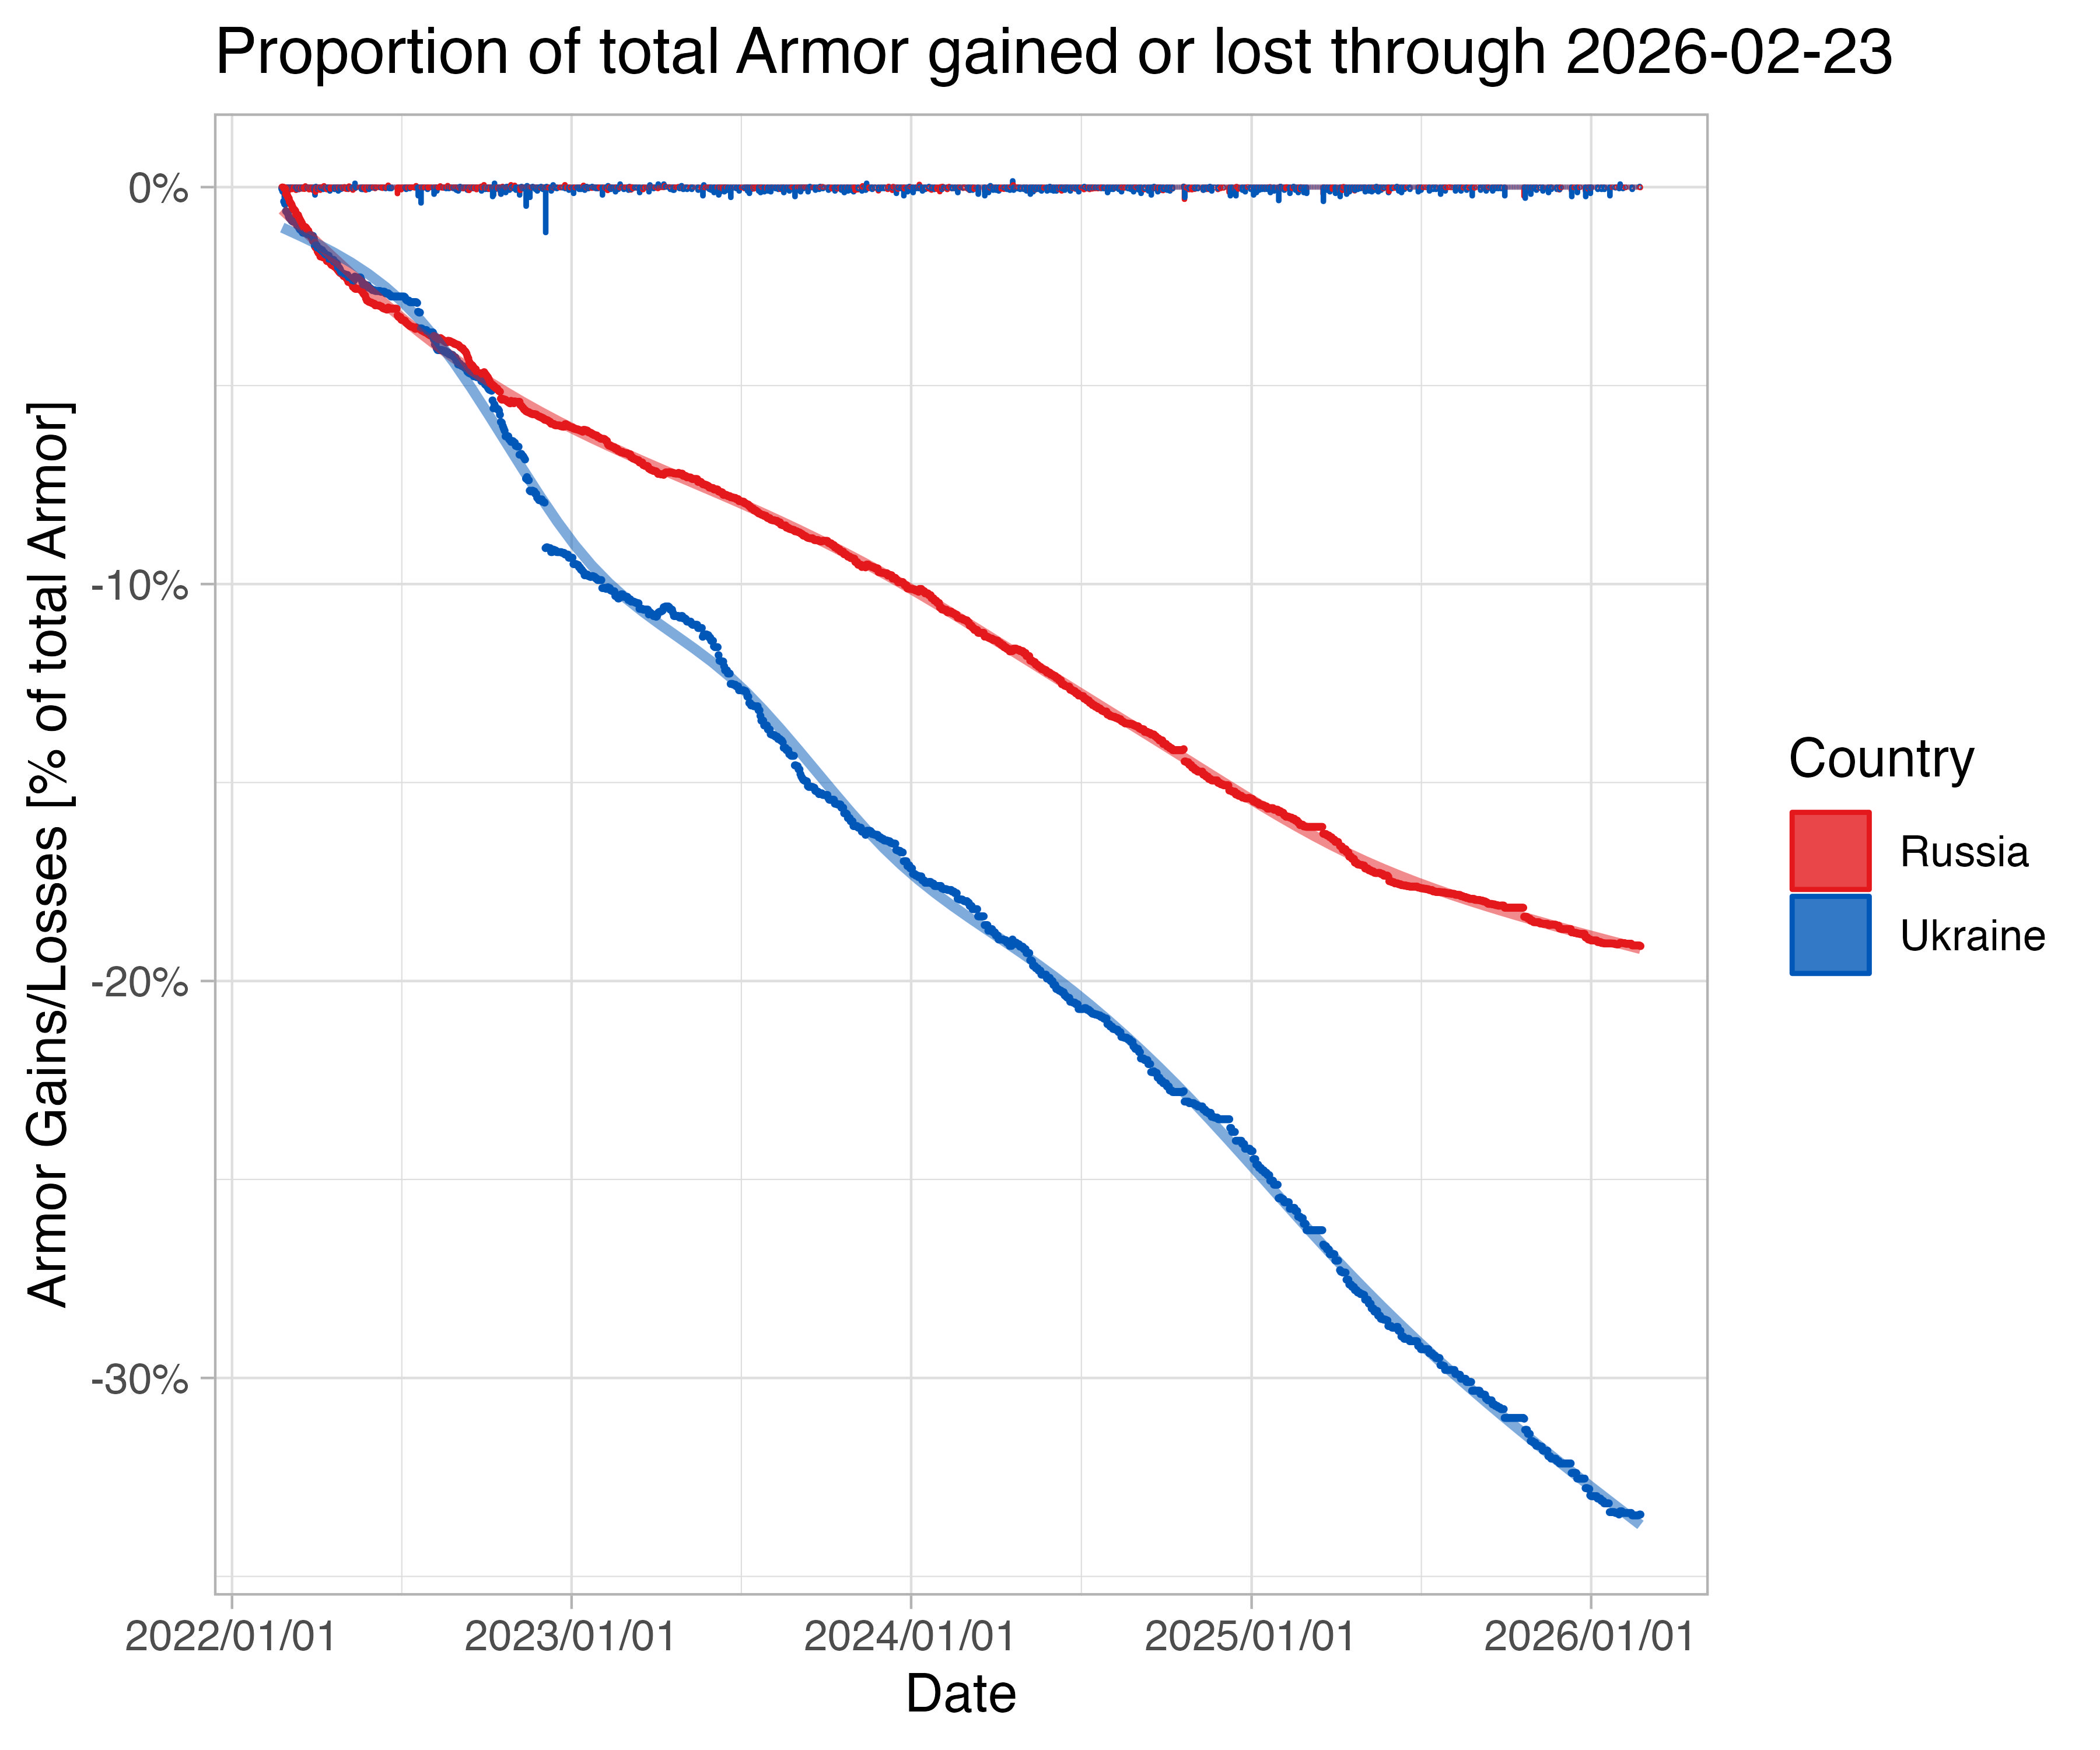
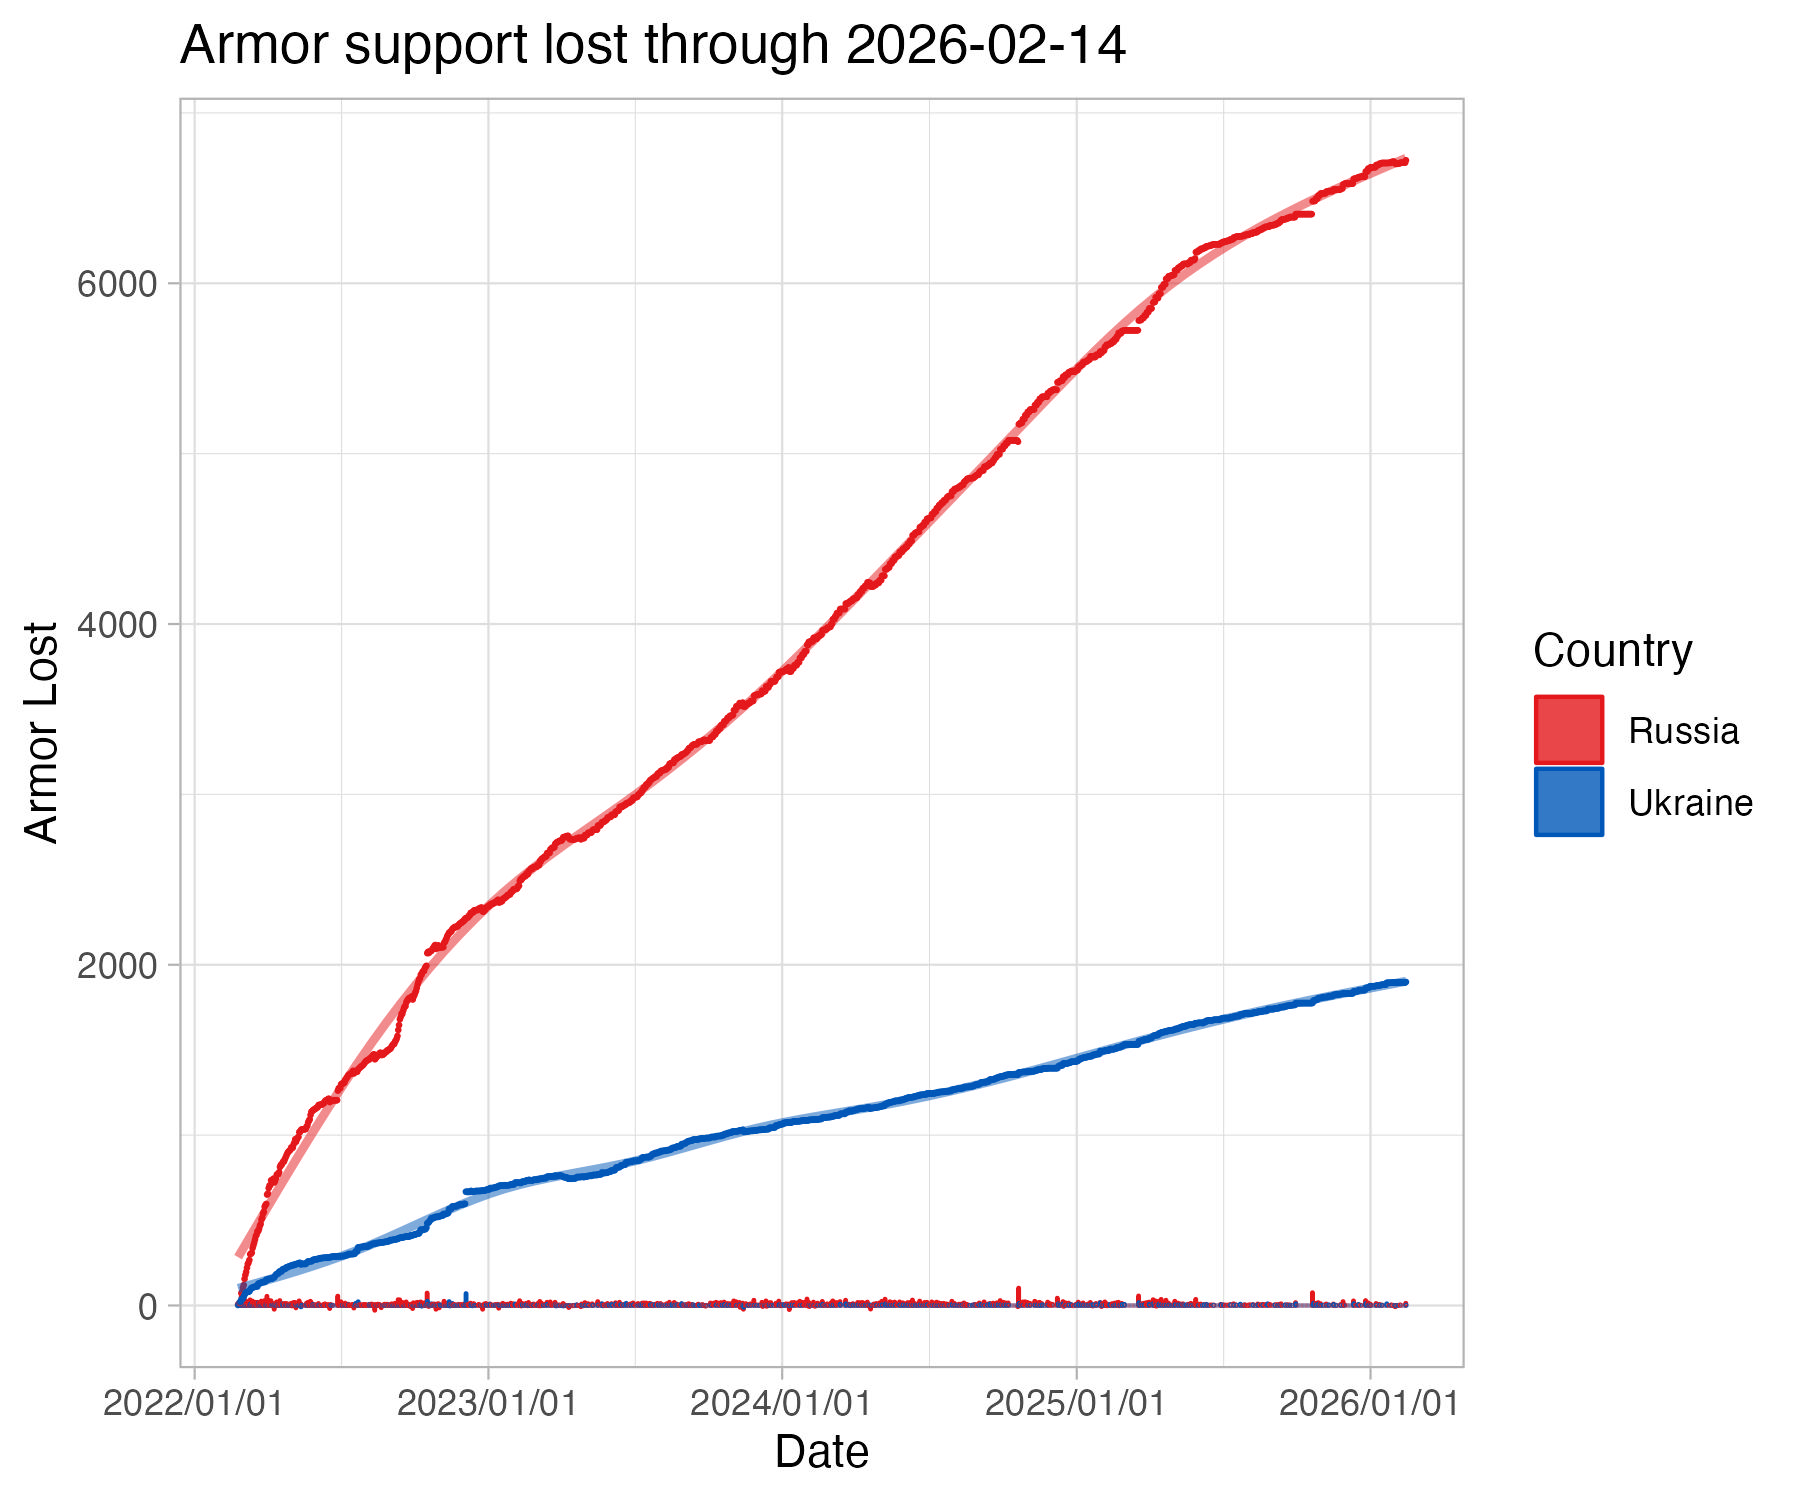 Russian and Ukranian armor losses were equivalent in the first three days of the war, with Russian losses significantly outpacing Ukranians since. This calculaton includes both tanks and armored fighting vehicles.
 If we consider estimates of deployed Russian armor fixed to their total inventory, Ukraine is adding modestly to its armor inventory at the same rate which Russia is losing its Armor.
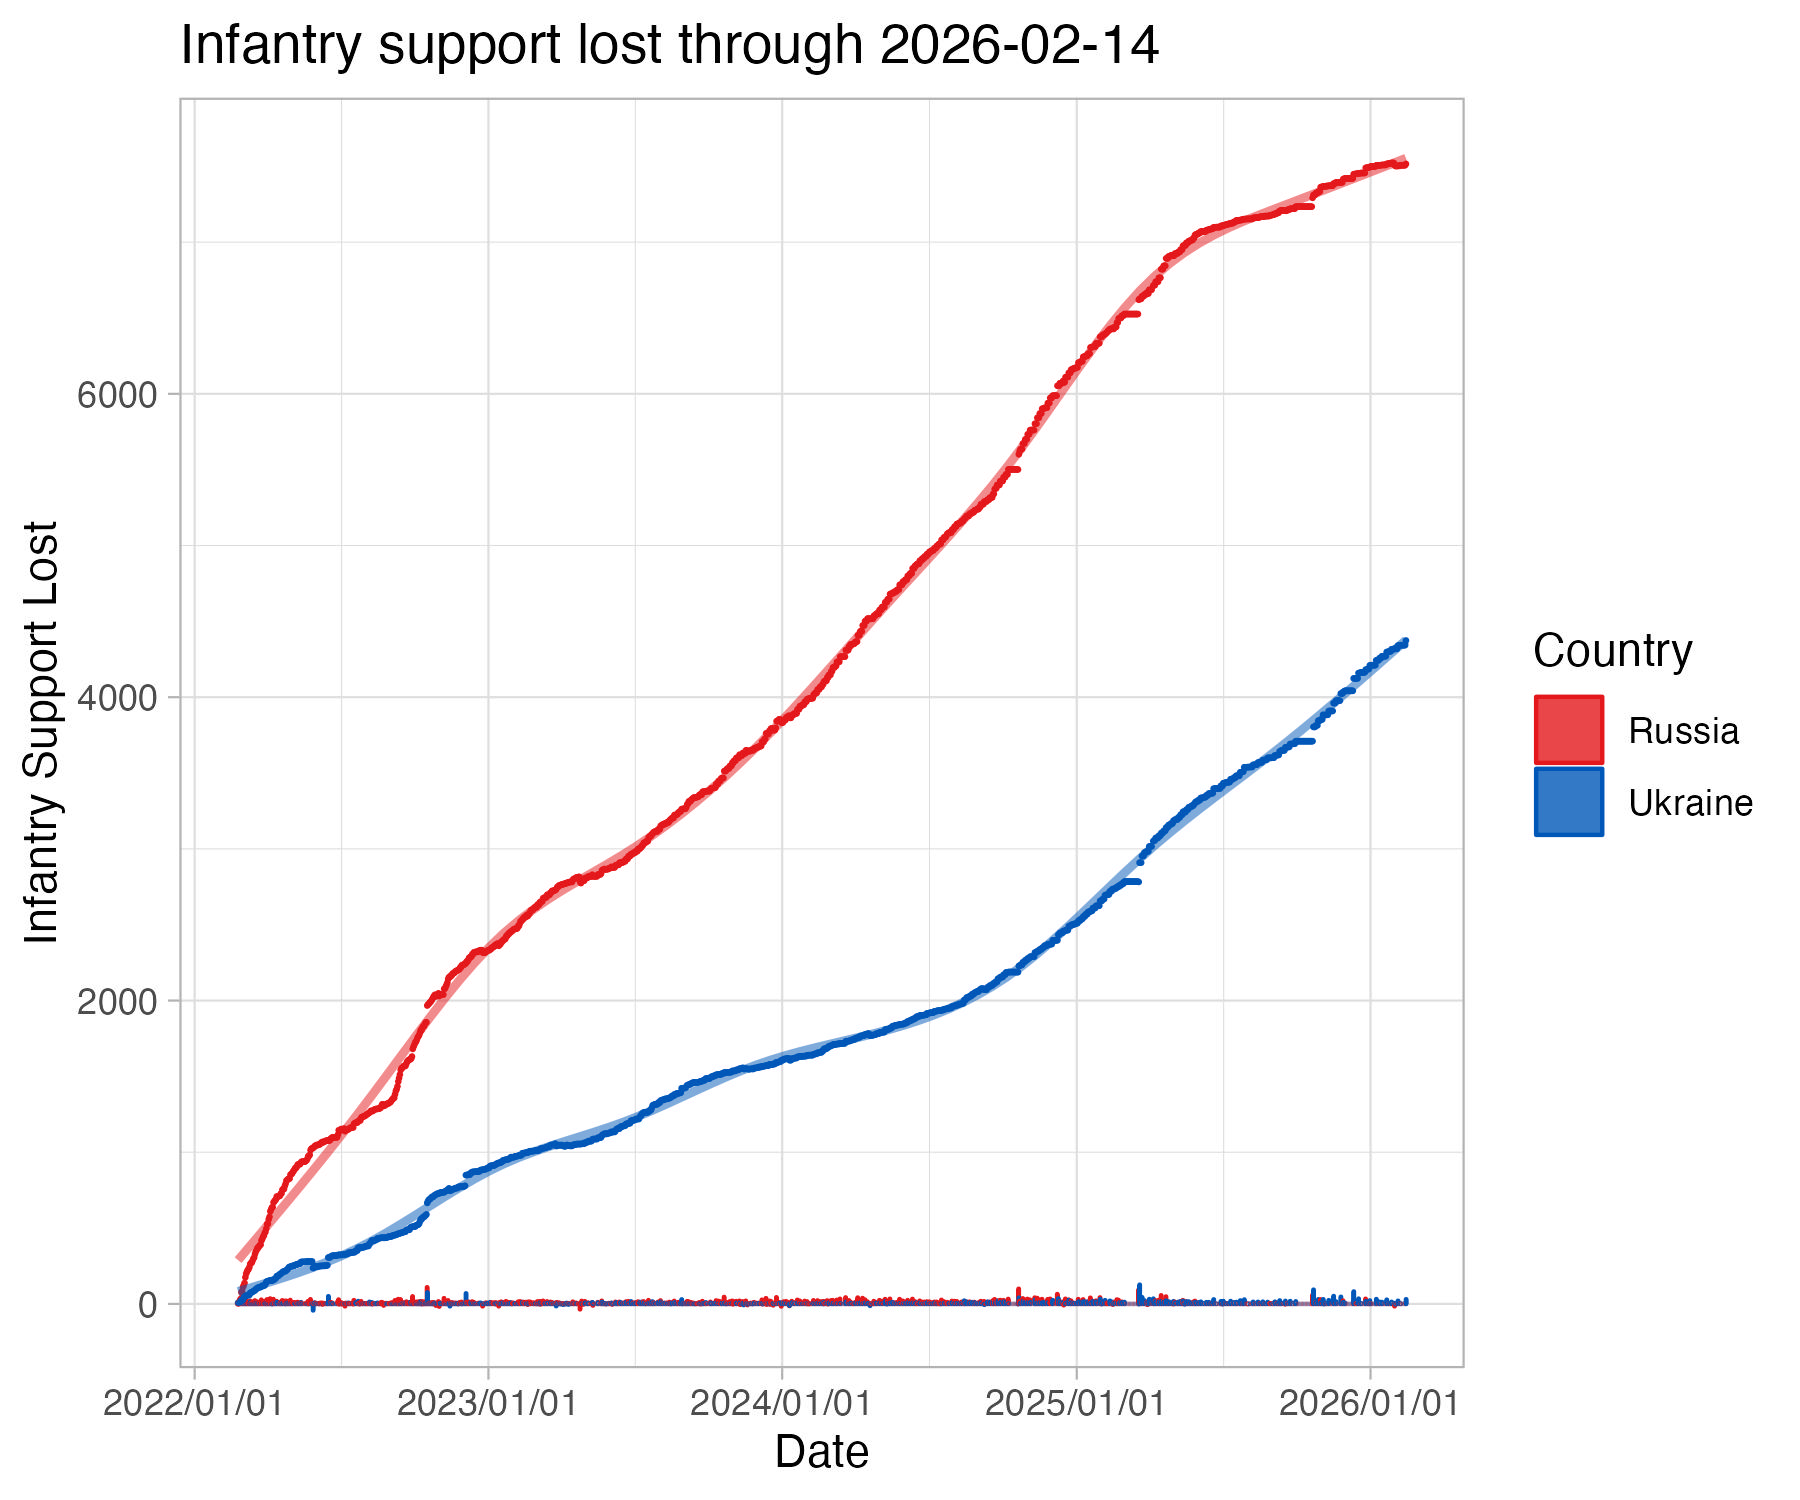 Infantry losses were higher among Ukranians at the start of the war, with Russian losses increasing sharply since then. Ukranian losses taper in the second week. This calculation includes infantry fighting vehicles, armored personell carriers, and infantry mobility vehicles.
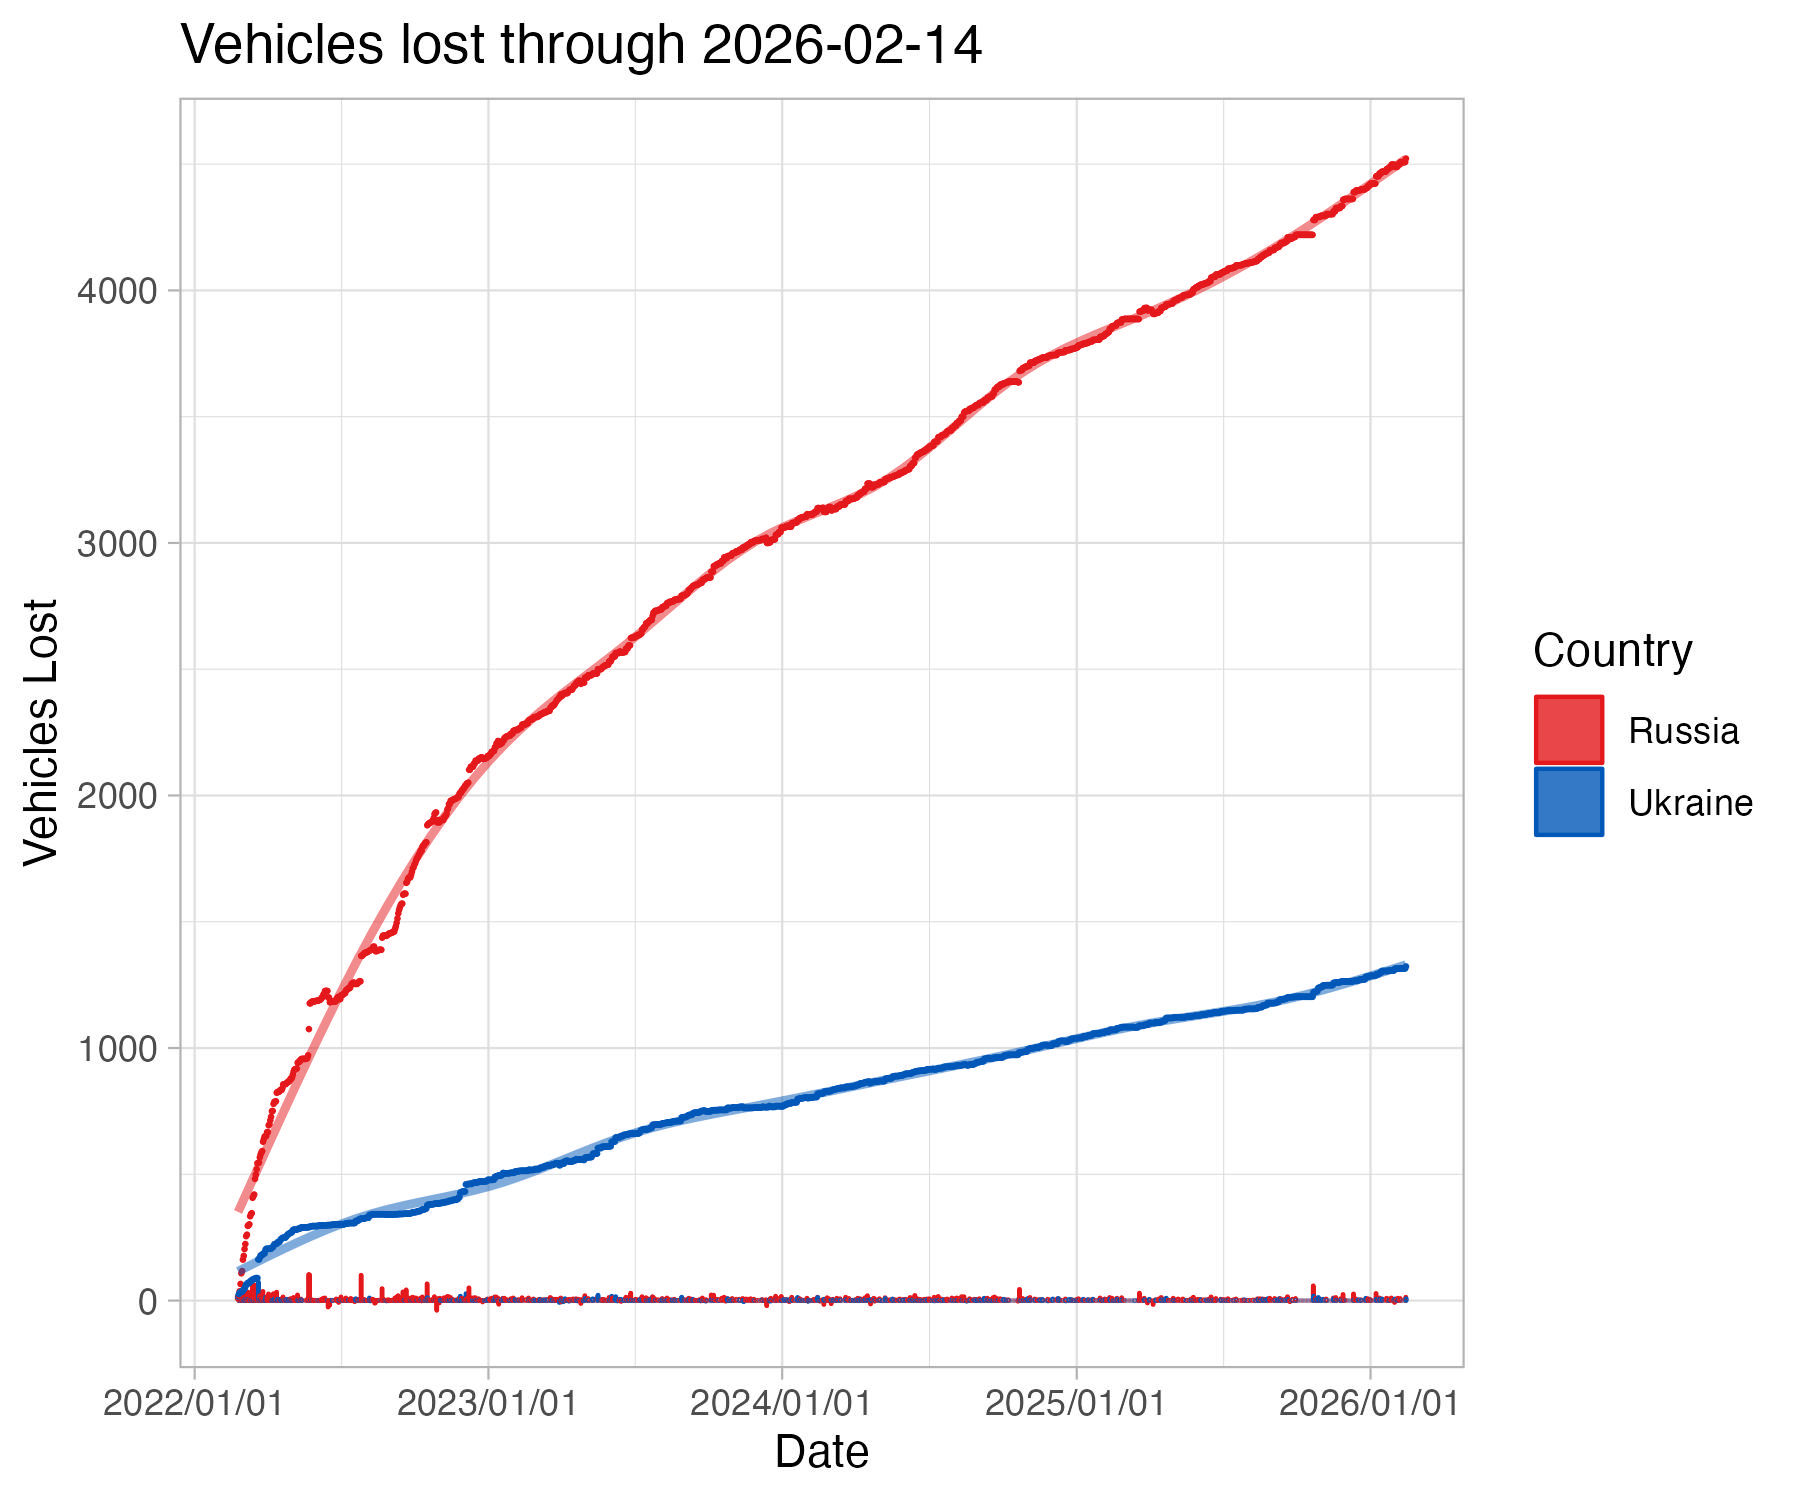 Ukranians lost more vehicles on the first day, with Russian losses accelerating since then. This calculation includes all non-specialized vehicle types.
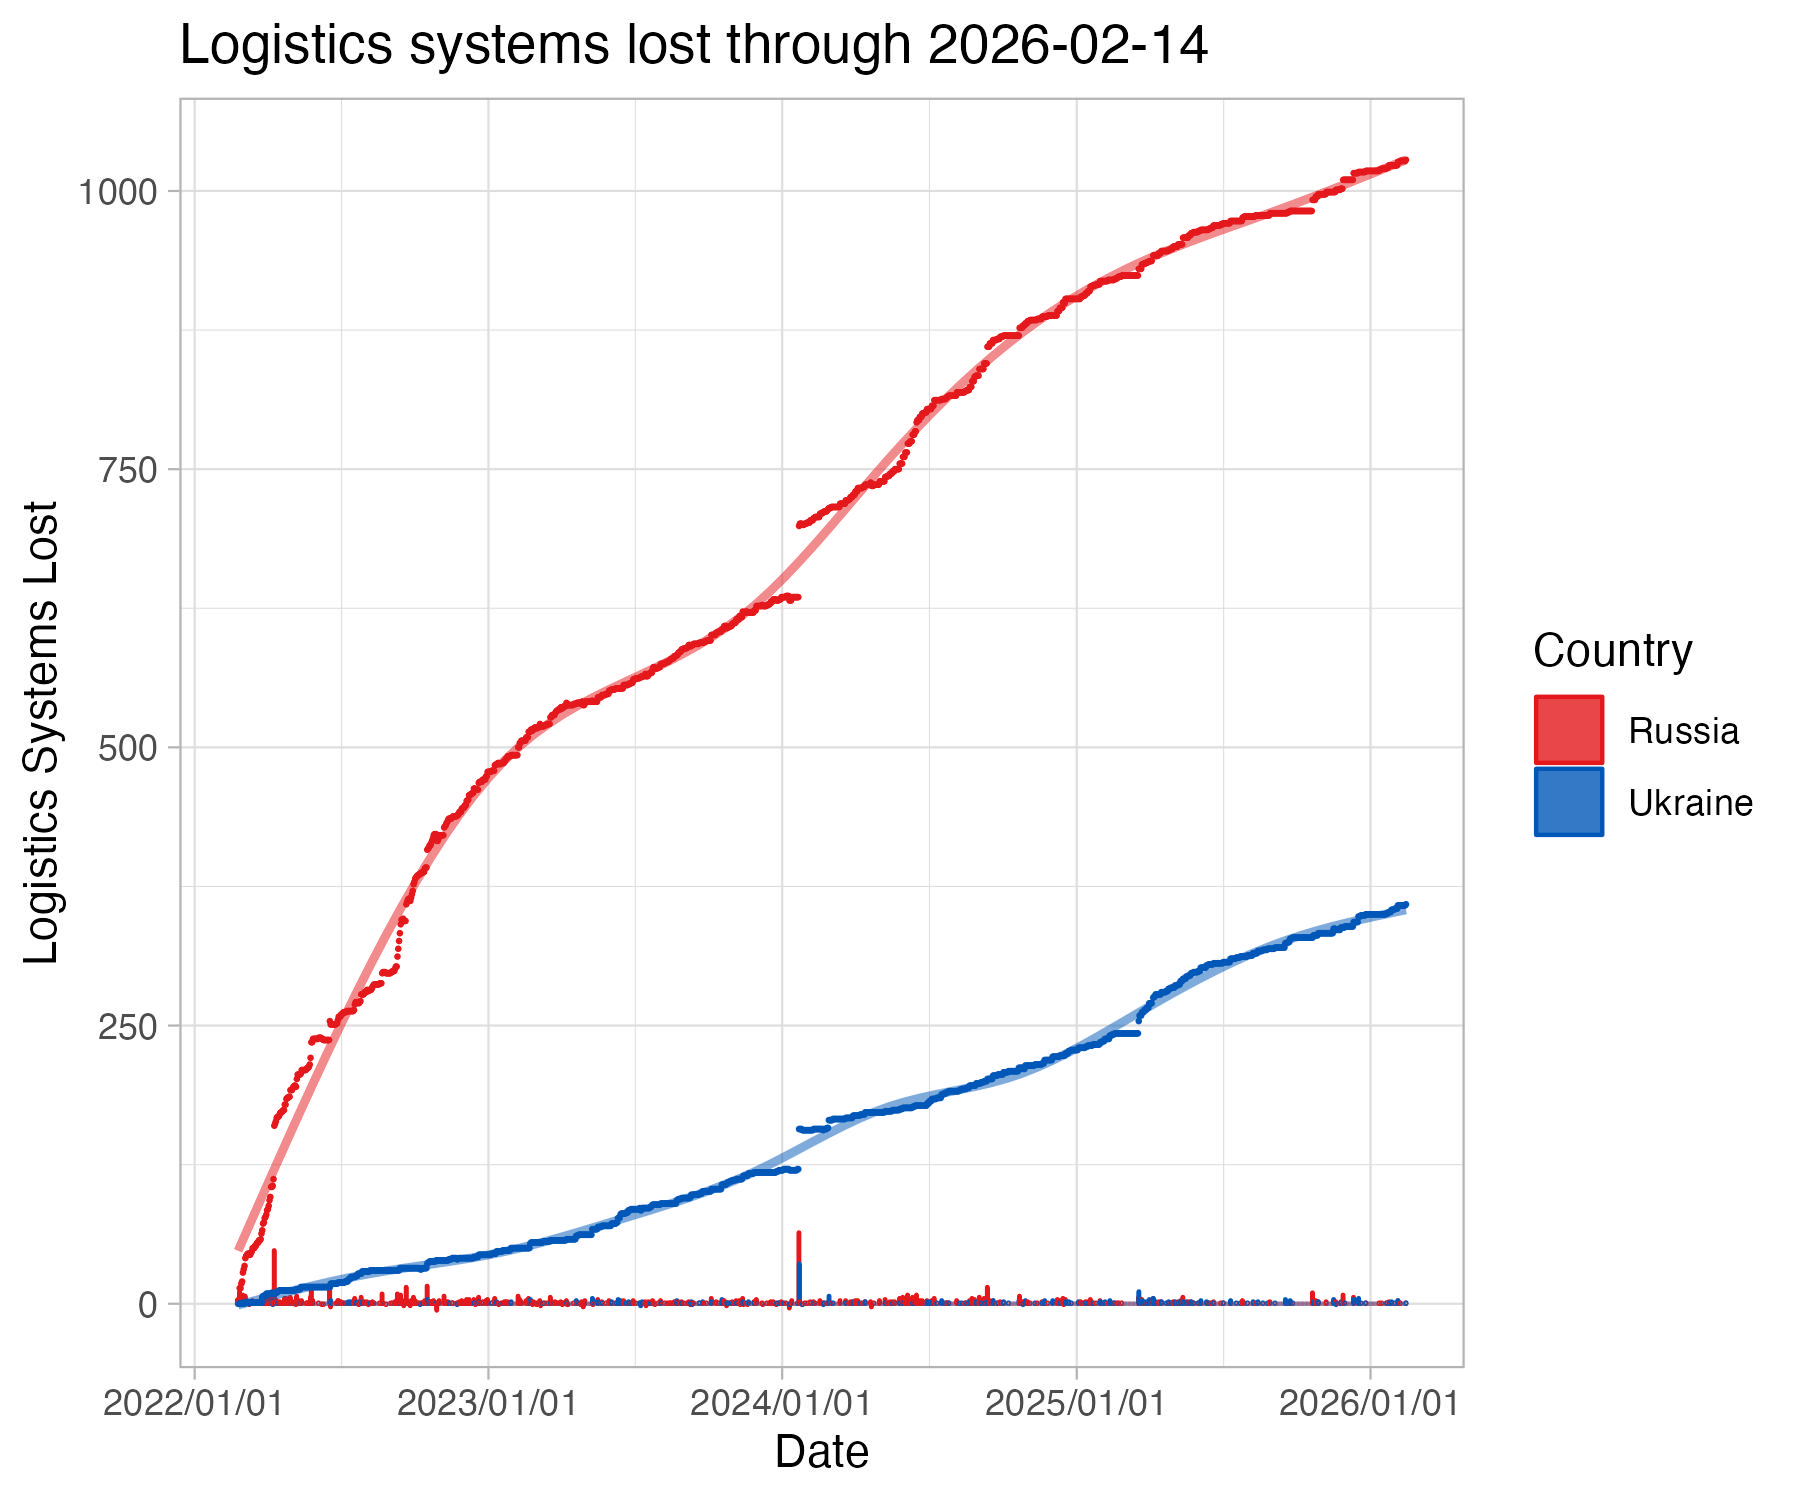 Ukranians have lost few logistics systems, while Russian losses increased linearly until the end of the second when they began to taper. This calculation includes engineering and communications vehicles.
#Analysis By grouping synthetic vehicles, we can see how different systems have been prioritized by Russian or Ukranians, providing a glimpse into strategy.
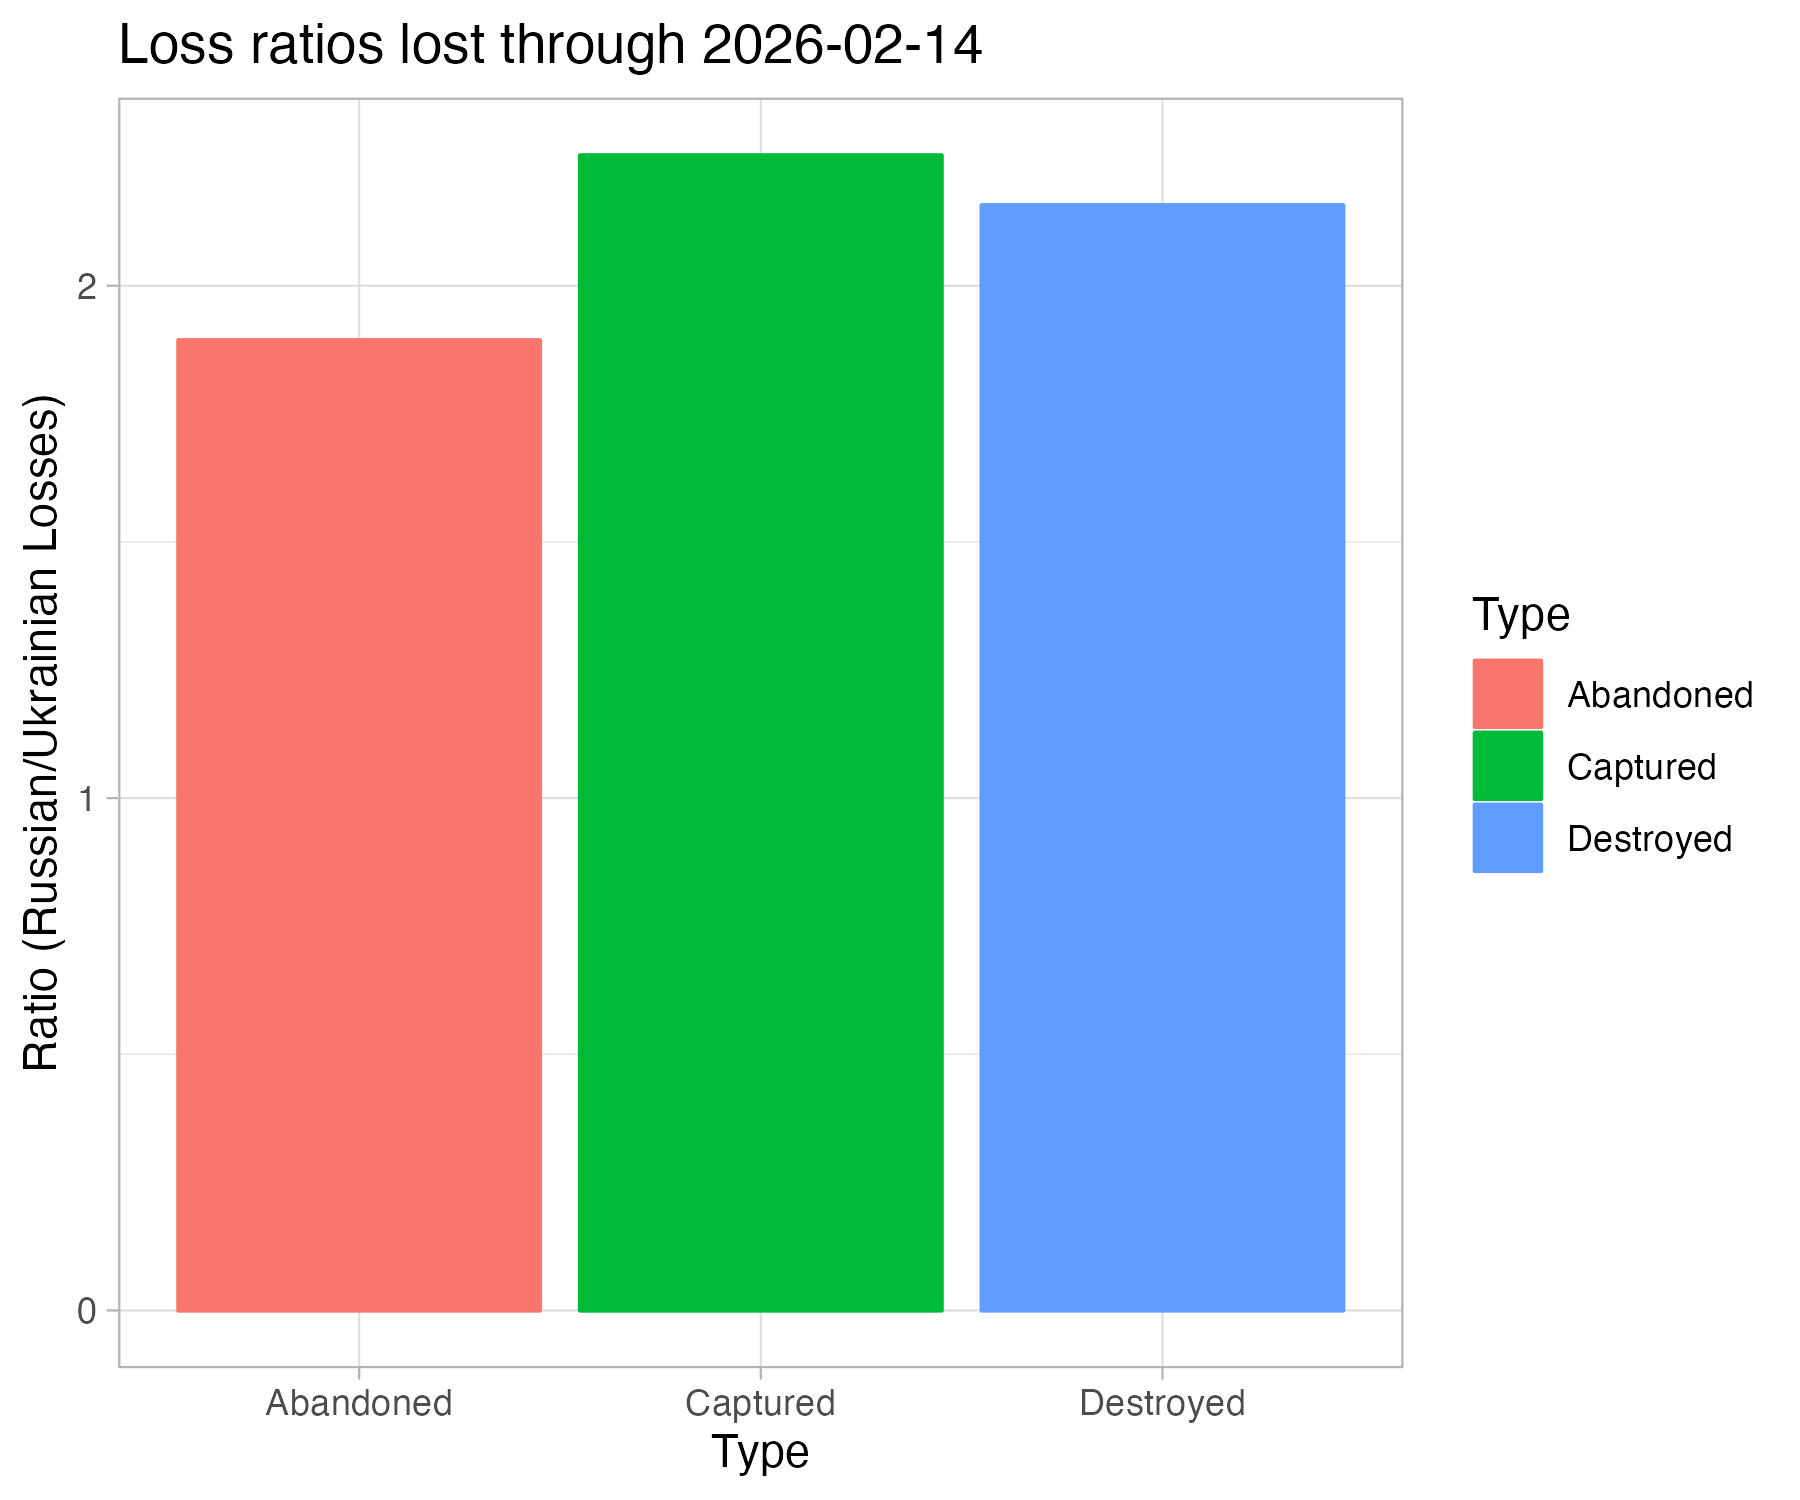 These ratio plots use Russian equipment losses as the numerator and Ukranian losses as the denominator. The higher the bar, the higher the proportion of Russian losses. While Russians have abandoned vehicles at a higher rate, destructions remain the highest differential between the two armies.
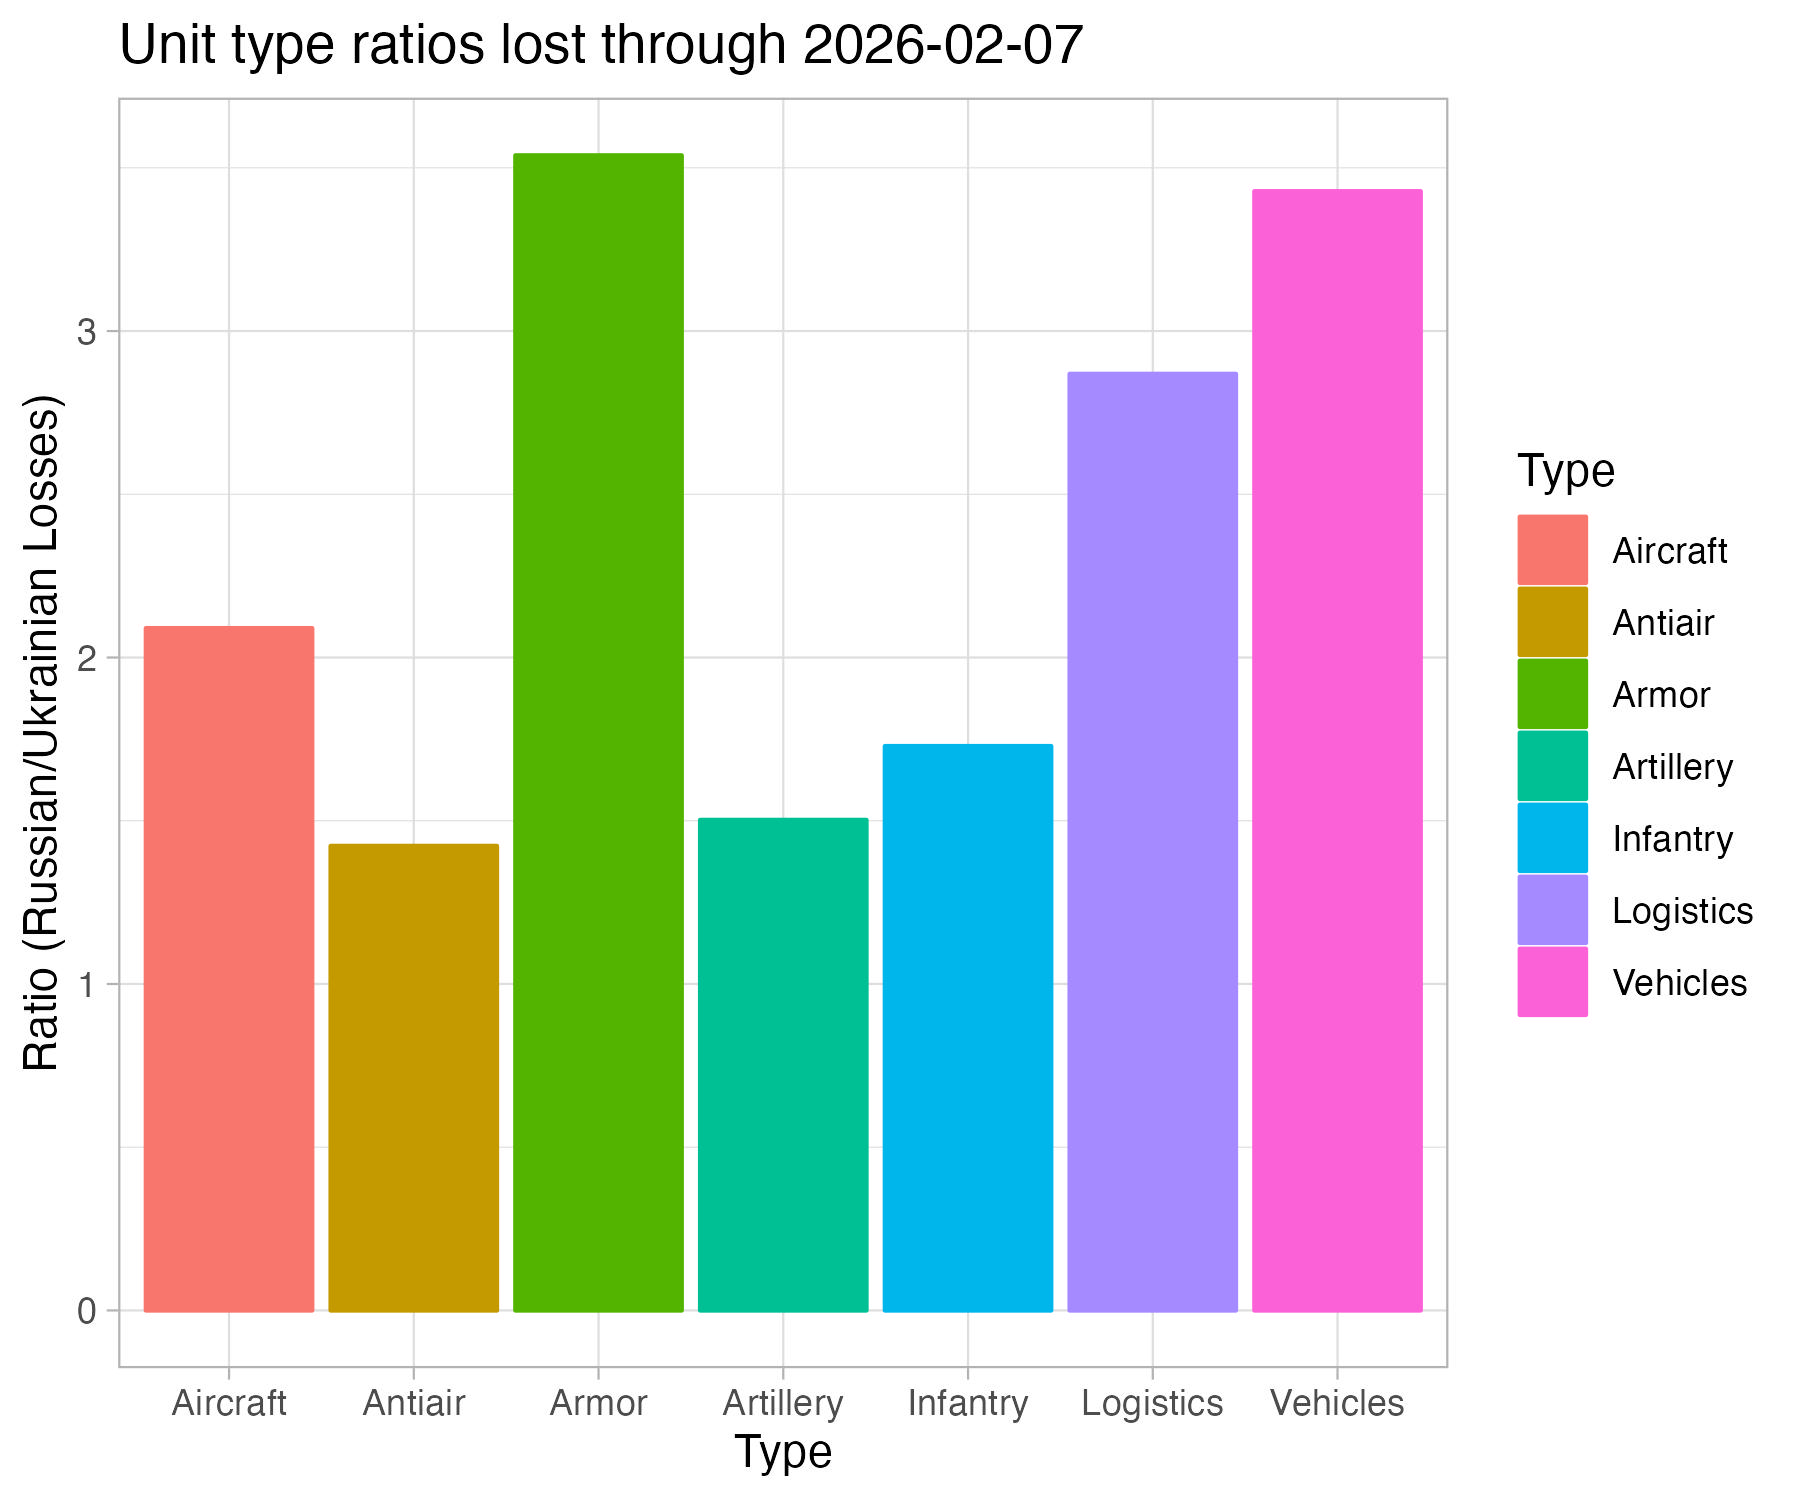 Here, Ukranian strategy is abundantly clear. It has targeted Russian logistics operations (higher bar = more Russian losses) to an overwhelming degree. Russians have focused on anti-air systems (lower bar = more Ukranian losses), though remarkably despite this focus Ukranian's still have an almost 2-1 edge on taking these systems out.
I am not a military expert, but by the second week of the war it is clear that the Russian objective of suppressing Ukranian aircraft and anti-air failed, leading to contested airspace. In contrast, Ukranian's succeeded in interfering with Russian logistics, evidenced by their focus on logistics vehicles and fuel lines. This has ground the Russian advance to a halt by the third day, with limited change since then.