Create a highly customizable panel using Vue.js.
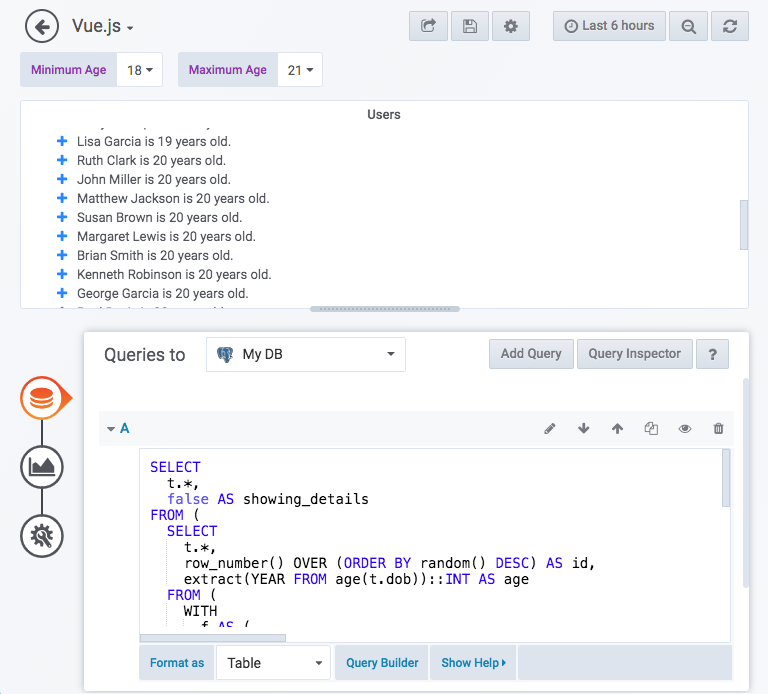
The following is an example query that I ran to create example output:
SELECT
  t.*,
  false AS showing_details
FROM (
  SELECT
    t.*,
    row_number() OVER (ORDER BY random() DESC) AS id,
    extract(YEAR FROM age(t.dob))::INT AS age
  FROM (
    WITH
      f AS (
        SELECT
          unnest(ARRAY['James','John','Robert','Michael','William','David','Richard','Charles','Joseph','Thomas','Christopher','Daniel','Paul','Mark','Donald','George','Kenneth','Steven','Edward','Brian','Ronald','Anthony','Kevin','Jason','Matthew']) AS first_name,
          'Male' AS gender
        UNION
        SELECT
          unnest(ARRAY['Mary','Patricia','Linda','Barbara','Elizabeth','Jennifer','Maria','Susan','Margaret','Dorothy','Lisa','Nancy','Karen','Betty','Helen','Sandra','Donna','Carol','Ruth','Sharon','Michelle','Laura','Sarah','Kimberly','Deborah']) AS first_name,
          'Female' AS gender
      ),
      l AS (
        SELECT
          unnest(ARRAY['Smith','Johnson','Williams','Jones','Brown','Davis','Miller','Wilson','Moore','Taylor','Anderson','Thomas','Jackson','White','Harris','Martin','Thompson','Garcia','Martinez','Robinson','Clark','Rodriguez','Lewis','Lee','Walker']) AS last_name
      )
    SELECT
      first_name,
      last_name,
      gender,
      CURRENT_DATE - (366 * (random() * 48 + 18))::INT AS dob
    FROM f, l
  ) AS t
) AS t
WHERE t.age BETWEEN $min_age AND $max_age
ORDER BY t.dob DESC;
The above query basically pulls a table of 1250 random people with first names (first_name), last names (last_name), birth dates (dob and age) and IDs (id).
The following is the example HTML code that I used to get an quick dynamic example working:
<h1>There are {{ dataset[0].rows.length }} people with the specified criteria!</h1>
<ul>
  <li v-for="person in dataset[0].rows" v-bind:class="person.showing_details ? 'show-details' : 'hide-details'">
    <div>
      <a class="detail-toggler" v-on:click="person.showing_details = !person.showing_details">
        <i class="fa fa-plus"></i>
      </a>
      {{ person.first_name }} {{ person.last_name }} is {{ person.age }} years old.
    </div>
    <div class="div-table">
      <table>
        <thead>
          <tr>
            <th>Field</th>
            <th>Value</th>
          </tr>
        </thead>
        <tbody>
          <tr v-for="key in Object.keys(person)" v-if="key != 'showing_details'">
            <th>{{ key }}</th>
            <td>{{ person[key] }}</td>
          </tr>
        </tbody>
      </table>
    </div>
  </li>
</ul>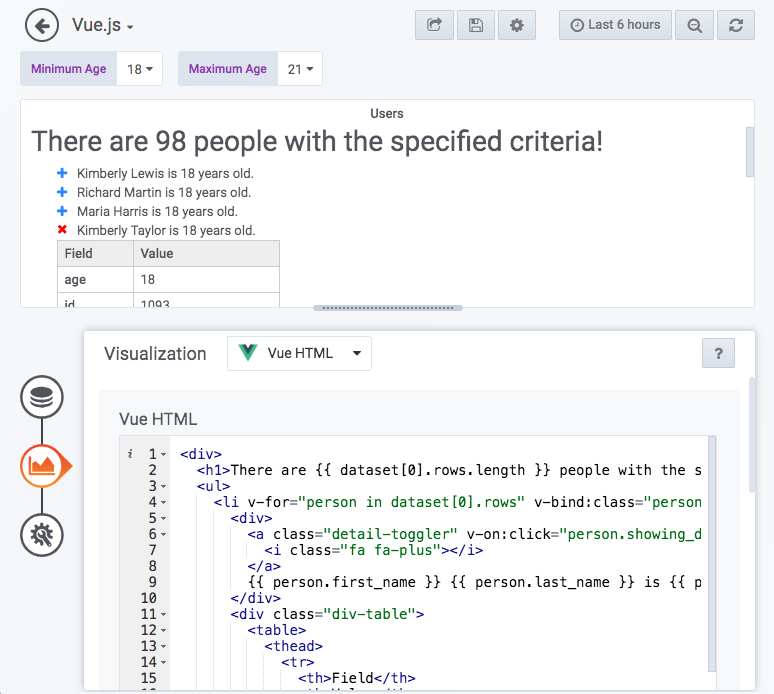
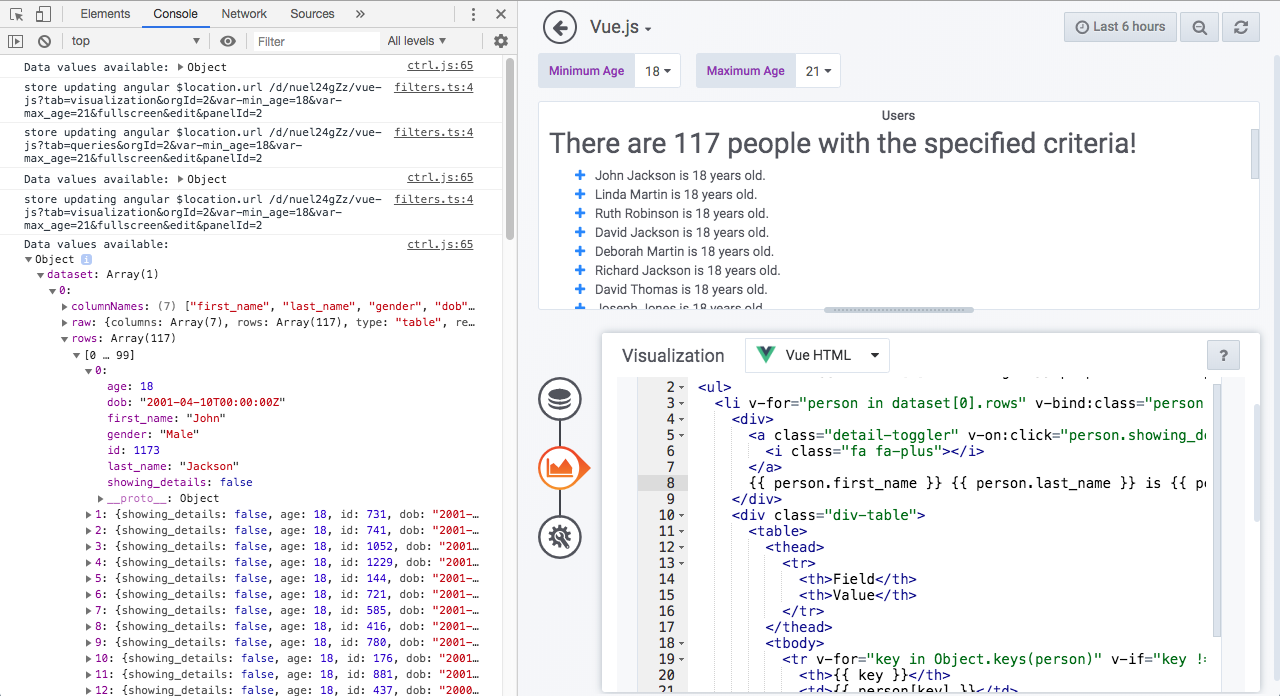
It is important to mention that besides the query inspector natively available in the UI of Grafana you can also view the values available to you in the JS console to determine what you can access in your Vue.js HTML:
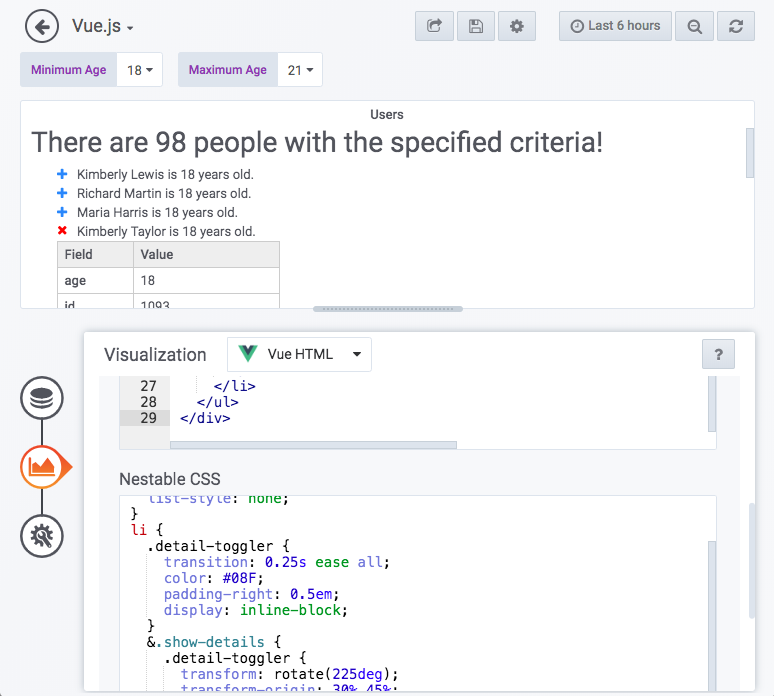
I used the following nestable CSS to get an example working:
& {
  overflow: auto;
}
ul {
  margin-left: 2em;
  list-style: none;
}
li {
  .detail-toggler {
    transition: 0.25s ease all;
    color: #08F;
    padding-right: 0.5em;
    display: inline-block;
  }
  &.show-details {
    .detail-toggler {
      transform: rotate(225deg);
      transform-origin: 30% 45%;
      color: #F00;
    }
    table {
      display: table;
    }
  }
  &.hide-details table {
    display: none;
  }
}
table {
  thead th {
    background-color: #EEE;
  }
  th, td {
    border: 1px solid #CCC;
    padding: 0.25em 0.5em;
  }
}
a:link {
  text-decoration: underline;
}
a:hover {
  text-decoration: none;
}
After defining the query, HTML and CSS and mentioned above I got the following result:
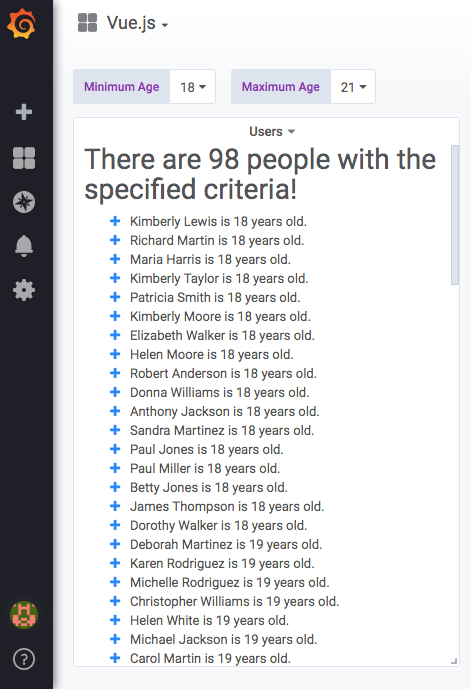
What's really cool about using Vue.js is that you can make your content pretty dynamic. For instance when I click on the blue plus sign next to a name the following happens:
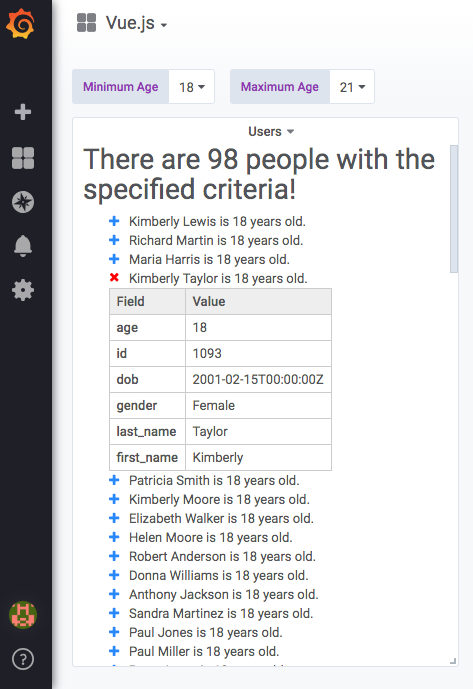
A table containing all of the values of the person's row (with the exception of an extra field that I am using to control the toggle state (showing_details).
MIT
This plugin leverages the grafana-toolkit to simplify building and packaging a plugin.
Change to a compatible version of NodeJS:
nvm use 12Install module dependencies:
yarnBuild plugin in production mode:
yarn buildBuild plugin in development mode:
yarn devBuild plugin in development mode, watching for changes:
yarn watch