Andrew Weng
A collection of source code, data, and analysis notebooks for studying the impact of fast formation protocols on battery lifetime.
Most of the code is written in Python (3.8.8). To set up your programming environment, first create a virtual environment (e.g. using pyenv). Inside your virtual environment, install the necessary packages using
pip install -r requirements.txt
The raw battery data is not stored in this repo. Download a copy of the data here.
To tell the source code where you are keeping your raw data files, modify paths.yaml to point to your local paths. For example:
 data: '/Users/aweng/code/fast-formation/data/'
 outputs: '/Users/aweng/code/fast-formation/output/'
 documents: '/Users/aweng/code/fast-formation/documents/'
Start in the root directory of the repository.
Run pytest to make sure that tests are passing.
python -m pytest
This will make sure that your paths and environment are set up correctly.
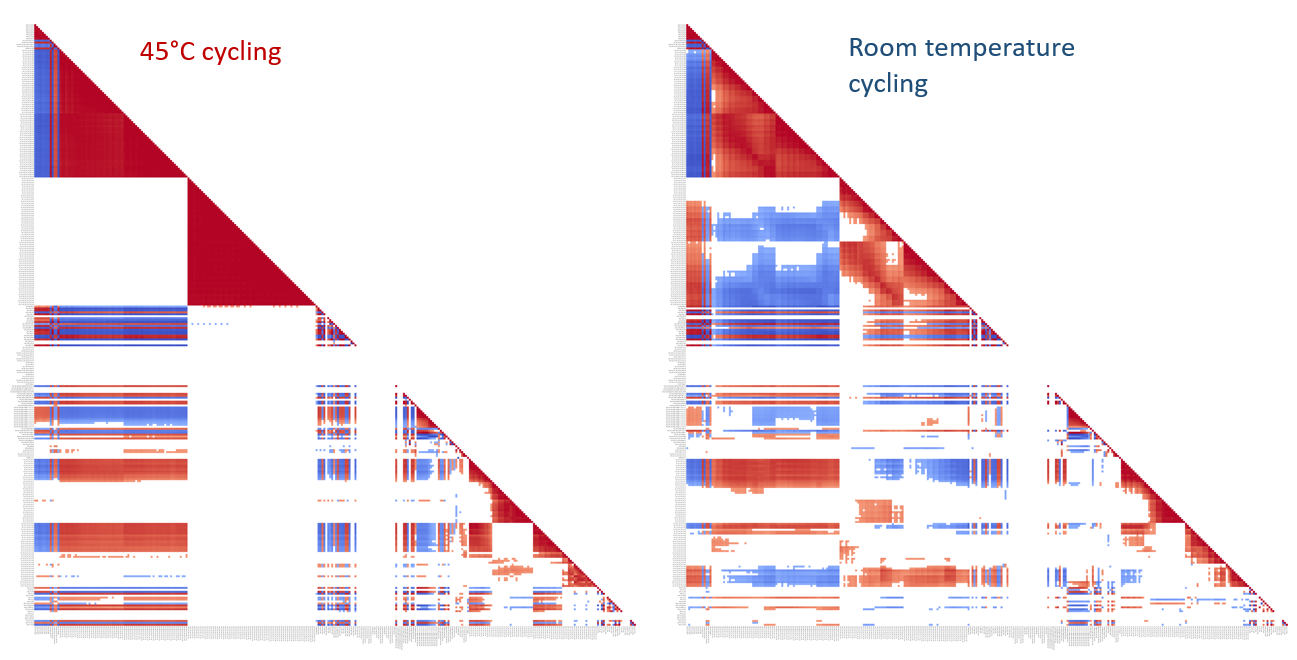
The data behind the correlation matrix can be generated by running the following commands:
python

>>> from src.utils import build_correlation_table
>>> build_correlation_table()
export_correlation_table() returns a large .csv file containing the data for the correlations table. The table is generated in the following way:
- Using
formation.pyto interface with the raw test data and extract features from both beginning-of-life and over age. - Read in data from
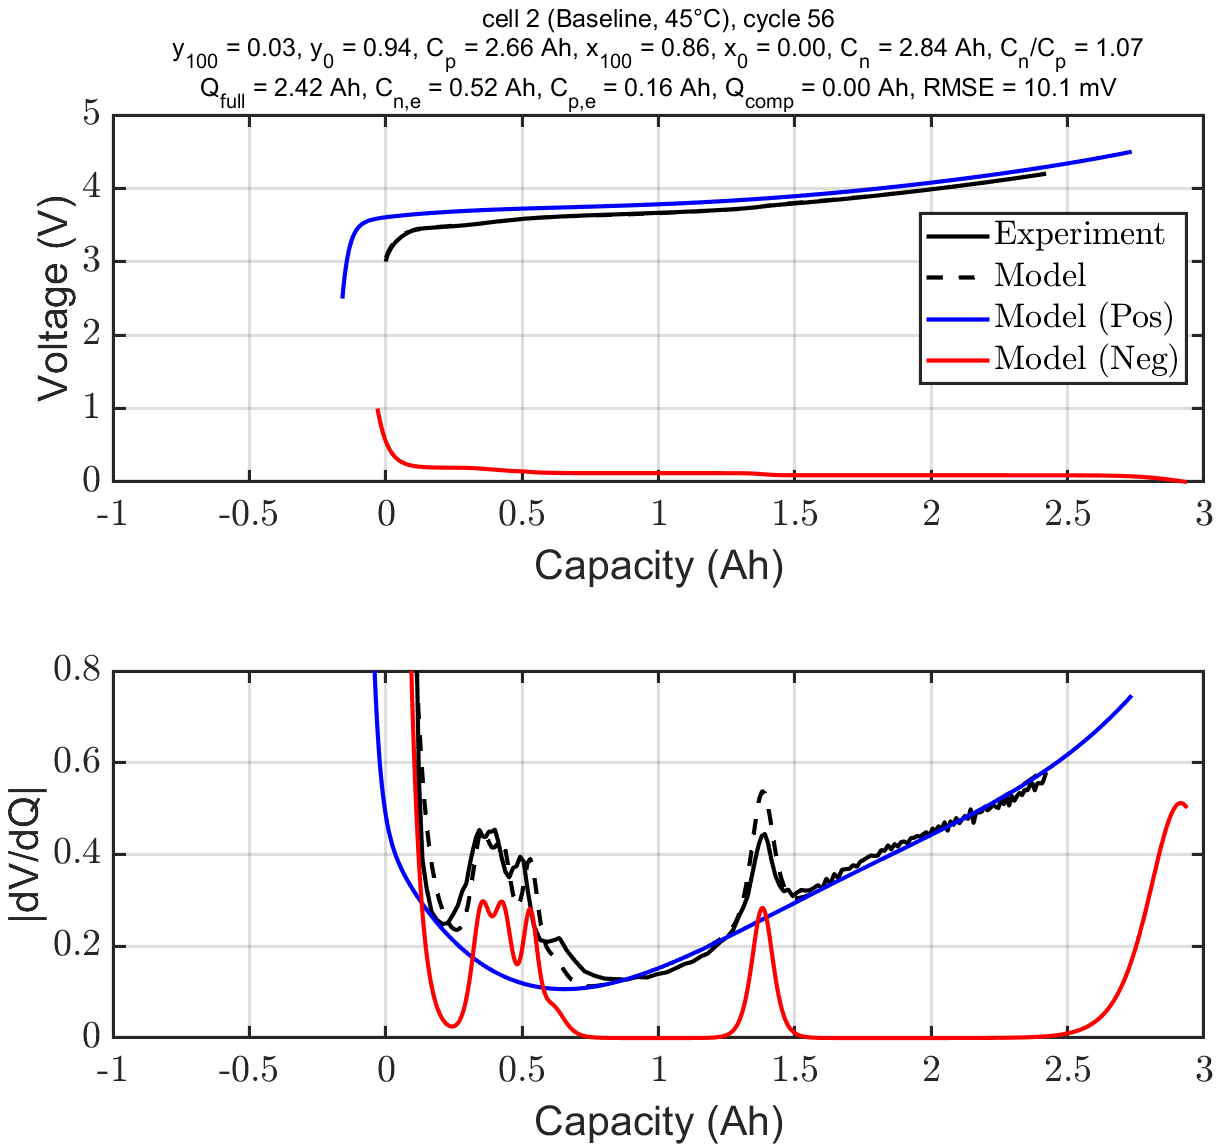
summary_esoh_table.csv, which is an output from the MATLAB tools used to run the voltage fitting algorithm to extract electrode-specific state of health (eSOH) metrics such as electrode capacities and lithium loss rates. - Concatenate the results from (1) and (2) into a final .csv file.
The output file will be dumped in the specified output directory, e.g
output/correlations_data.csv.
A cached copy of the output file is available as part of the dataset, e.g. output/correlations_data.csv. This version will not contain the latest updates to the source code.
To get started with the voltage fitting analysis, start with matlab/process_voltage_curves.m. This function will return a .csv file containing electrode-specific state of health (eSOH) metrics, e.g. (summary_esoh_table.csv)
Start a Jupyter Lab session using:
jupyter lab
MATLAB R2020a was used to run the electrode-specific state of health (eSOH)
algorithm used to generate outputs for the electrode stoichiometry model. The
source code is available under the /matlab/ directory.
The main function to run is process_voltage_curves.m. This function will read
in the relevant input files from the formation tests and return diagnostic
signals.
The paths for the MATLAB executables assume the current folder is the base
directory of the repository and that the data and output folders are one level
above this directory. Before running the code, add the /matlab/ directory
into the path using addpath matlab. Do not run the code from the /matlab/ folder.
RStudio is used to run the test for the differences in the coefficients of variation.

