This repository includes codes and data example used in the 'Integrative Spatial Analysis Reveals Tumor Heterogeneity and Immune Colony Niche Related to Clinical-outcomes in Small Cell Lung Cancer' paper.
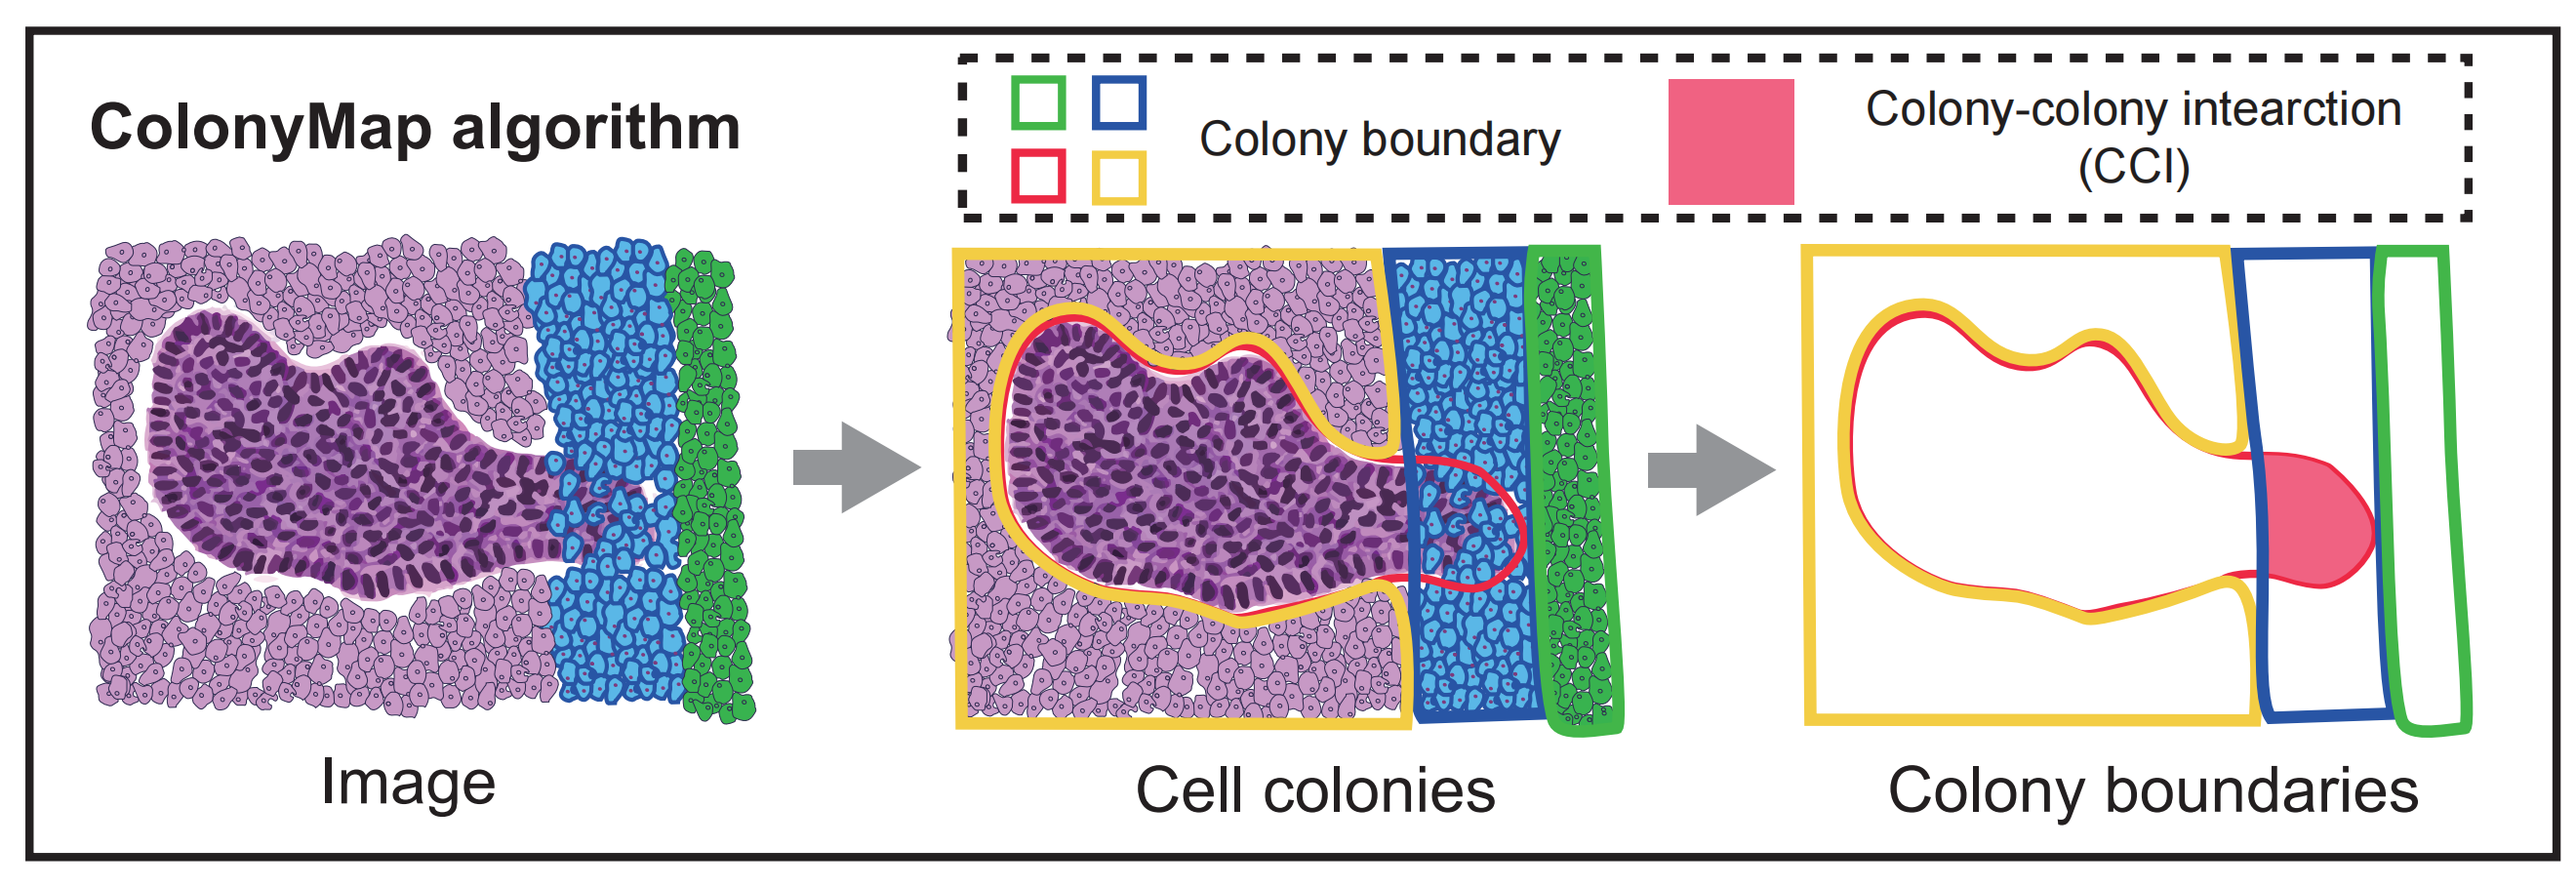
Structured cell colonies (CC) and dispersed cells within tissues exhibit distinctly different physiological functions. In situ CCs, coordinated with homogeneous cells, have proven to be invaluable for histopathological detection and diagnosis. Cell neighborhood method clustering cell composition to cell pattern (CN) by traversal small regional tissue. In contrast, the colony perspective excels at pinpointing intercellular boundary and interactions regions. To analyze cell colonies in CODEX data, we developed ColonyMap, a spatial cell colony analysis algorithm.
●Python (version 3.8.17)
-
opencv package(version 4.5.1.48)
-
numpy package(version 1.24.3)
-
matplotlib package(version 3.7.1)
-
pickle package(version 4.0)
●R (version version 4.3.1)
- spatstat (version 3.0_6)
☞ More details in requirements.txt
To run this analysis pipline, you need to first create a python virtual environment (Python : 3.8.17 & R : 4.3.1) where you can install all the required packages. If you are using the conda platform to create your virtual environment. These are the steps you need to follow.
All operations are completed in your terminal.
First, let us create the virtual environment with all packages:
conda create -n [virtual_environment_name] --file requirements.txt
Next, you need to activate the virtual environment:
conda activate [virtual_environment_name]
Once you have the [virtual_environment_name] ready, you can run all scripts!
●Colony_recognition.py is used to identify the colony contours of all cell types in the image, which is the cornerstone of subsequent analysis. So you need to run it first.
cd [your_path]/script
and then
python Colony_recognition.py "../data"
It takes approximately 20 seconds to identify the contours of all cell types on an image of approximately 40000 cells. (Computing machine: Macbook Air M1 core)
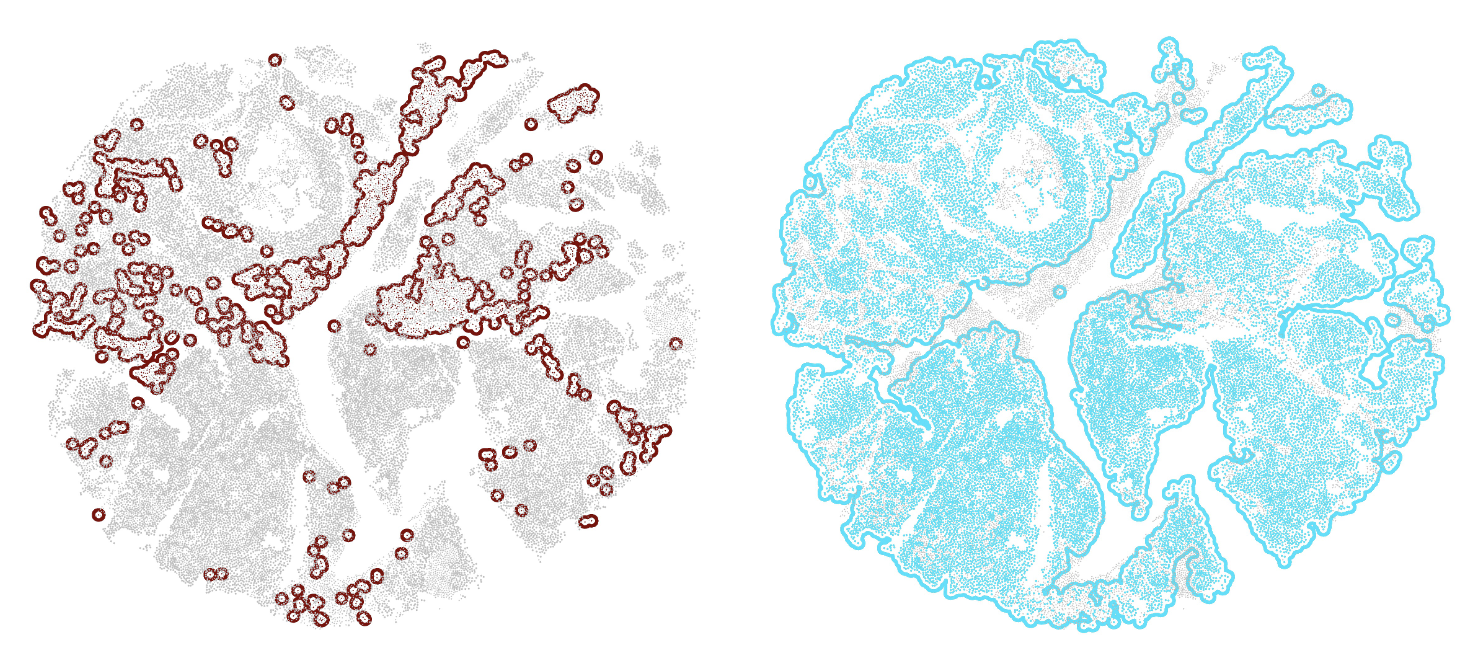
●Colony_show.py is used to display the spatial distribution of cellt colonies , such as macrophage colonies.
cd [your_path]/script
and then
python Colony_macrophage_show.py "../data"
It takes only 1 second to visualize the macrophage colonies on an image. (Computing machine: Macbook Air M1 core)
Fig2 : Macrophage colonies (left) & SCLA-A cancer cell colonies (right)
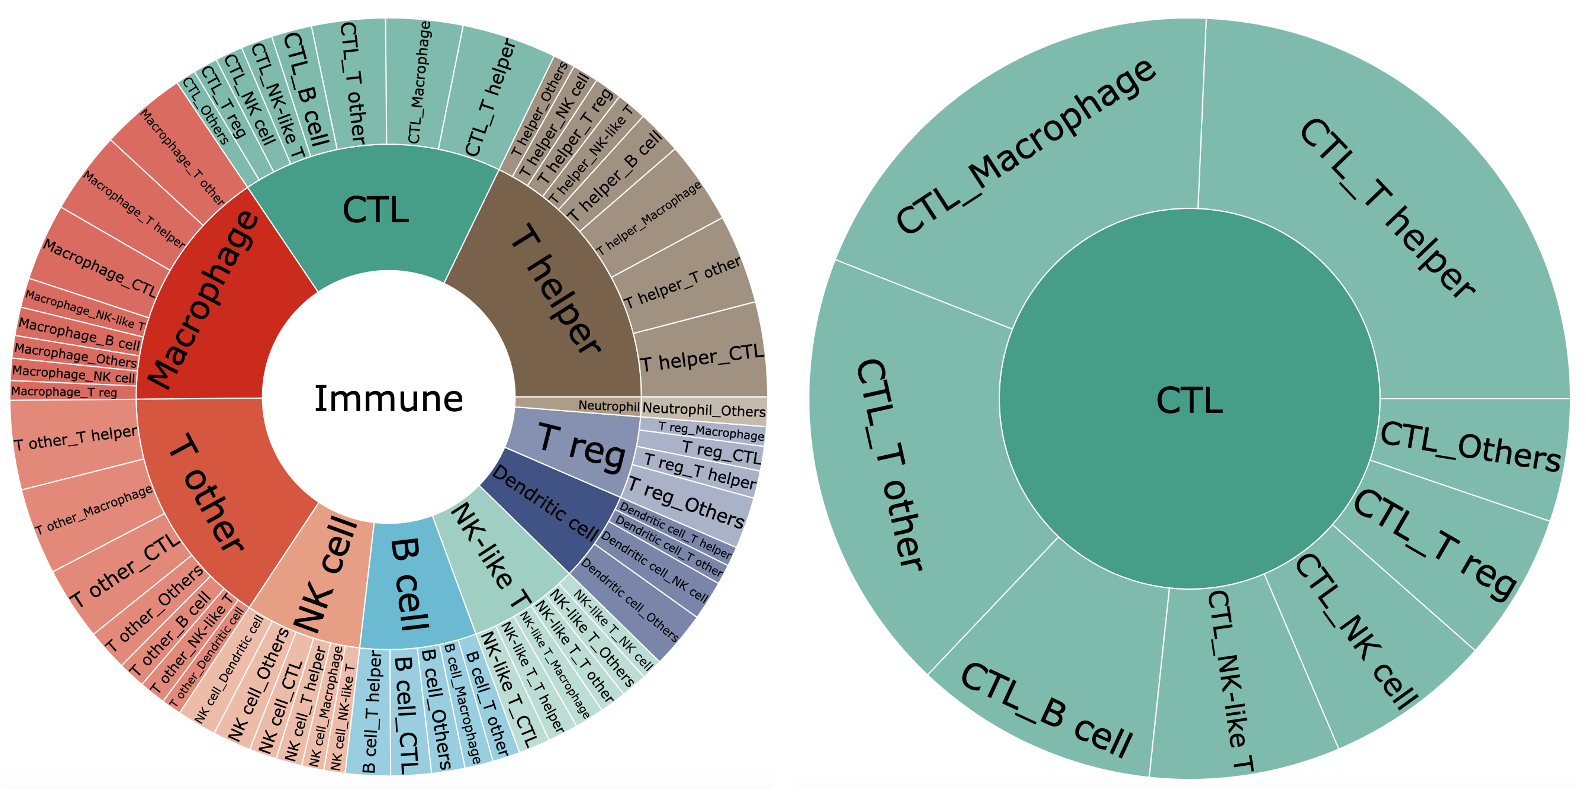
●Subburst_Chart.R is used to visualize the strength of interactions between different cell colonies.
Rscript Subburst_Chart.R
Fig3 : The interaction intensity in different immune celltypes
☞ You can scan this file for dynamic click interaction Subburst_Chart.html
-
Software:[qupath v0.3.2](Bankhead, P. et al. QuPath: Open source software for digital pathology image analysis. Scientific Reports (2017),https://doi.org/10.1038/s41598-017-17204-5.)
-
Methods:
-
Before initiating data analysis, quality control was performed on each individual image by visual assessment across the whole slide; each marker was qualitatively evaluated based on signal intensity compared with the background and for staining specificity. Other artifacts such as out-of-focus regions, tissue folding, and debris were manually annotated and excluded from the analysis.
-
Organize the segmentation usingPixel classification — QuPath 0.5.1 documentation. First, multiple small regions belonging to the tumor, mesenchymal, and necrotic categories are annotated, and the correct tissue classification is judged by experts. If there is an error in the result, add a category annotation to improve the accuracy until the HE result is met.
-
-
Software:[qupath v0.3.2](Bankhead, P. et al. QuPath: Open source software for digital pathology image analysis. Scientific Reports (2017),https://doi.org/10.1038/s41598-017-17204-5.),[StarDist v0.3.2](Uwe Schmidt, Martin Weigert, Coleman Broaddus, and Gene Myers. Cell Detection with Star-convex Polygons. International Conference on Medical Image Computing and Computer-Assisted Intervention (MICCAI), Granada, Spain, September 2018.)
-
Methods:Nuclear segmentation was first performed using the deep learning method StarDist, utilizing its default parameters, and applying the [2D_dsb2018 model to the DAPI image](Schmidt U, Weigert M, Broaddus C, et al. Cell detection with star-convex polygons. In: Medical Image Computing and Computer AssistedIntervention—MICCAI 2018. (Frangi AF, Schnabel JA, Davatzikos C, et al.eds.) Lecture Notes in Computer Science Springer International Publishing:Cham; 2018; pp. 265–273; doi: 10.1007/978-3-030-00934-2_30).To align with the training set’s image resolution and enhance image contrast for prediction, preprocessing steps were implemented, which included reducing the image size by 50% and applying Contrast Limited Adaptive Histogram Equalization.The cytoplasmic segmentation was established by expanding the nuclei through a morphological dilation of 5 μm, which was applied to the labeled nuclear mask. The centroid of each cell was subsequently determined using the x-y coordinates of the nuclear object’s centroid within the image. A comprehensive qualitative assessment of the segmentation was carried out for each individual slide, and it yielded consistently satisfactory results, affirming the robustness and reliability of the segmentation process.
-
Software:[qupath v0.3.2](Bankhead, P. et al. QuPath: Open source software for digital pathology image analysis. Scientific Reports (2017),https://doi.org/10.1038/s41598-017-17204-5.)
-
Methods: After cell segmentation, calculate the average fluorescence intensity of each marker in each cell based on the mask segmentation mask and fluorescence image. Reference [qupath machine learning process](Multiplexed analysis — QuPath 0.5.1 documentation). Based on the co expression and hierarchical relationship between markers, multiple classifiers are established, including
PanCK-CD68-CD3e-CD20、ASCL1、NEUROD1、POU2F3、YAP1、CD4-CD8-CD15-CD31、CD56、CD11c、Foxp3. After the model is applied, it is confirmed by experts for a second time. If there are false positives or false negatives, the accuracy of cell typing can be improved by increasing the training dataset and setting a threshold (gating) method. For functional markers, set thresholds to determine their expression based on their expression status.
-
Software: [imcRtools 1.8.0](Windhager, J., Zanotelli, V.R.T., Schulz, D. et al. An end-to-end workflow for multiplexed image processing and analysis. Nat Protoc (2023). https://doi.org/10.1038/s41596-023-00881-0)
-
Principle: Define each cell and its surrounding neighbors through the Euclidean distance between X/Y coordinates. The increase or decrease in interactions between cell types is compared using random tissues matched with each image, and the permutation test method of Monte Carlo sampling is used to test whether interactions are significantly enriched or decreased.
-
Code: You can scan this script for more details Cell-cell_Pairwise_Interaction_Analysis.R
-
Software:python 3.11.5、[scikit-learn 1.3.0](Scikit-learn: Machine Learning in Python, Pedregosa et al., JMLR 12, pp. 2825-2830, 2011.)
-
Principle: Obtain a window consisting of 20 nearest neighboring cells using the Euclidean distance between X/Y coordinates, and then cluster the window using Python's scikit learn MiniBatchKMeans (k=20) function based on the composition of cell types. Then determine the cell neighborhood where each cell is located.
-
Reference: [Coordinated Cellular Neighborhoods Orchestrate Antitumoral Immunity at the Colorectal Cancer Invasive Front.](Schürch, C. M., Bhate, S. S., Barlow, G. L., Phillips, D. J., Noti, L., Zlobec, I., Chu, P., Black, S., Demeter, J., McIlwain, D. R., Kinoshita, S., Samusik, N., Goltsev, Y., & Nolan, G. P. (2020). Coordinated Cellular Neighborhoods Orchestrate Antitumoral Immunity at the Colorectal Cancer Invasive Front. Cell, 182(5), 1341–1359.e19. https://doi.org/10.1016/j.cell.2020.07.005)
-
Code: You can scan this script for more details Cellular_Neighborhood_ldentification.py
-
Software: [R 4.2.3](R Core Team (2023). R: A Language and Environment for Statistical Computing. R Foundation for Statistical Computing, Vienna, Austria. https://www.R-project.org/.)
-
Cell proportion correlation analysis
- Methods: Calculate the proportion of each cell type in each core separately, and then calculate the Spearman correlation coefficient according to the type of core.
- Code: You can scan this script for more details Statistical_Analysis.R
All data have been uploaded to the GSA (https://ngdc.cncb.ac.cn/gsa/) and Zenodo (https://zenodo.org/) and will be available for download upon acceptance for publication.
To be supplemented


