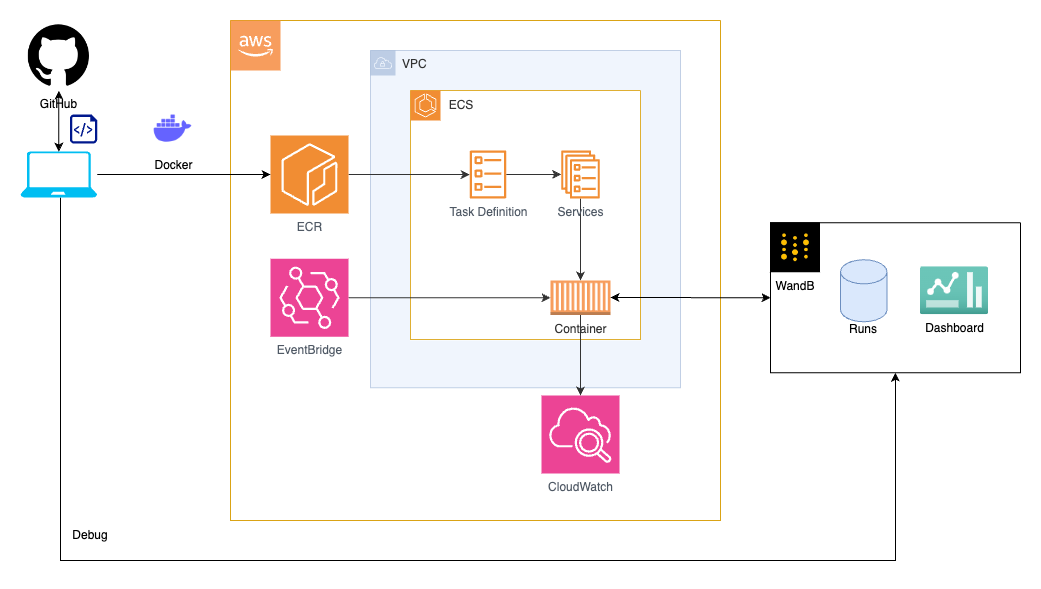
Extract gpu usage across the teams.
.
├── README.md
├── check-dashboard  # for monitoring cron
│   ├── Dockerfile
│   ├── check_dashboard.py
│   ├── config.yaml
│   └── requirements.txt
├── gpu-dashboard  # for cron
│   ├── Dockerfile
│   ├── GpuUsage.py
│   ├── blacklist
│   ├── blank_table.py
│   ├── config.py
│   ├── config.yaml
│   ├── fetch_runs.py
│   ├── handle_artifacts.py
│   ├── remove_tags.py
│   ├── requirements.txt
│   ├── run.py
│   ├── update_blacklist.py
│   └── update_tables.py
└── image
    └── gpu-dashboard.drawio.png
Execute below command in both check-dashboard directory and gpu-dashboard directory.
$ python3 -m venv .venv
$ . .venv/bin/activate
$ pip install -r requirements.txt
Get an AWS account from the administrator and grant access permissions to the following services in IAM:
- AWSBatch
- CloudWatch
- EC2
- ECS
- ECR
- EventBridge
- IAM
- VPC
Create a user for AWS CLI in IAM. Grant access permissions to the following services:
- ECR
Click on the created user, note down the following strings in the Access key tab:
- Access key ID
- Secret access key
Execute the following command in the local Terminal to log in to AWS.
$ aws configure

AWS Access Key ID [None]: Access key ID
# Enter
AWS Secret Access Key [None]: Secret access key
# Enter
Default region name [None]: blank
# Enter
Default output format [None]: blank
# Enter
After the configuration is completed, execute the following command to check the connection. If successful, the file list of s3 will be output.
$ aws s3 lsReference: 【AWS】How to set up aws cli
- Go to
Amazon ECR > Private registry > Repositories - Click on
Create repository - Enter any repository name in
Repository name(e.g. geniac-gpu) - Click
Create repository
- Click on the created repository name
- Click on
View push commands - Execute the 4 commands displayed in the local Terminal in order
# Example commands
$ aws ecr get-login-password --region ap-northeast-1 | docker login --username AWS --password-stdin 111122223333.dkr.ecr.ap-northeast-1.amazonaws.com
$ docker build -t geniac-gpu .
$ docker tag geniac-gpu:latest 111122223333.dkr.ecr.ap-northeast-1.amazonaws.com/geniac-gpu:latest
$ docker push 111122223333.dkr.ecr.ap-northeast-1.amazonaws.com/geniac-gpu:latest
Since commands are uniquely determined by the repository, it's easy to deploy from the second time onward by writing the above commands in a shell script.
Perform the above procedure in both the gpu-dashboard directory and the check-dashboard directory.
- Go to
Virtual Private Cloud > Your VPCs - Click on
Create VPC - Select
VPC and morefromResources to create - Click on
Create VPC
- Go to
IAM > Roles - Click on
Create role - Configure
Use casesettings- Select
Elastic Container ServiceforService - Select
Elastic Container Service TaskforUse case
- Select
- Select
AmazonEC2ContainerRegistryReadOnlyandCloudWatchLogsFullAccessinPermissions policies - Click
Next - Enter
ecsTaskExecutionRoleinRole name - Click
Create role
- Go to
Amazon Elastic Container Service > Clusters - Click on
Create cluster - Enter any cluster name in
Cluster name - Click on
Create
- Go to
Amazon Elastic Container Service > Task Definitions - Click on
Create new Task Definition, then click onCreate new Task Definition - Enter any task definition family name in
Task definition family - Change
CPUandMemoryinTask sizeas needed - Select
ecsTaskExecutionRoleinTask role - Configure
Container - 1settings- Enter the pushed repository name and image URI in ECR in
Container details - Set
Resource allocation limitsappropriately according to theTask size
- Enter the pushed repository name and image URI in ECR in
- Click
Add environment variableinEnvironment variables - Optionaland add the following:- Key: WANDB_API_KEY
- Value: {Your WANDB_API_KEY}
- Click
Create
Perform the above procedure in both the gpu-dashboard directory and the check-dashboard directory.
- Go to
Amazon Elastic Container Service > Clusters > {Cluster name} > Scheduled tasks - Click on
Create - Enter any rule name in
Scheduled rule name - Select
cron expressionfromScheduled rule type - Enter an appropriate expression in
cron expression- Since this UI requires input in UTC time,
cron(15 15 * * ? *)corresponds to 0:15 a.m. Japan time.
- Since this UI requires input in UTC time,
- Enter any target ID in
Target ID - Select the task definition from
Task definition family - Select VPC and subnet in
Networking - If there is no existing security group in
Security groups, selectCreate new security groupand create a security group - Click on
Create
Perform the above procedure in both the gpu-dashboard directory and the check-dashboard directory.
Execute the following command to set up the python environment for the periodic execution script.
It's good to create a file called debug.ipynb for debugging.
By editing config.yaml, you can reduce the impact on the production environment.
$ cd gpu-dashboard
$ python3 -m venv .venv
$ . .venv/bin/activate
Similarly, execute the following command to set up the python environment for the periodic execution check script.
It's also good to create a file called debug.ipynb in this directory for debugging.
$ cd check-dashboard
$ python3 -m venv .venv
$ . .venv/bin/activate- Go to
CloudWatch > Log groupsin AWS - Click on
/ecs/{Task definition name} - Click on the log stream to check the logs
If you forget to add the ignore_tag during regular execution, runs will continue to be counted towards GPU usage. To exclude them from the calculation, add the tag and run the script.
$ cd gpu-dashboard
$ python3 -m venv .venv
$ . .venv/bin/activate
$ python3 update_blacklist.py- Fetch latest data
- Set target_date
- Create a list of companies
- Get projects for each company [Public API]
- Get runs for each project [Private API]
- Filter by target_date and tags
- Detect and alert runs that call wanb.init multiple times on the same instance
- Get system metrics for each run [Public API]
- Aggregate by run id x date
- Update data
- Get csv up to yesterday from Artifacts
- Concat latest data and save to Artifacts
- Filter run ids
- Aggregation
- Aggregate overall
- Aggregate monthly
- Aggregate daily company
- Update tables
- Reset latest tag
- Output tables
