This repository contains necessary kubernetes manifests and helm charts for installing EFK (Elasticsearch, Fluentd and Kibana) stack onto your kubernetes cluster.
- A Kubernetes v1.10+ cluster with enabled RBAC
kubectlorhelmtool used for installation
Manifests and charts do the following:
- Create logging namespace
- Create local
PersistentVolumeson nodes - Configure and launch scalable Elasticsearch cluster using
ServicesandSatefulSet - Create Kibana Kubernetes
ServiceandDeployment - Set up Fluentd
DaemonSetto report logs from every node to the Elasticsearch
If you are planning to use local PersistentVolumes for storage be sure to check that provided in chart/manifest folder exists on nodes. If not, you can manually create them or use ansible-playbook.
ansible-playbook -i ansible/hosts ansible/create-folder.yml -KIf you are planning to use metricbeat for infrastructure monitoring and you have Kubernetes v1.12 -- be sure to check that read-only port of kubelet on each node is open. You can do this using provided ansible-playbook.
It's important to note that this practice can lead to security threats and should be avoided if possible in production clusters.
ansible-playbook -i ansible/hosts ansible/open-kubelet-port.yml -KYou can install EFK stack using either helm chart or manifests
To install the chart with release name efk
helm install helm/efk --name efkManifests should be installed in a certain order
Firstly create namespace
kubectl create -f k8s/kube-logging.ymlIf you are planning to use local PersistentVolumes for storage
kubectl create -f k8s/local-pvThen install elasticsearch Service and StatefulSet
kubectl create -f k8s/elastic-searchInstall Kibana Service and Deployment
kubectl create -f k8s/kibanaAnd at last install fluentd
kubectl create -f k8s/fluentdTo do so, install kube-state-metrics
kubectl create -f k8s/kube-state-metricAnd metricbeat on top of that
kubectl create -f k8s/metricbeatkubectl create -f k8s/filebeatTo do so just create apm-server manifest
kubectl create -f k8s/apm-serverAPM Server gets information from apm-agents, you can see usage examples of such agents and how to integrate them to Kubernetes at https://github.com/walker2/k8s-goapm-examples
After installing we should check if everything is working correctly.
First, be sure to check that there are no errors in kubernetes and every pod is functioning and running.
For example, if you installed ELK Stack in kube-logging namespace, you can do this by running following command
kubectl get all -n kube-loggingThen you should check if Elasticsearch connected to necessary services. You can do this by using proxy command or forwarding provided ports.
For example, if yours Elasticsearch REST API located on default port 9200 you can do by running following command
kubectl port-forward es-cluster-0 9200:9200 -n kube-loggingAfter this you should be able to perform curl request against said API like so
curl http://localhost:9200/_cat/indices?vOutput should look somewhat similar to this
# Output
health status index                uuid                   pri rep docs.count docs.deleted store.size pri.store.size
green  open   logstash-2019.07.12  pxSPLgM2RgCNtNXeH6mBZg   1   1      19027            0     25.8mb         12.3mb
green  open   .kibana_1            2S6pp2exS9-YtnqhKSTOIg   1   1          7            0     71.3kb         35.6kb
green  open   .kibana_task_manager Xkn8a_o_TGWiQwRoWSduBA   1   1          2            0    107.5kb         53.7kb
green  open   logstash-2019.07.10  fOd3K8w_SnC-sWB1vbTwqQ   1   1       7014            0      3.9mb          2.2mb
green  open   logstash-2019.07.11  gi2_Im8fQkCQz1x5H04Phg   1   1     214894            0    115.9mb         56.5mb
If everything checks out if now can log in to the Kibana front-end using the same port-forwarding technique.
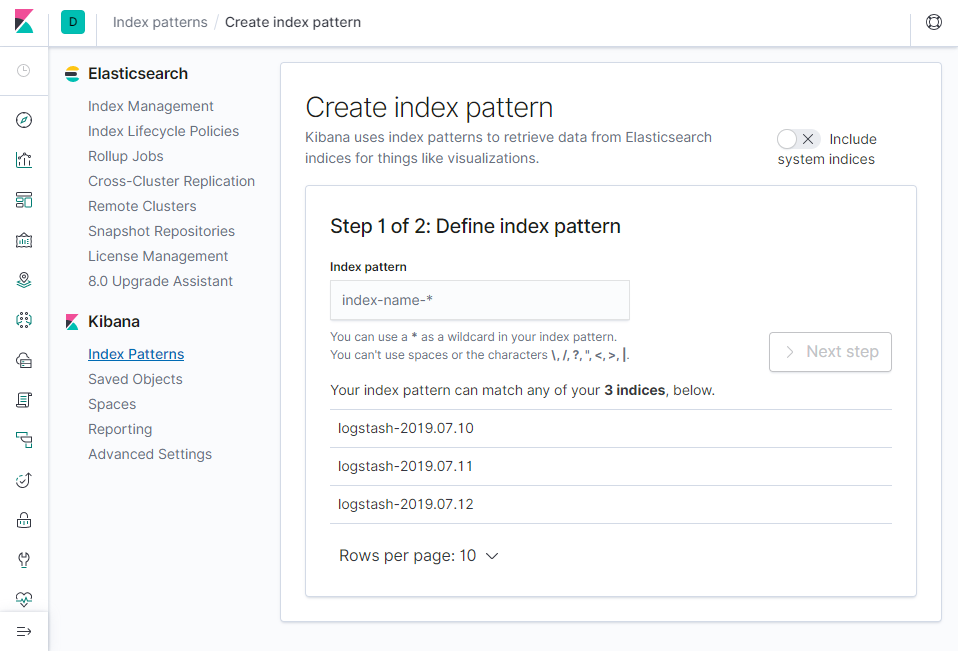
kubectl port-forward [your particular kibana pod name] 5601:5601 -n kube-loggingIf everything is fine you can create new index pattern (try something like logstash-*) and start working with EFK stack
Just run following helm command
helm del --purge efkTo uninstall manifests you can delete all manifests from k8s folder like so
kubectl delete -f k8s/The following tables list the configurable parameters of the efk chart and their default values.
| Parameter | Description | Default |
|---|---|---|
logNamespace |
Namespace for EFK stack to be deployed to | kube-logging |
storage.name |
Name of StorageClass for local Volumes |
my-local-storage |
storage.capacity |
Capacity of each local PersistentVolume |
10Gi |
storage.localPath |
Path to local folder on each node | /mnt/disk/vol1 |
storage.nodes |
List of nodes where PersistentVolume should be provisioned |
[node2, node3] |
elasticsearch.replicas |
Number of replicas of elastic-search | 2 |
elasticsearch.limits.cpu |
Limit of cpu usage by elastic-search | 300m |
elasticsearch.requests.cpu |
Request of cpu usage of elastic-search | 50m |
elasticsearch.ports.rest |
REST API elastic-search port | 9200 |
elasticsearch.ports.internode |
Port for communication between nodes | 9300 |
kibana.port |
Port for accessing kibana front-end | 5601 |
kibana.replicas |
Number of replicas of kibana | 1 |
kibana.limits.cpu |
Limit of cpu usage by kibana | 300m |
kibana.requests.cpu |
Request of cpu usage of kibana | 50m |
fluentd.limits.memory |
Limit of memory usage by fluentd | 512Mi |
fluentd.requests.cpu |
Request of cpu usage of fluentd | 100m |
fluentd.limits.memory |
Request of memory usage of fluentd | 200Mi |
| Parameter | Description | Default |
|---|---|---|
stateMetric.enabled |
Enable kube-state-metrics | true |
stateMetric.replicas |
Number of kube-state-metrics replicas | 2 |
stateMetric.ports.httpmetrics |
Port for http metrics | 8080 |
stateMetric.ports.telemetry |
Port for telemetry | 8081 |
metricbeat.enabled |
Enable metricbeat | true |
metricbeat.installOnMaster |
Should be metricbeat installed on master node | true |
metricbeat.limits.memory |
Limit of memory usage by metricbeat | 200Mi |
metricbeat.requests.cpu |
Request of cpu usage of metricbeat | 100m |
metricbeat.requests.memory |
Request of memory usage of metricbeat | 100Mi |
| Parameter | Description | Default |
|---|---|---|
images.elasticsearch |
Image of elastic-search | docker.elastic.co/elasticsearch/elasticsearch:7.2.0 |
images.kibana |
Image of kibana | docker.elastic.co/kibana/kibana:7.2.0 |
images.fluentd |
Image of fluentd | fluent/fluentd-kubernetes-daemonset:v1.4.2-debian-elasticsearch-1.1 |
images.stateMetric |
Image of kube-state-metrics | quay.io/coreos/kube-state-metrics:v1.7.0 |
images.metricbeat |
Image of metricbeat | docker.elastic.co/beats/metricbeat:7.2.0 |
