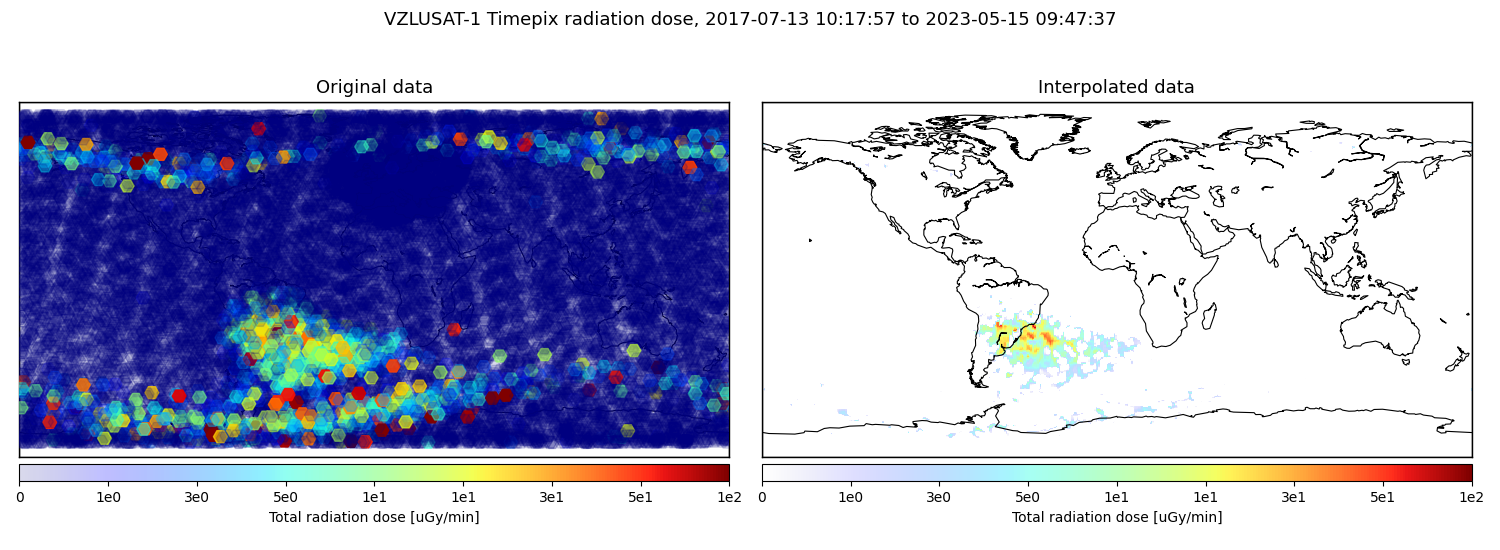
VZLUSAT-1 Timepix radiation data (2017-07-13 to 2023-05-15)
 |
 |
If you use our data for your research, please cite our related publications.
T Baca, M Jilek, I Vertat, M Urban, O Nentvich, R Filgas, C Granja, A Inneman and V Daniel,
Timepix in LEO Orbit onboard the VZLUSAT-1 Nanosatellite: 1-year of Space Radiation Dosimetry Measurements,
Journal of Instrumentation 13(11):C11010, 2018.
Miniaturized X-ray telescope for VZLUSAT-1 nanosatellite with Timepix detector
T Baca, M Platkevic, J Jakubek, A Inneman, V Stehlikova, M Urban, O Nentvich, M Blazek, R McEntaffer and V Daniel,
Miniaturized X-ray telescope for VZLUSAT-1 nanosatellite with Timepix detector,
Journal of Instrumentation 11(10):C10007, 2016.
Raw data
The raw calibrated images are stored in the raw subfolders of data/.
Each image consists of three files:
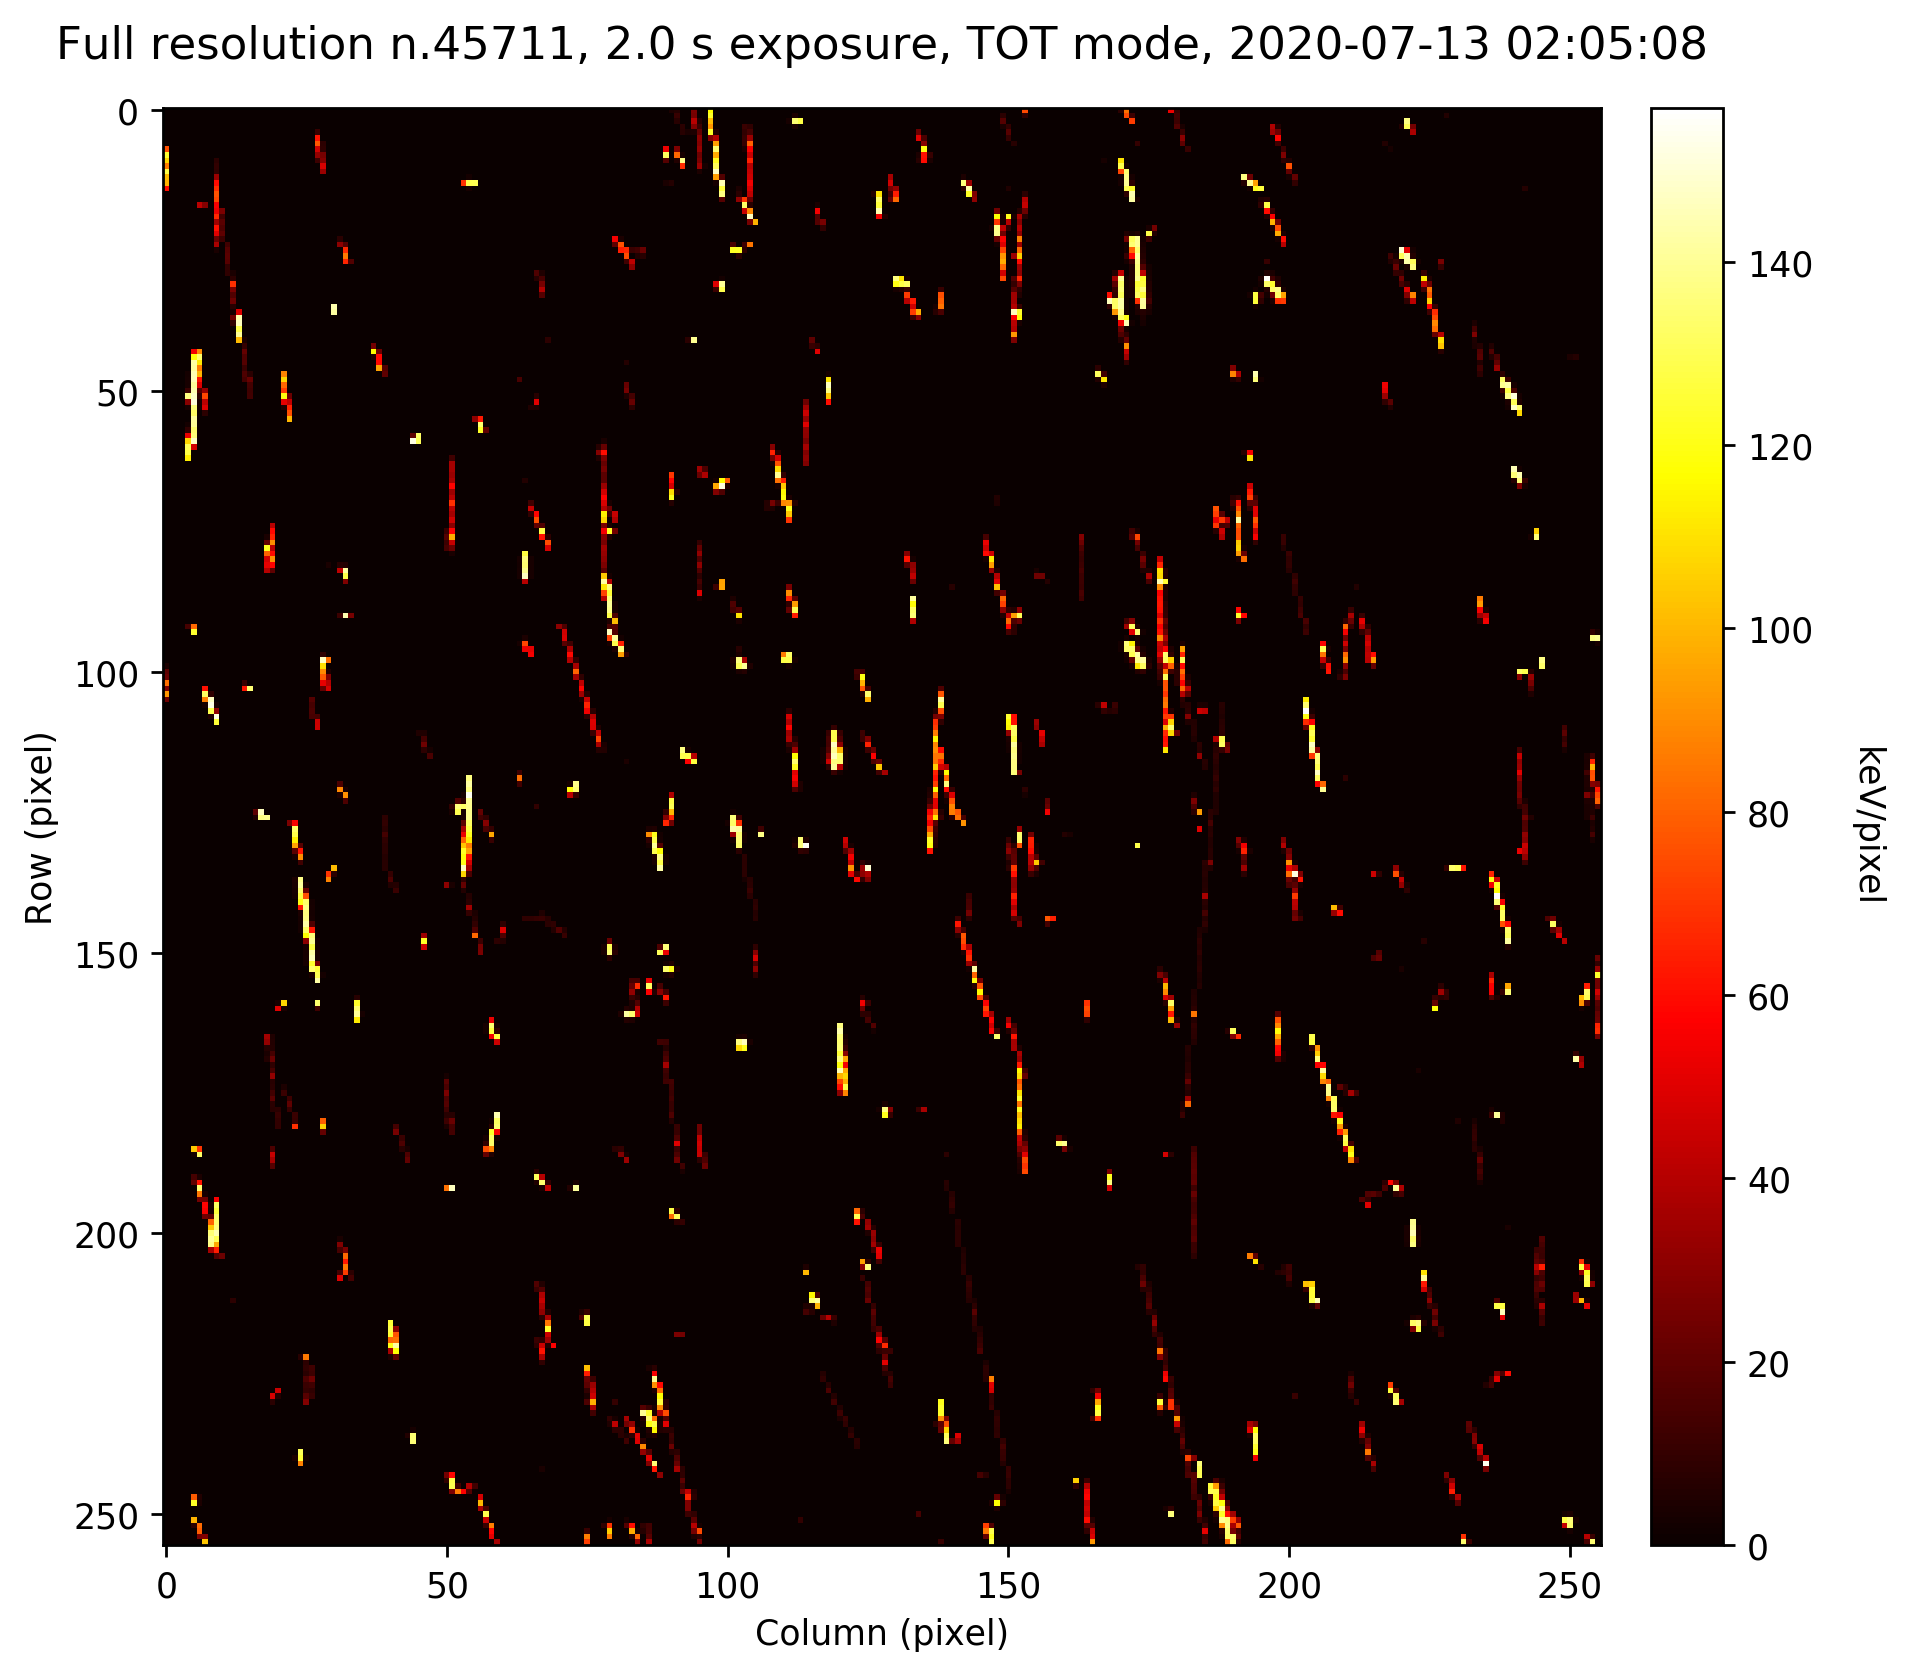
[0-9]+_fullres.txtcontains the 256x256 image matrix, values in each pixel are interpreted as deposited energy in keV.[0-9]+_fullres.metadata.txtcontains metadata of the image, e.g., time stamp (UTC), the position, and detector temperature, settings.[0-9]+_fullres.txt.dscis a metadata file compatible with thePixelmanandPixetsoftware used by the IEAP and Advacam.
The data were re-indexed within each folder to the range [1-N] for easier loading.
However, each image has a unique ID stored in the metadata file.
Moreover, each data folder should contain the info.txt that aggregates the important metadata and provides a convenient map from the image files to the unique image IDs.
Labelled data
The data were labelled using a random forest particle track classifier (Baca et al., 2019).
The data are stored in the labelled subfolders of /data as cluster lists in a json format.
Each image consists of three files:
[0-9]+_fullres.clusters.txtcontains a cluster list in json format. Each cluster contains a list of its pixels and its morphological class.[0-9]+_fullres.metadata.txtcontains metadata of the image, e.g., time stamp (UTC), the position, and detector temperature, settings.[0-9]+_fullres.statistics.txtcontains the total counts of each morphological cluster class in the image.
The data were re-indexed within each folder to the range [1-N] for easier loading.
However, each image has a unique ID stored in the metadata file.
Moreover, each data folder should contain the info.txt that aggregates the important metadata and provides a convenient map from the image files to the unique image IDs.
T Baca, M Jilek, P Manek, P Stibinger, V Linhart, J Jakubek and M Saska,
Timepix Radiation Detector for Autonomous Radiation Localization and Mapping by Micro Unmanned Vehicles,
In 2019 IEEE/RSJ International Conference on Intelligent Robots and Systems (IROS). 2019, 1-8.
Planetary sweeps
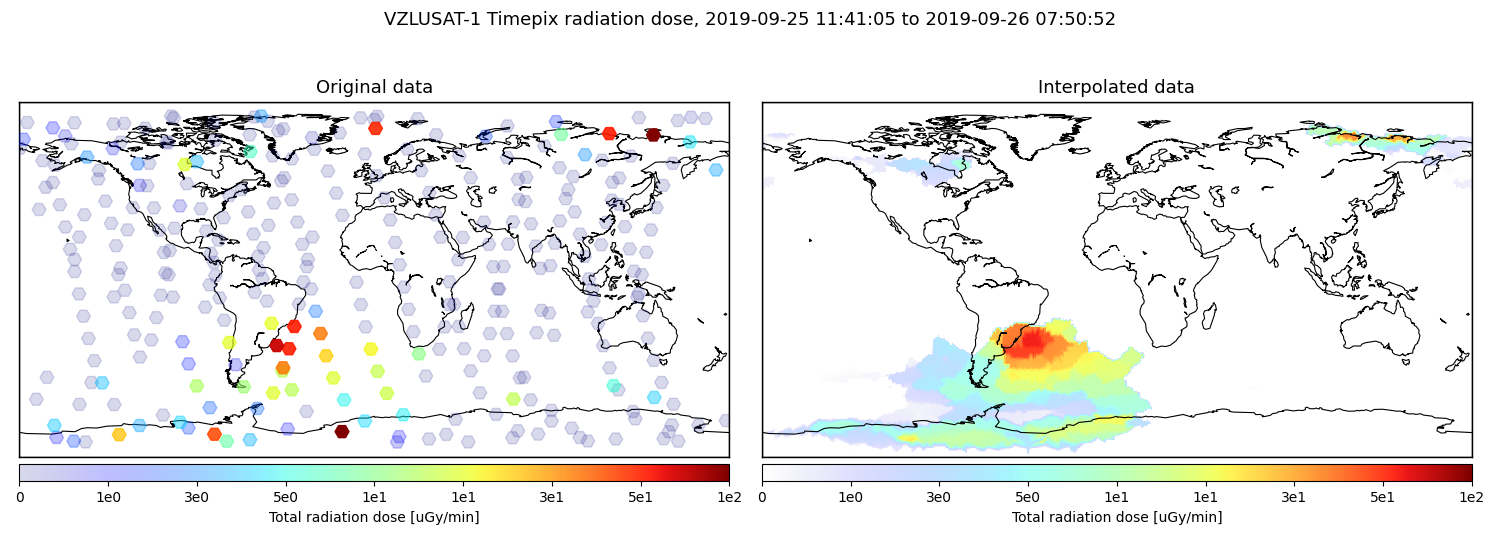
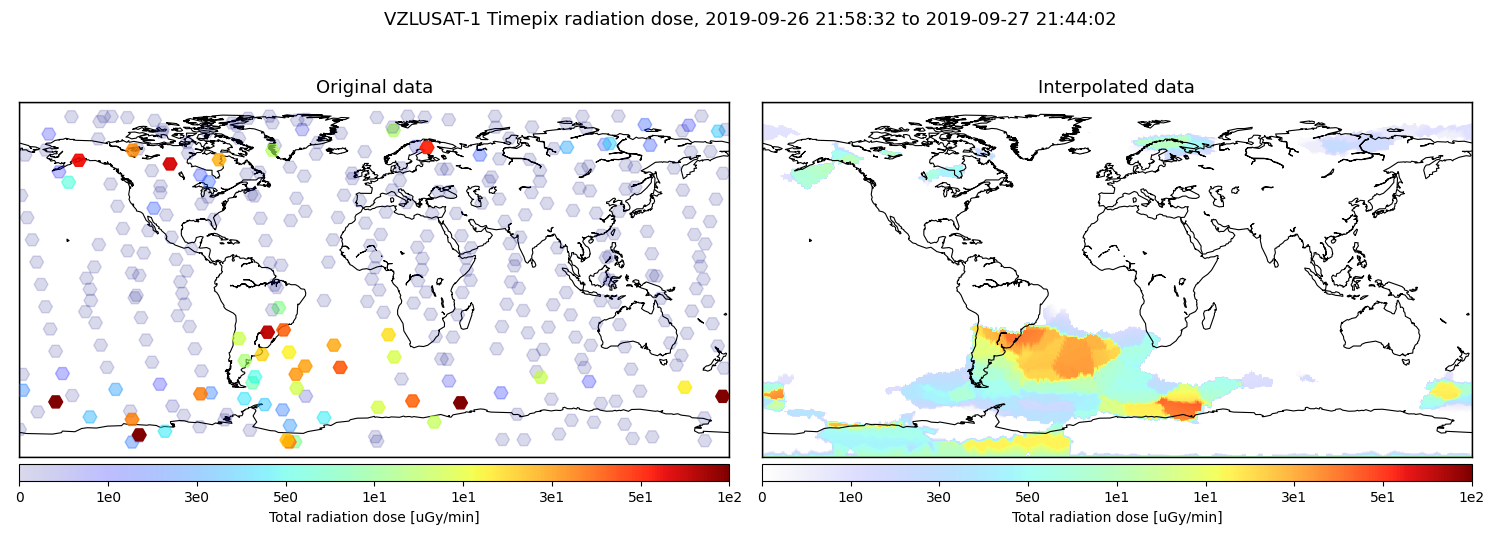
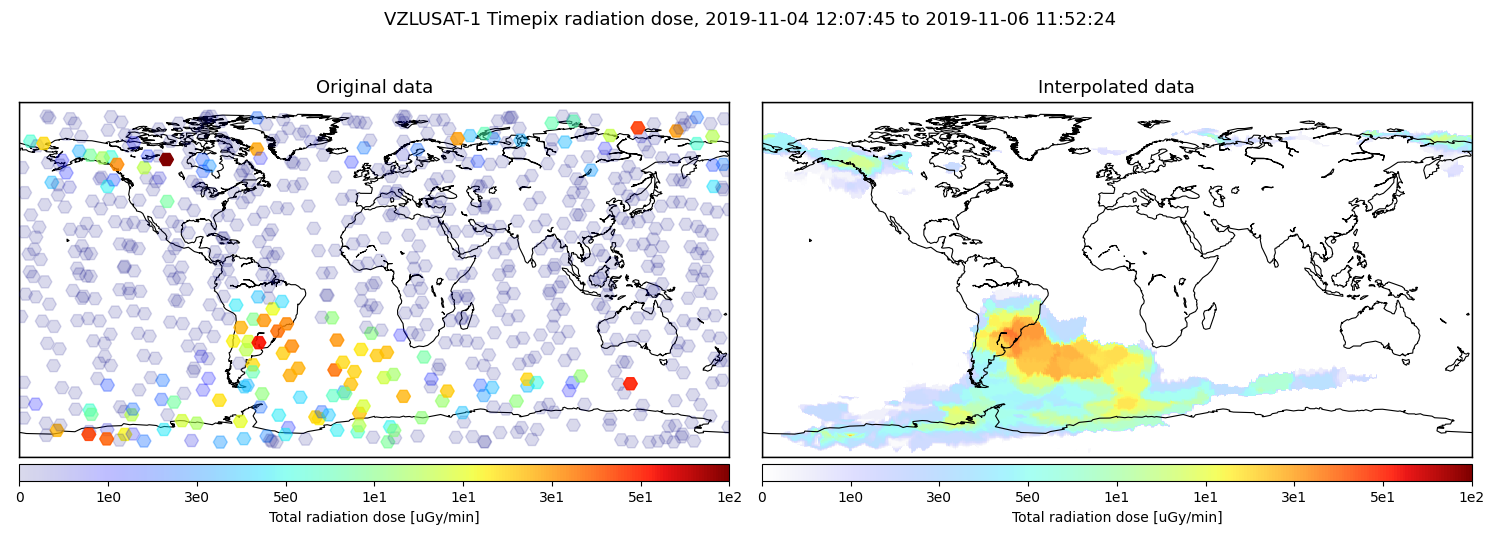
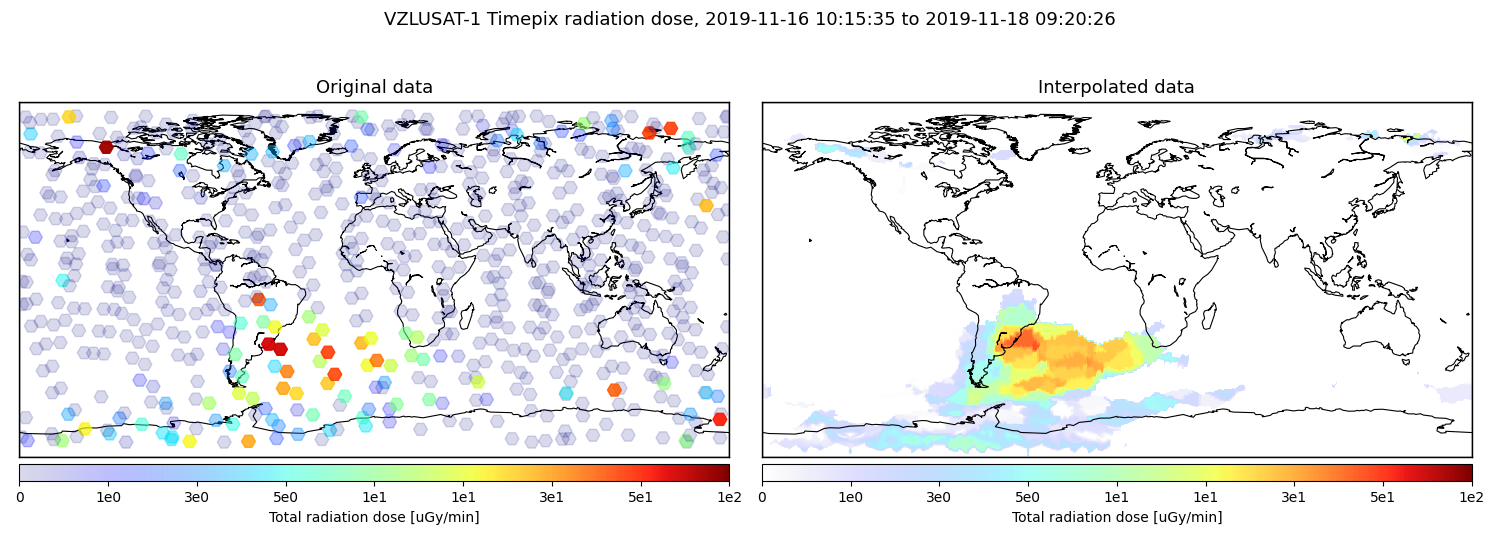
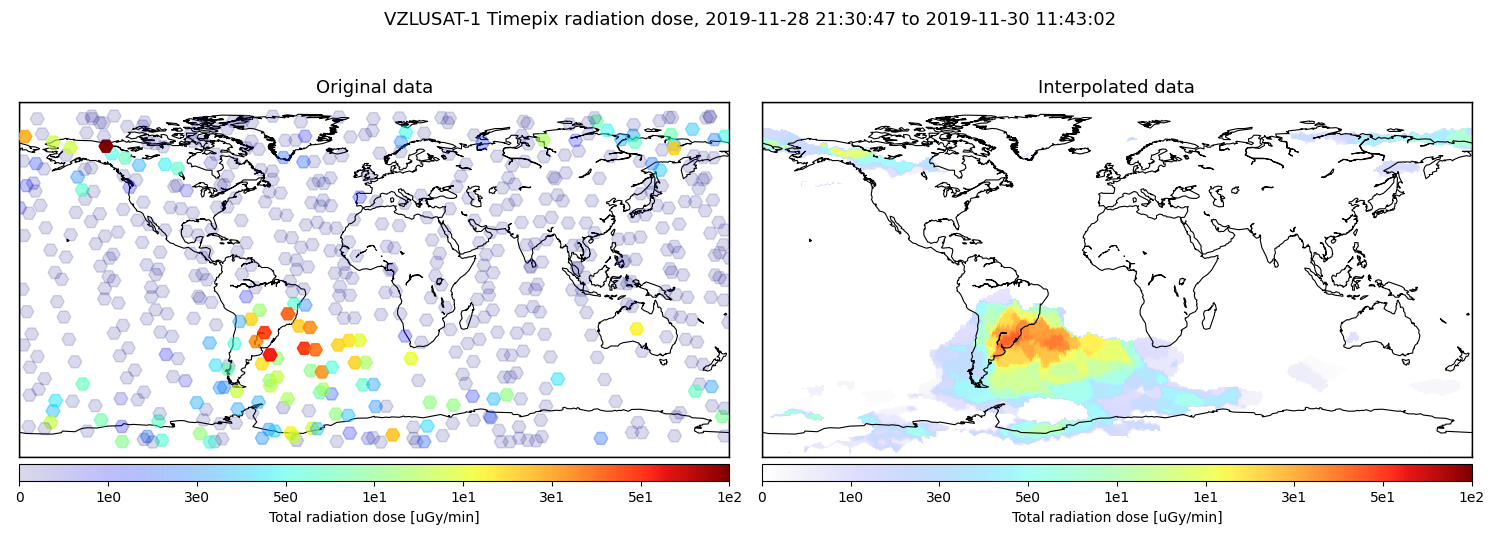
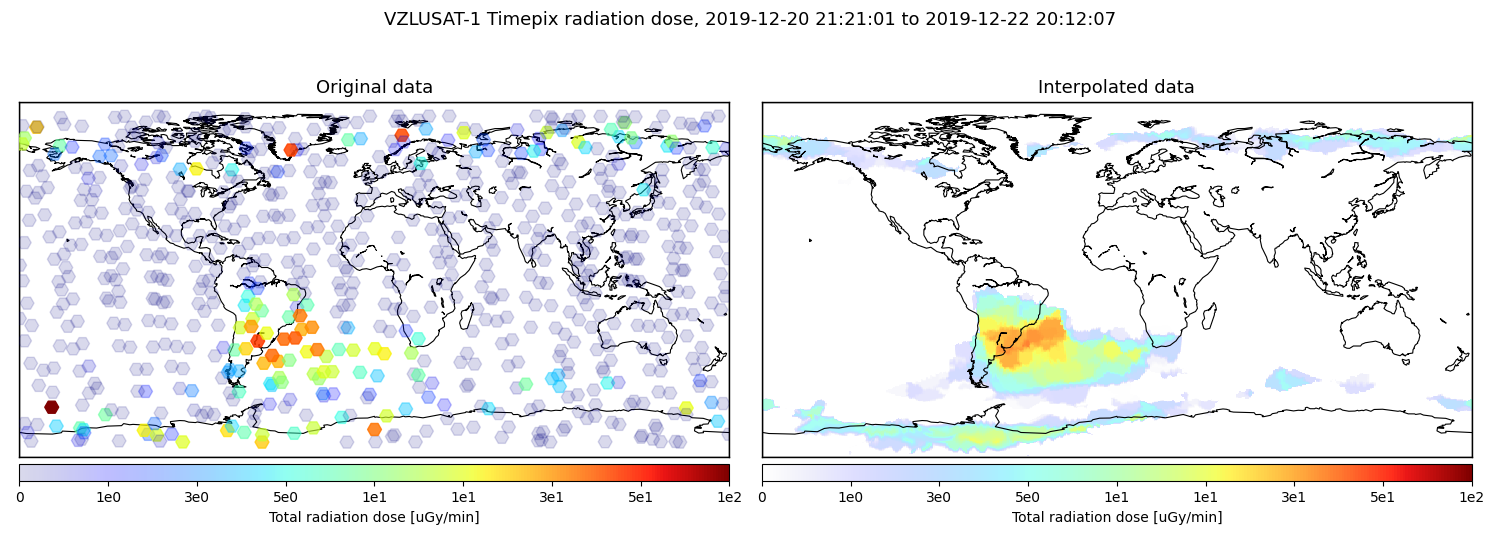
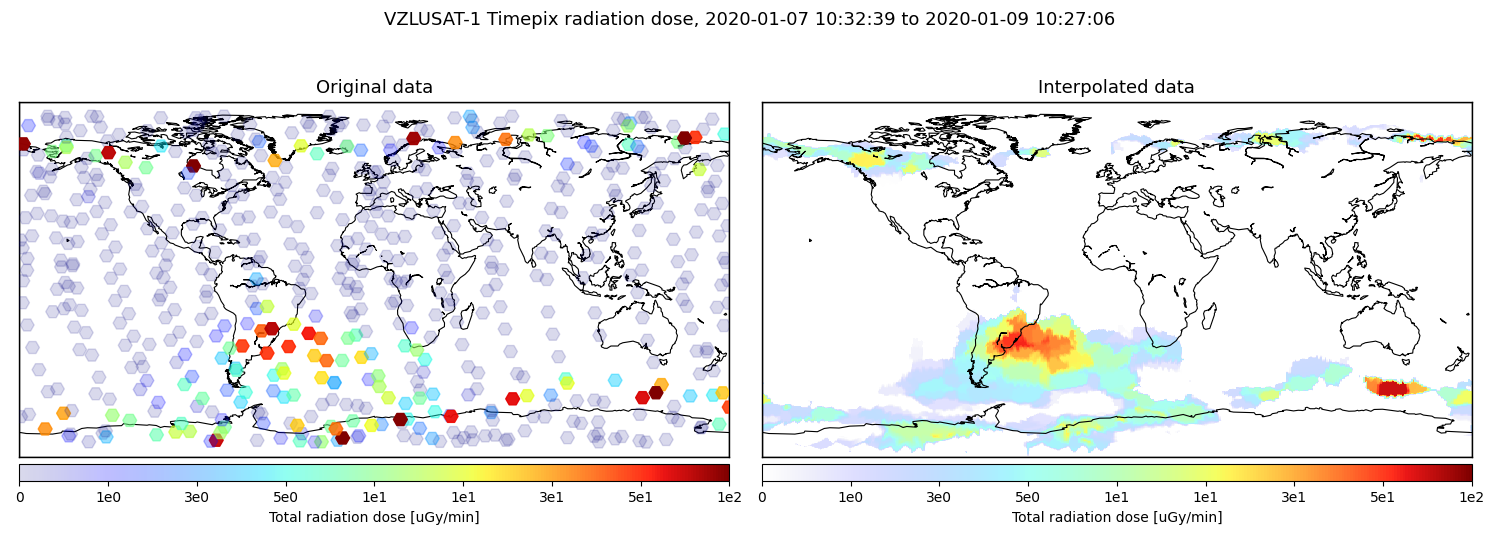
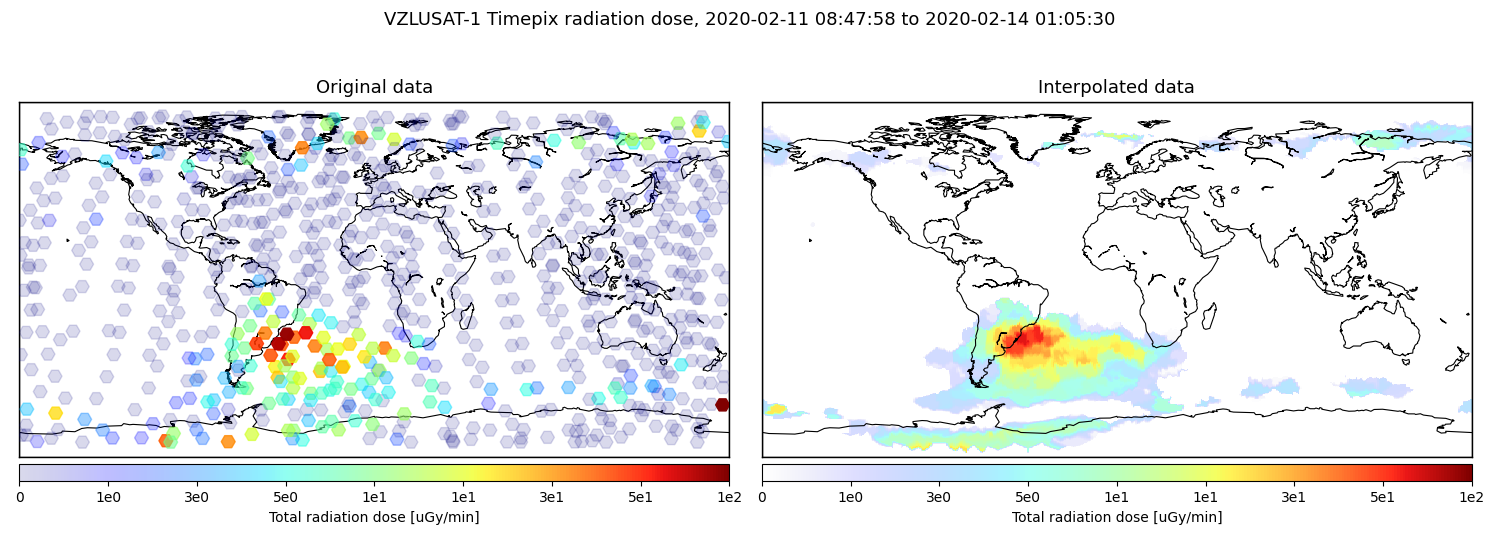
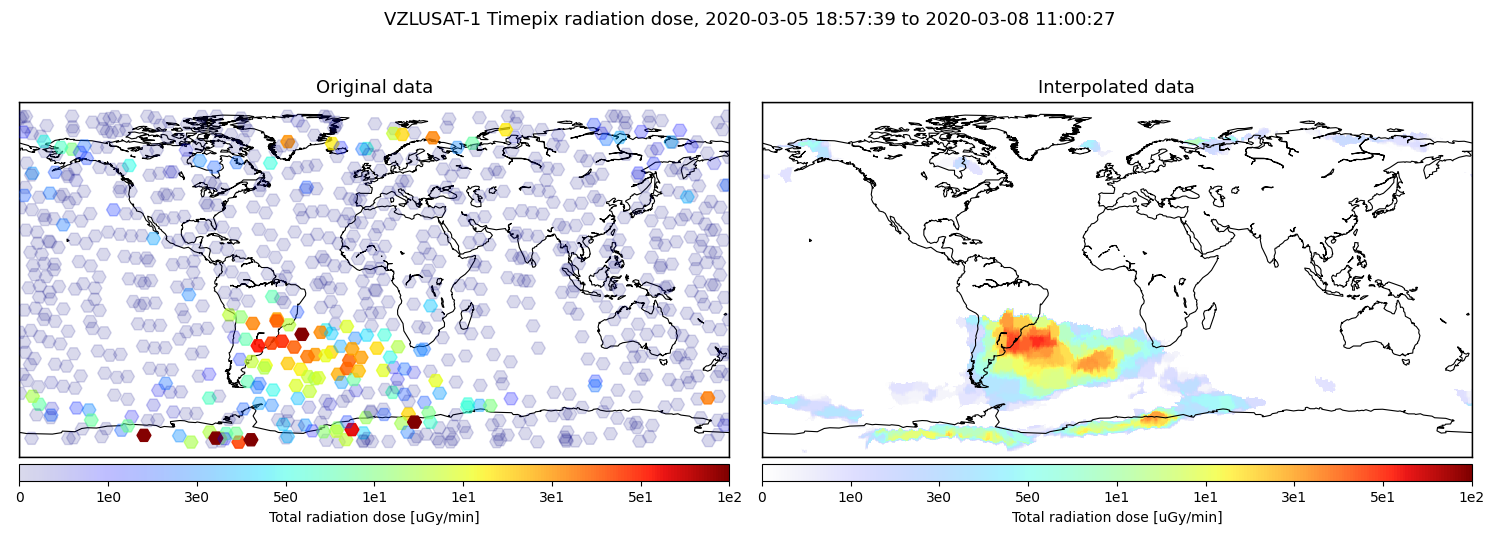
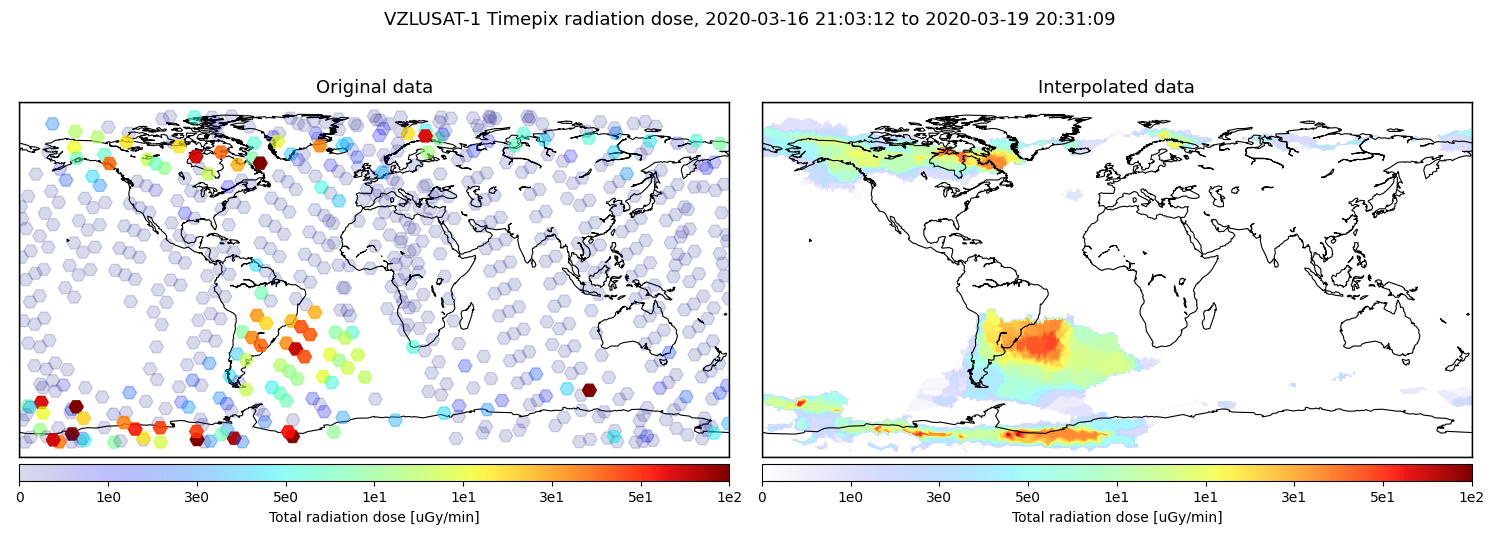
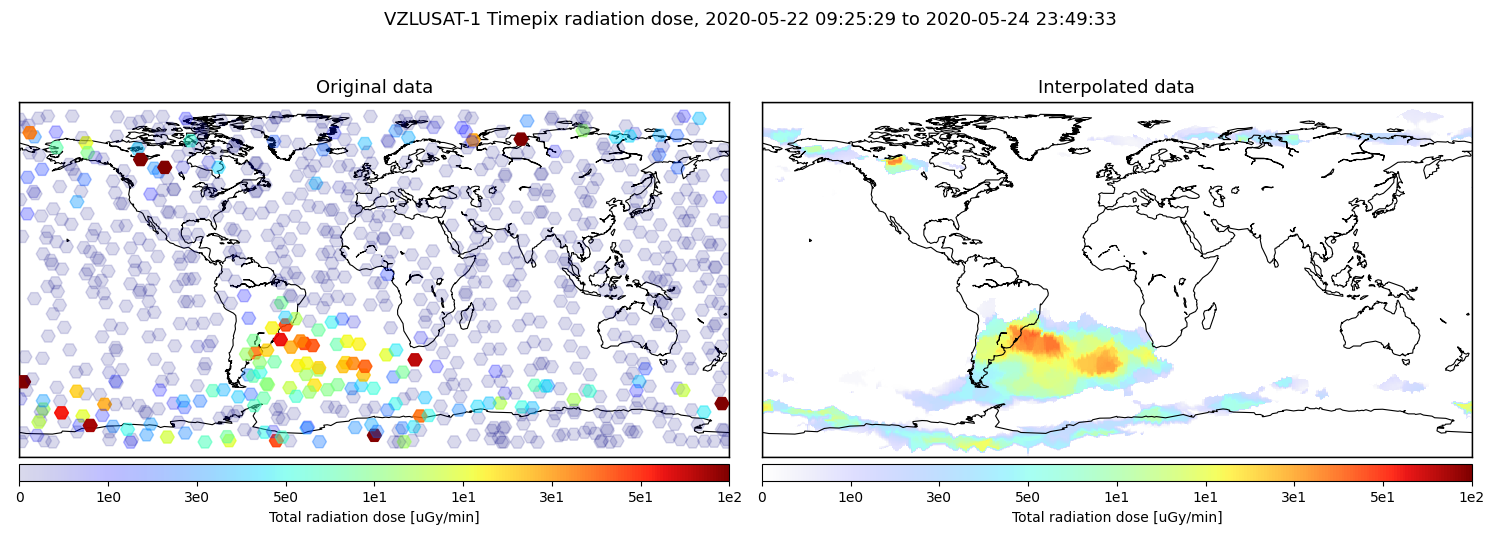
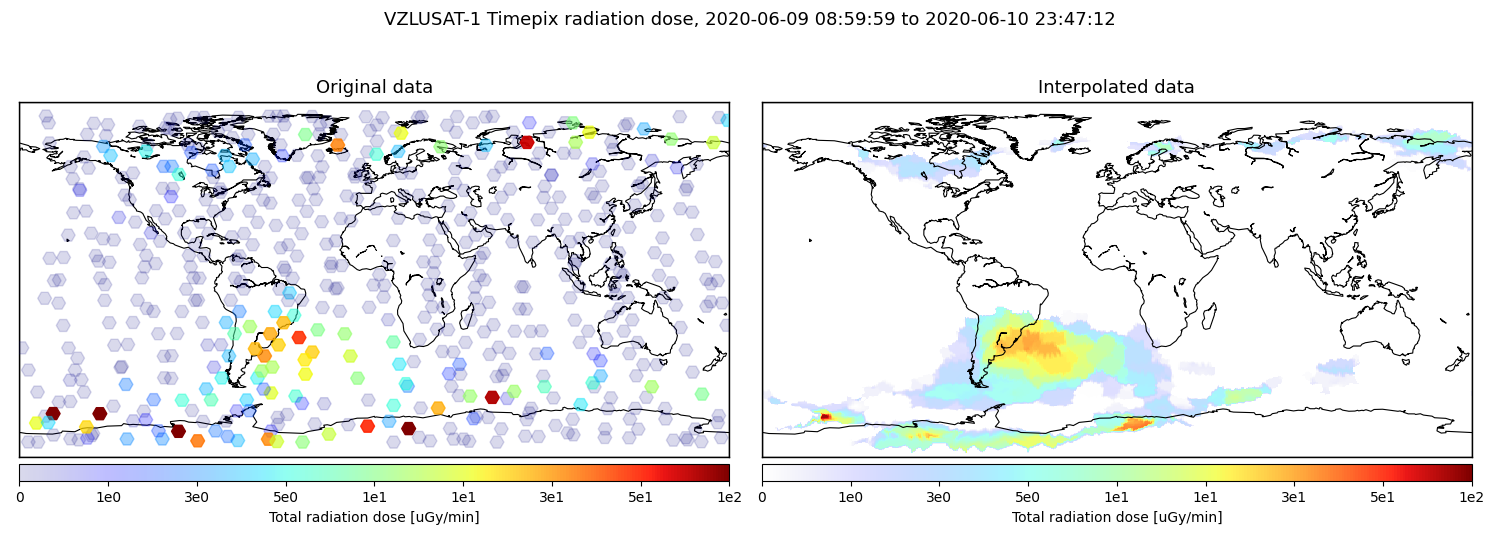
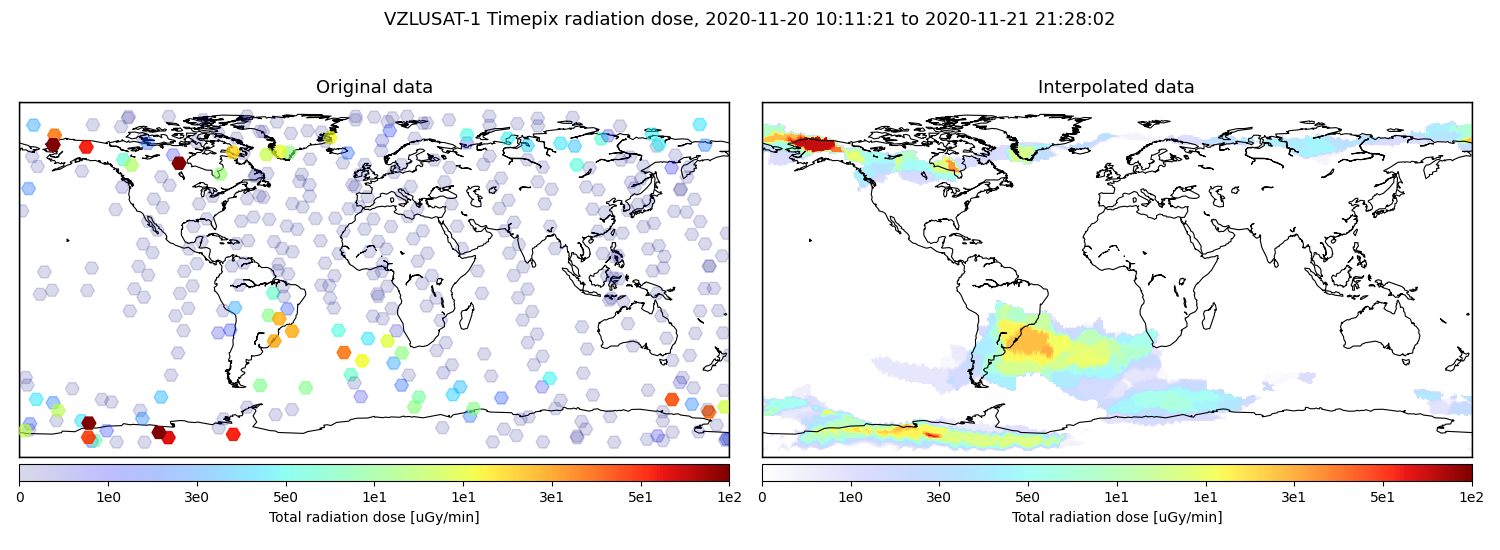
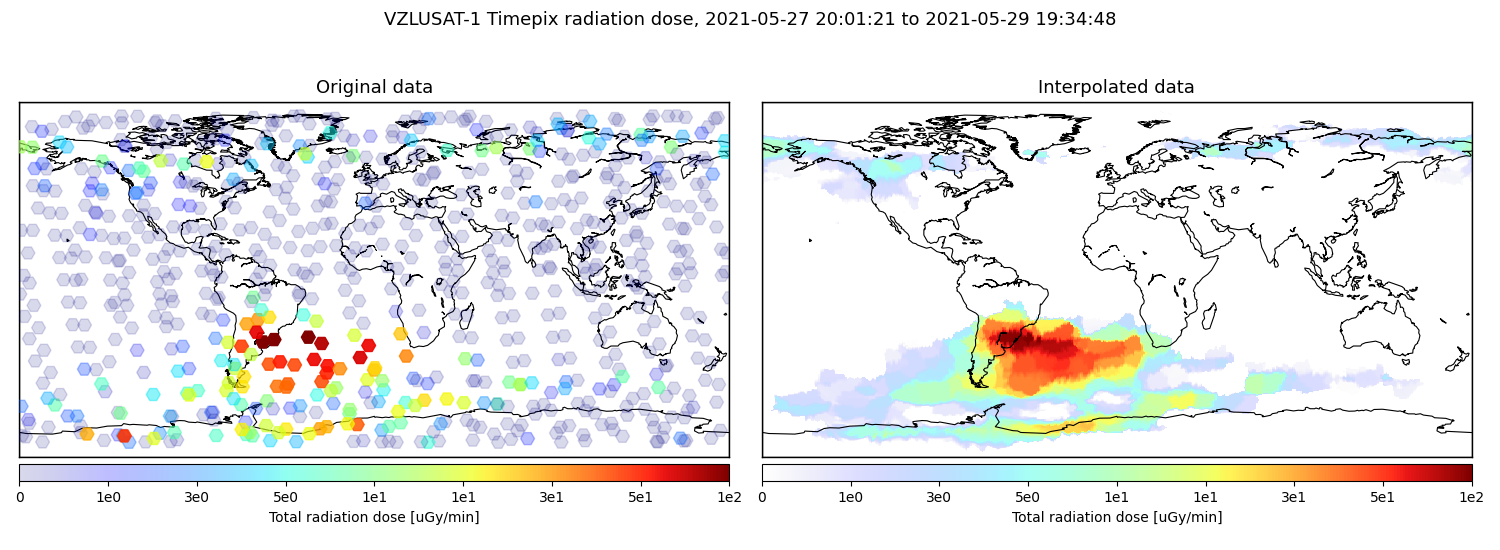
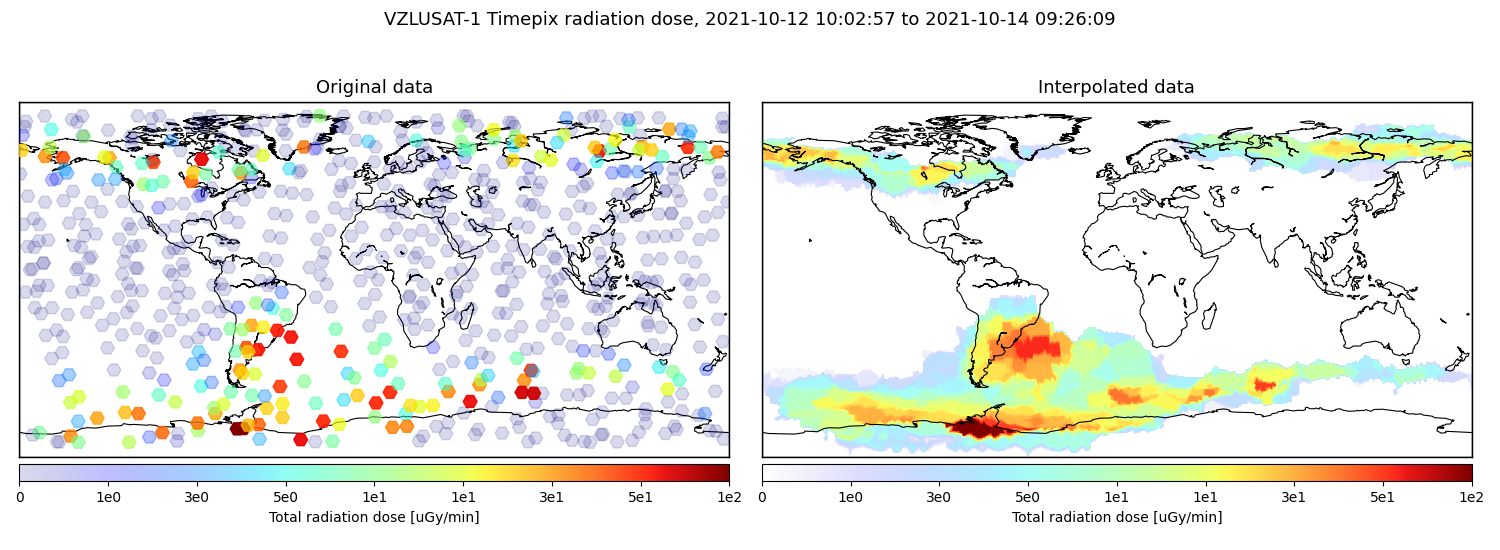
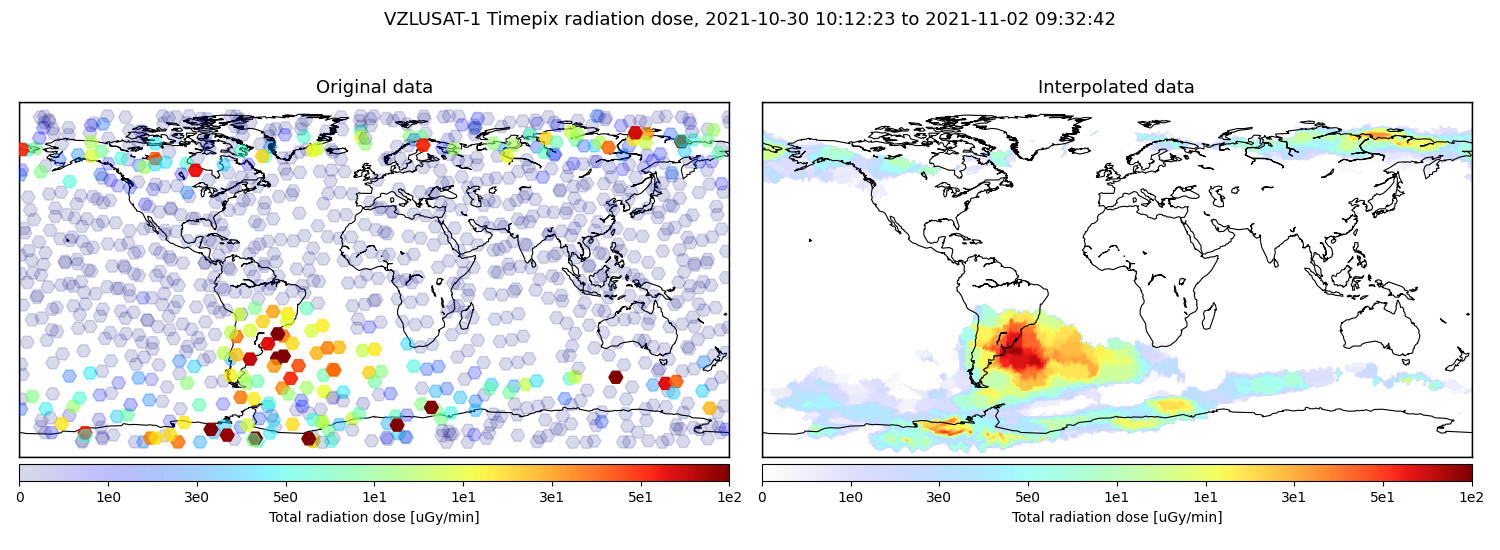
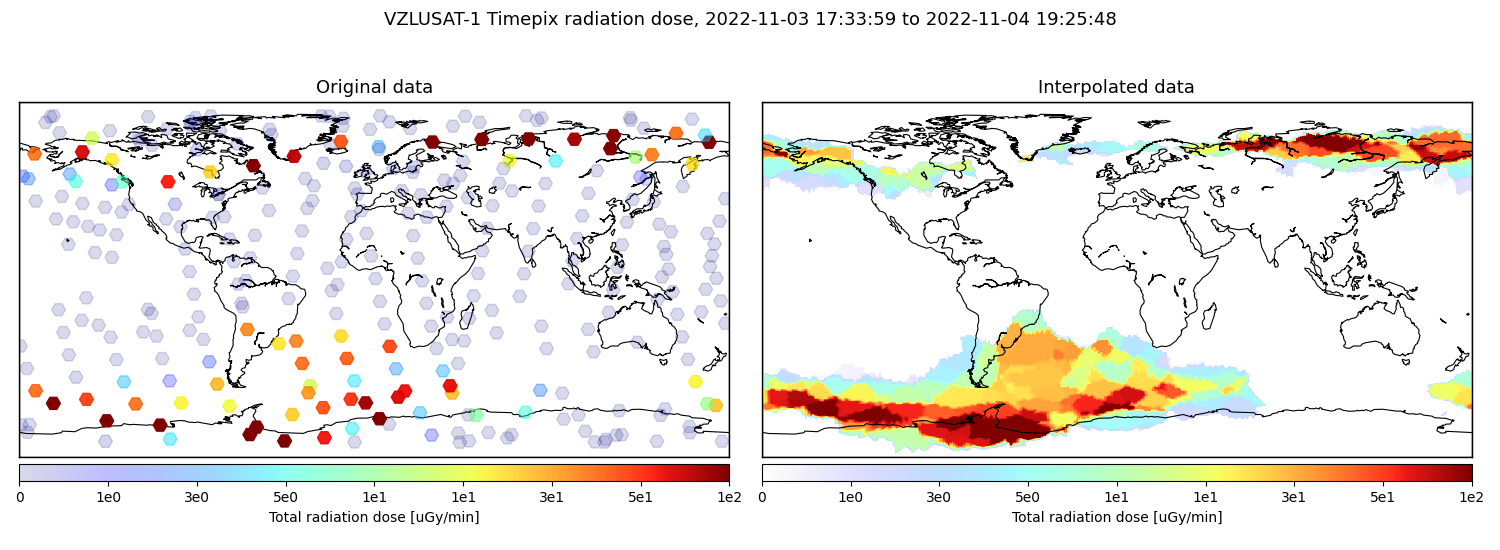
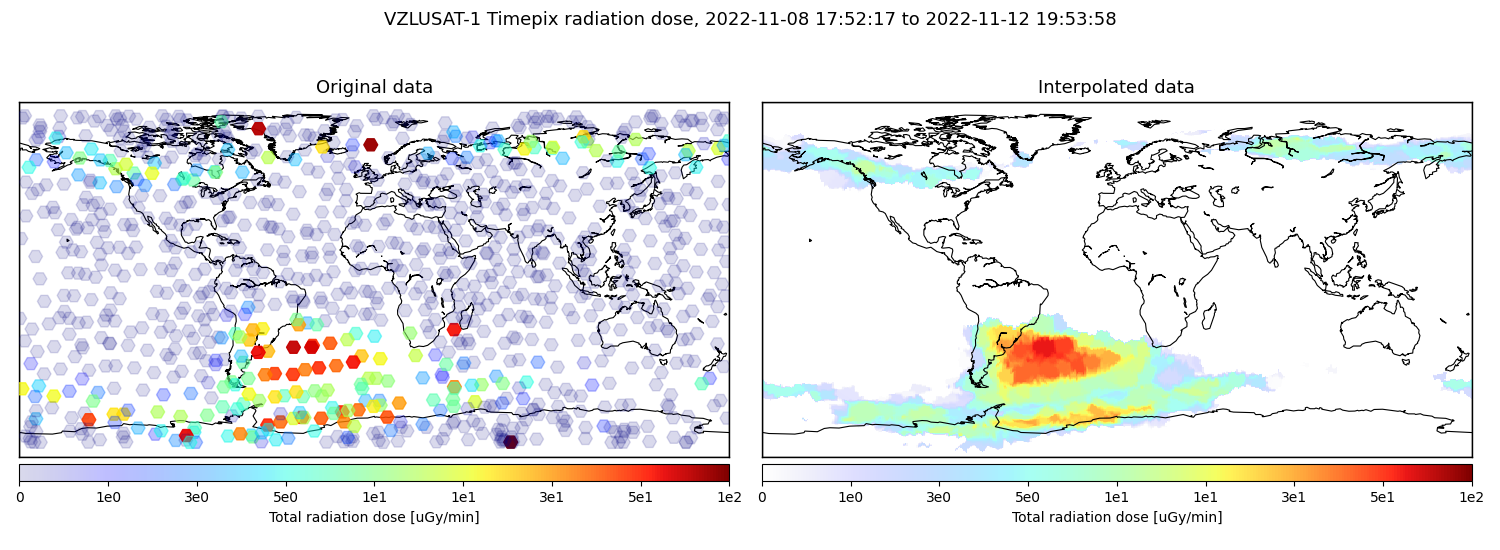
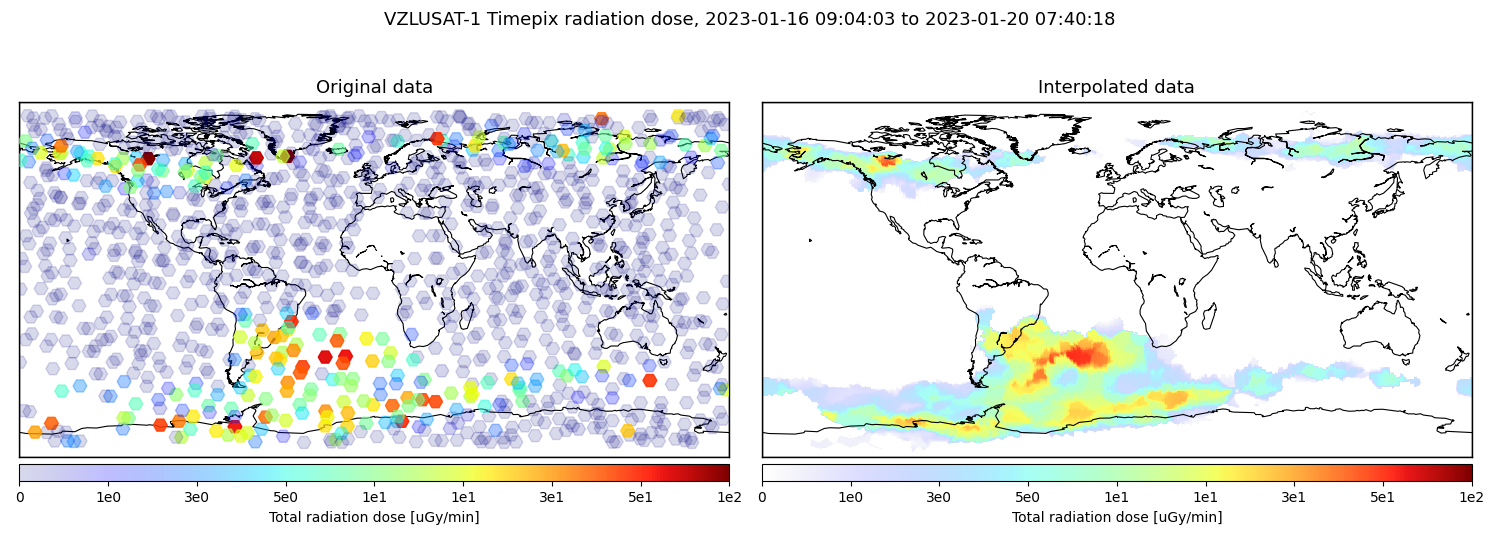
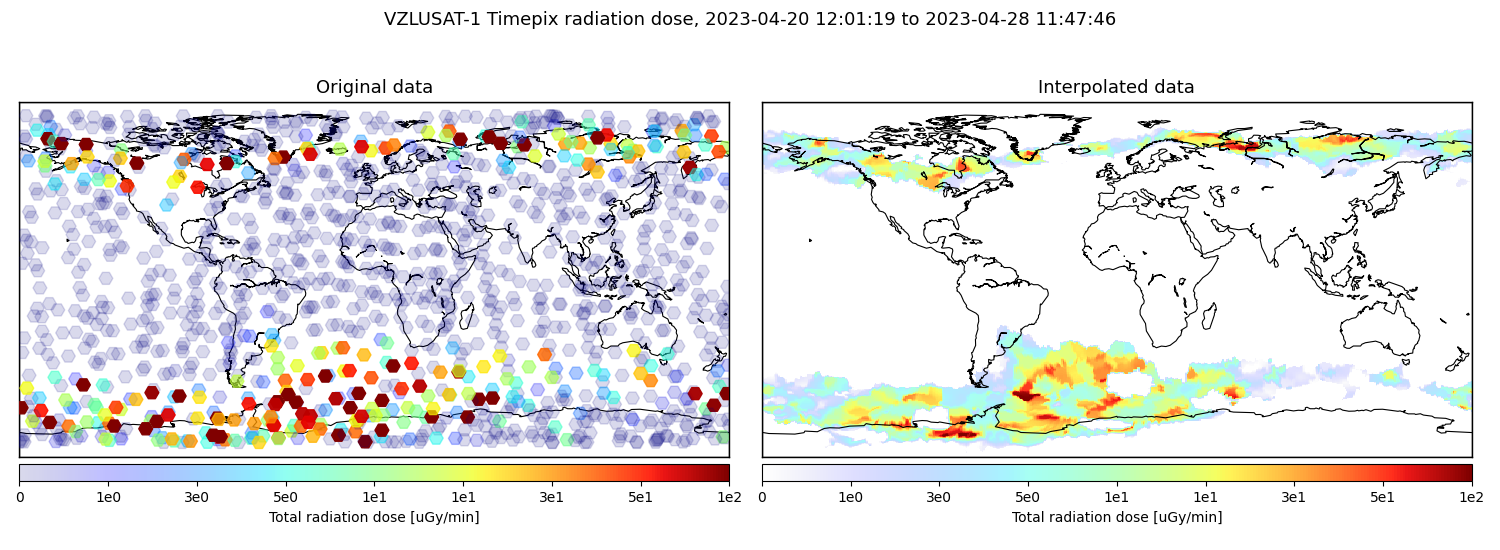
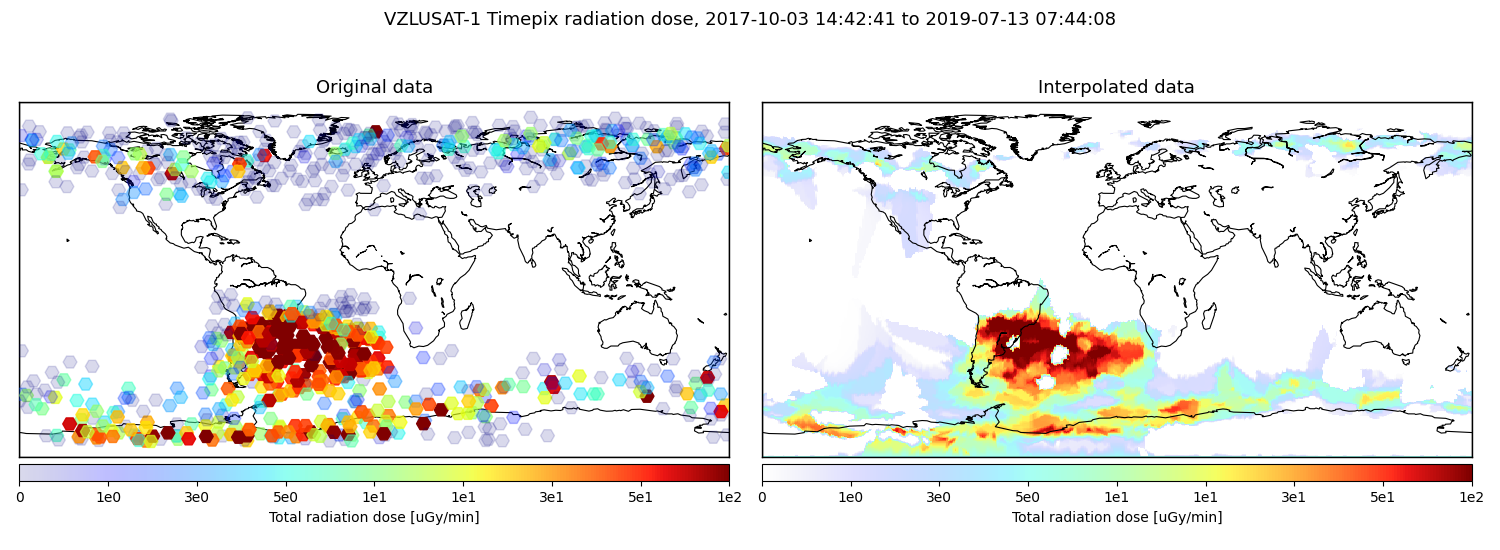
We regularly conduct planetary-wide measurements with varying length between 1 to 3 days. Acquisitions are triggered every 3 minutes, parameters differ based on the satellite's GPS position. Acquisition times are dynamically set between to values (e.g., 2 seconds and 2 milliseconds) to mitigate particle pileup.
./scripts/labelled_maps_plotter.py -d ./data/labelled/planetary_sweeps/all>>> CLICK HERE TO SHOW THE INDIVIDUAL PLANETARY SWEEPS <<<
./scripts/labelled_maps_plotter.py -d ./data/labelled/planetary_sweeps/01_2019-09-25./scripts/labelled_maps_plotter.py -d ./data/labelled/planetary_sweeps/02_2019-09-26./scripts/labelled_maps_plotter.py -d ./data/labelled/planetary_sweeps/03_2019-11-04./scripts/labelled_maps_plotter.py -d ./data/labelled/planetary_sweeps/04_2019-11-16./scripts/labelled_maps_plotter.py -d ./data/labelled/planetary_sweeps/05_2019-11-28./scripts/labelled_maps_plotter.py -d ./data/labelled/planetary_sweeps/06_2019-12-20./scripts/labelled_maps_plotter.py -d ./data/labelled/planetary_sweeps/07_2020-01-07./scripts/labelled_maps_plotter.py -d ./data/labelled/planetary_sweeps/08_2020-02-11./scripts/labelled_maps_plotter.py -d ./data/labelled/planetary_sweeps/09_2020-03-05./scripts/labelled_maps_plotter.py -d ./data/labelled/planetary_sweeps/10_2020-03-16./scripts/labelled_maps_plotter.py -d ./data/labelled/planetary_sweeps/11_2020-05-22./scripts/labelled_maps_plotter.py -d ./data/labelled/planetary_sweeps/12_2020-06-09./scripts/labelled_maps_plotter.py -d ./data/labelled/planetary_sweeps/13_2020-07-09./scripts/labelled_maps_plotter.py -d ./data/labelled/planetary_sweeps/14_2020-09-26./scripts/labelled_maps_plotter.py -d ./data/labelled/planetary_sweeps/15_2020_11_21./scripts/labelled_maps_plotter.py -d ./data/labelled/planetary_sweeps/16_2021-05-03./scripts/labelled_maps_plotter.py -d ./data/labelled/planetary_sweeps/17_2021-05-13./scripts/labelled_maps_plotter.py -d ./data/labelled/planetary_sweeps/18_2021-05-27./scripts/labelled_maps_plotter.py -d ./data/labelled/planetary_sweeps/19_2021-10-12./scripts/labelled_maps_plotter.py -d ./data/labelled/planetary_sweeps/20_2021-10-30./scripts/labelled_maps_plotter.py -d ./data/labelled/planetary_sweeps/21_2022-11-03./scripts/labelled_maps_plotter.py -d ./data/labelled/planetary_sweeps/22_2022-11-08./scripts/labelled_maps_plotter.py -d ./data/labelled/planetary_sweeps/23_2023-01-16./scripts/labelled_maps_plotter.py -d ./data/labelled/planetary_sweeps/24_2023-04-20./scripts/labelled_maps_plotter.py -d ./data/labelled/planetary_sweeps/25_2023-05-10South-Atlantic Anomaly and polar belt scanning
Selective scanning of the SAA and the Polar belts used to be conducted before we were able to conduct planetary-wide sweeps. Measurements were pre-planned on exact positions with acquisition time calculated using historic data.
./scripts/labelled_maps_plotter.py -d ./data/labelled/saa_and_polesLong acquisitions above Europe
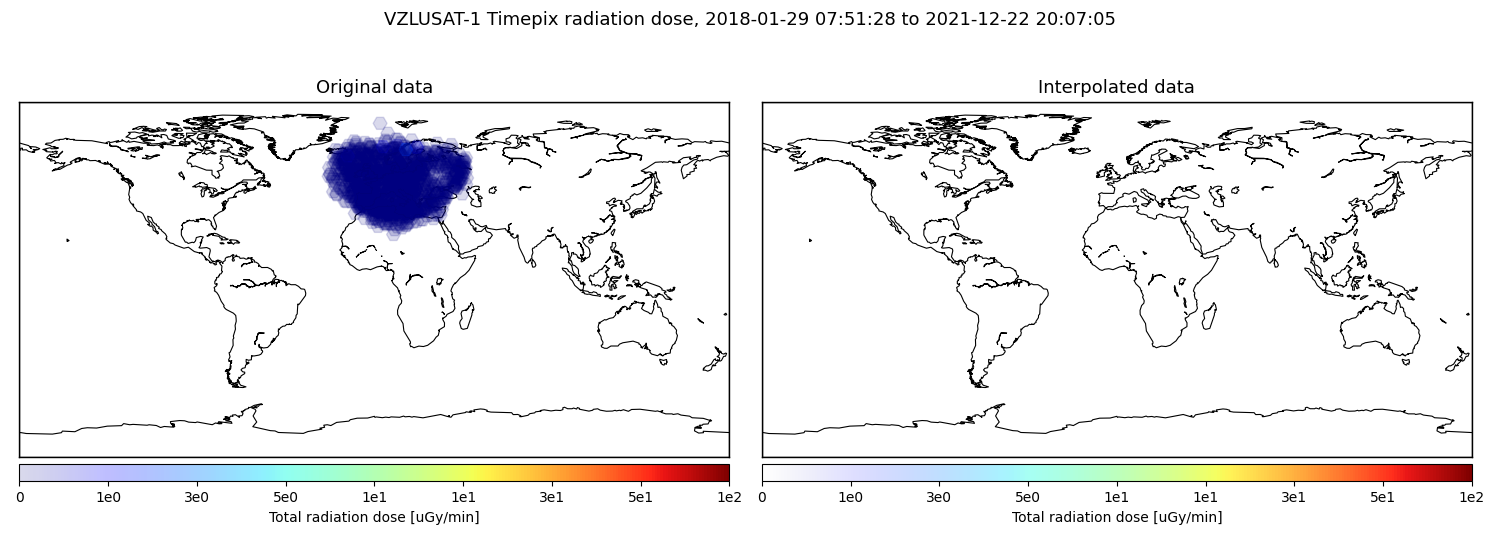
Long acquisitions (10 s, 20 s) above Europe are triggered regularly by the ground segment when the satellite is in direct contact.
./scripts/labelled_maps_plotter.py -d ./data/labelled/above_europeAll data
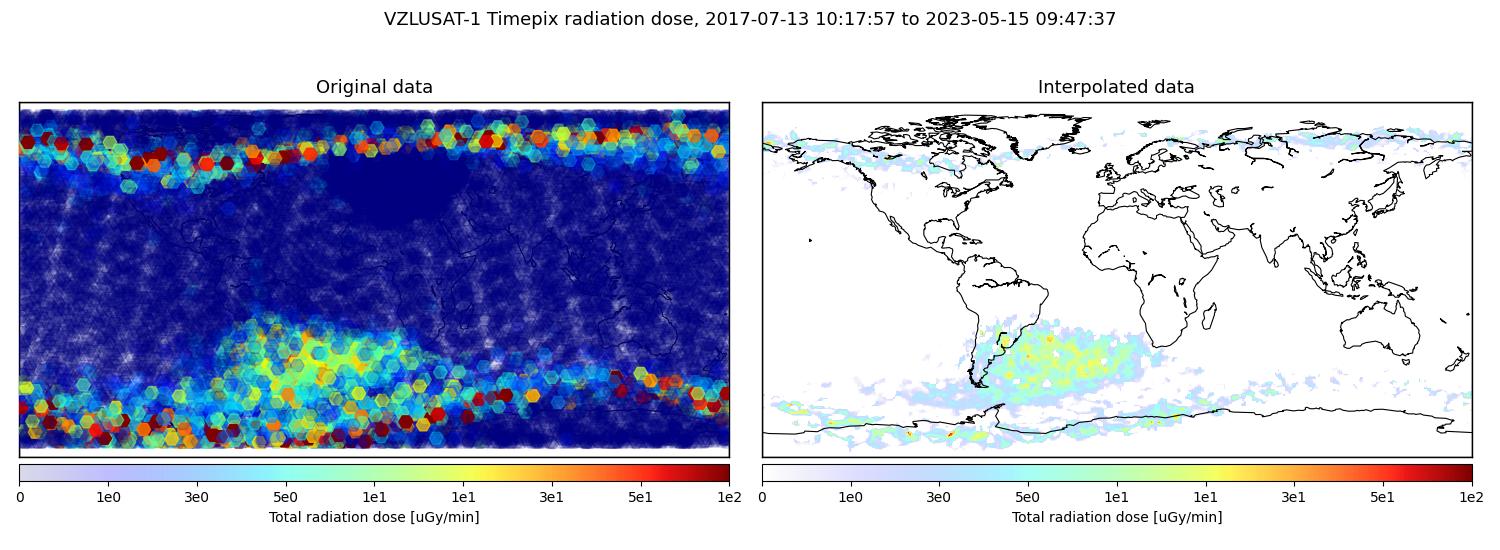
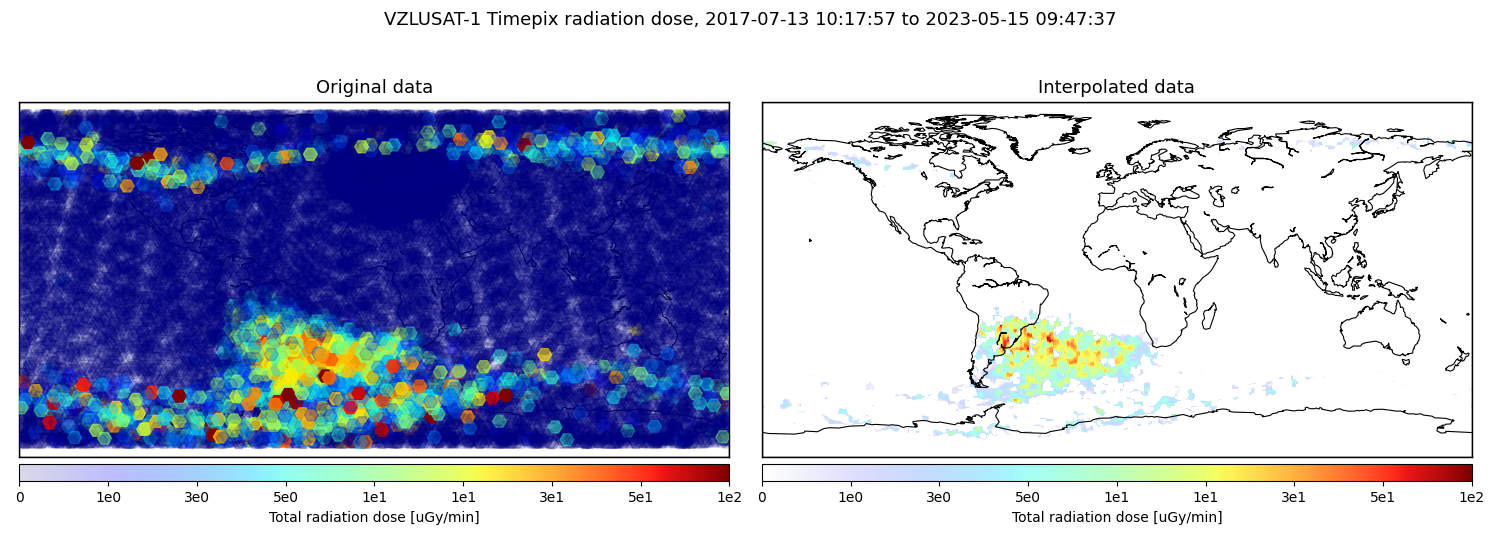
All valid full-resolution data measured by VZLUSAT-1. All data are stored separately in compressed tar ball. Unpack them by calling.
./data/extract_all.shThe data were inspected by hand an any images that contained invalid information (noise, confused sensor, etc) or data of other character than radiation (direct Sun illumination) were removed.
All particle types
./data/download_all.sh
./scripts/labelled_maps_plotter.py -d ./data/all/labelled
>>> CLICK HERE TO SPLIT TO PARTICLE TYPES <<<
Weak beta, Gamma, X-ray
./data/download_all.sh
./scripts/labelled_maps_plotter.py -d ./data/all/labelled --filter dot
Ions, Alpha
./data/download_all.sh
./scripts/labelled_maps_plotter.py -d ./data/all/labelled --filter "blob_branched blob_big blob_small"
Beta
./data/download_all.sh
./scripts/labelled_maps_plotter.py -d ./data/all/labelled --filter "track_straight track_lowres track_curly"
Provided scripts
We provided a set of rudimentary scripts, that can be used to plot and inspect the provided data. The scripts are meant to be used as a bases for further development of custom data processing adapters.
Prerequisites
To execute the attached scripts, Python3 needs to be installed.
The required Python dependencies are listed in the requirements.txt file.
Prepare the Python virtual environment (on Linux machine) by running
./create_python_env.shThen, the provided scripts can be directly called.
Map plotter
Here are example use-cases of the Map plotter.
The Map plotter was used to generate the maps within this README.
Display help:
./scripts/labelled_maps_plotter.py --helpRun on a particular folder with labelled data
./scripts/labelled_maps_plotter.py -d ./data/labelled/saa_and_polesShow map using selected subset of particle types
./scripts/labelled_maps_plotter.py -d ./data/labelled/planetary_sweeps/all --filter "track_straight track_lowres track_curly"Image browser
Display help:
./scripts/labelled_image_browser.py --helpStart at a specific file:
./scripts/labelled_image_browser.py -f ./data/labelled/planetary_sweeps/23_2023-01-16/1_fullresProvide a specific data directory:
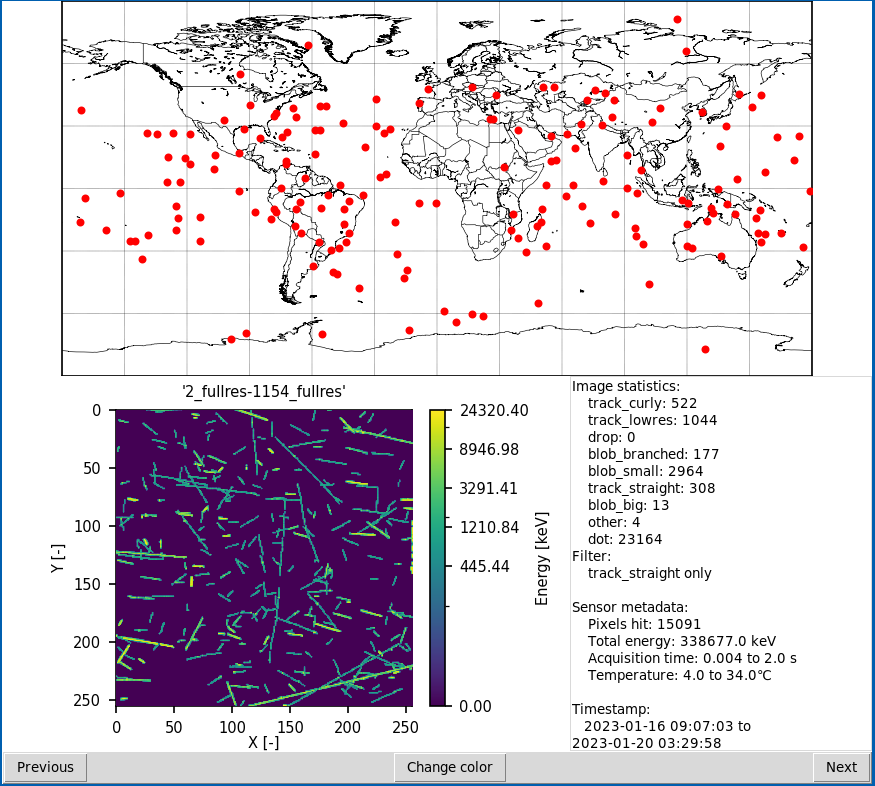
./scripts/labelled_image_browser.py -d ./data/labelled/saa_and_polesShow data batch aggregated over 30 consecutive measurements. You can move between batches of that size using the GUI buttons.
./scripts/labelled_image_browser.py -b 30Aggregate all files in the data directory (use the number of images as a batch size):
./scripts/labelled_image_browser.py --allDisplay only a specific class of particle tracks:
./scripts/labelled_image_browser.py --filter track_curlyImages which do not contain the selected class will be skipped. Allowed filter options are: dot, drop, track_curly, track_lowres, track_straight, blob_big, blob_branched, blob_small, other.
Example: show all track_straight-type particle tracks within a particular data folder:
./scripts/labelled_image_browser.py -d ./data/labelled/planetary_sweeps/23_2023-01-16 --all --filter track_straightNotes
- When providing a filename, do not use the suffixes such as
.statistics.txt,.clusters.txtor.metadata.txt - Arguments
-d,-band-fmay be used together

