Scrooge McDuck is a financial extension to DuckDB. The main goal of this extension is to support a set of aggregation functions and data scanners frequently used on financial data.
To build, type
make
To run, run the bundled duckdb shell:
./duckdb/build/release/duckdb
Then, load the Scrooge McDuck extension like so:
LOAD 'build/release/scrooge.duckdb_extension';To reproduce this demo, you must have:
- A build of Scrooge McDuck.
- The latest python libraries of DuckDB and Plotly
pip install duckdb plotly - Download and unzip the example dataset.
To start, we need to load the libraries we will be using in this tutorial.
import duckdb
import plotly.graph_objects as goTo load Scrooge McDuck, we simply have to execute the LOAD command together with the compiled path of the library.
con = duckdb.connect()
con.execute("LOAD 'build/release/scrooge.duckdb_extension';")We only have one table in our dataset, the crypto_ticks, that holds the price (to USD) of a cryptocurrency at a given time.
con.execute("""CREATE TABLE crypto_ticks (
               "time" TIMESTAMP,
               symbol TEXT,
               price DOUBLE PRECISION,
               day_volume NUMERIC
);""")Our dataset is a CSV file; hence to load it we simply need a COPY ... FROM... statement.
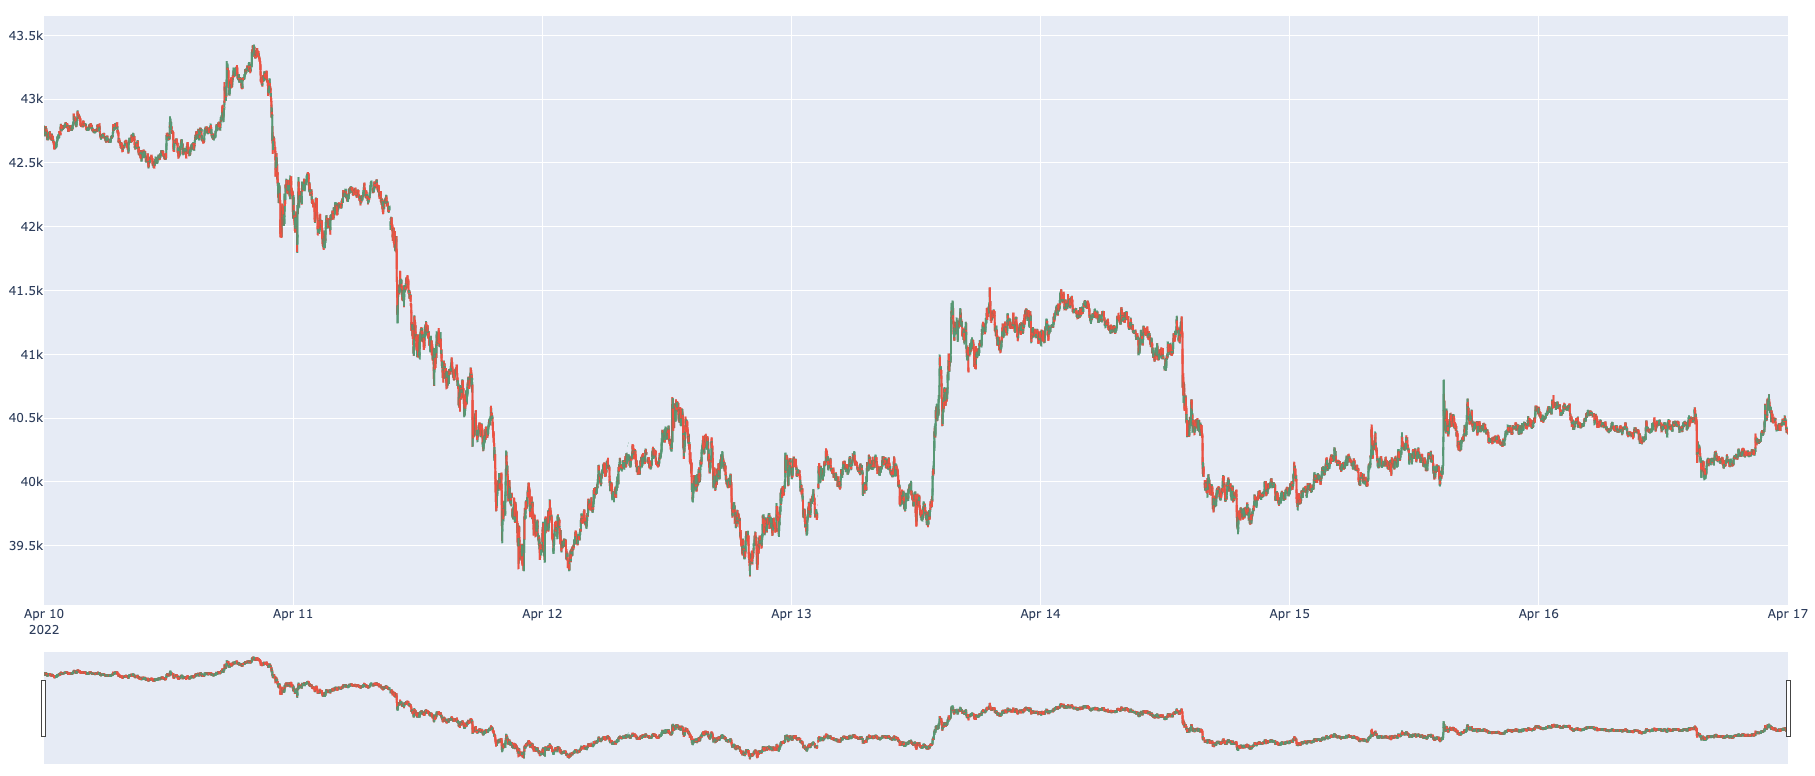
con.execute("COPY crypto_ticks FROM 'tutorial_sample_tick.csv' CSV HEADER;")Here we generate our main aggregation using the domain-specific functions from Scrooge McDuck. To generate these aggregations, we must take, from within our time bucket, the open and close values of a cryptocurrency and their high and low values. In this case, we focus only on the week from 10-17 of April 22.
Since DuckDB has a tight integration with Pandas, to facilitate plotting we export our query result to a Pandas Dataframe with the .df() function.
df = con.execute("""SELECT TIMEBUCKET(time,'1M'::INTERVAL) AS bucket,
                           FIRST_S(price, time) AS "open",
                           MAX(price) AS high,
                           MIN(price) AS low,
                           LAST_S(price, time) AS "close",
                    FROM crypto_ticks
                    WHERE symbol = 'BTC/USD'
                    AND time >= '2022-04-10'::TIMESTAMPTZ
                    AND time <= '2022-04-17'::TIMESTAMPTZ
GROUP BY bucket""").df()To plot, we use the Candlestick aggregation of Plotly on our generated dataframe.
fig = go.Figure(data=[go.Candlestick(x=df['bucket'],
                open=df['open'],
                high=df['high'],
                low=df['low'],
                close=df['close'])])
fig.show()
The result of our Candle-Stick aggregation can be seen below:
