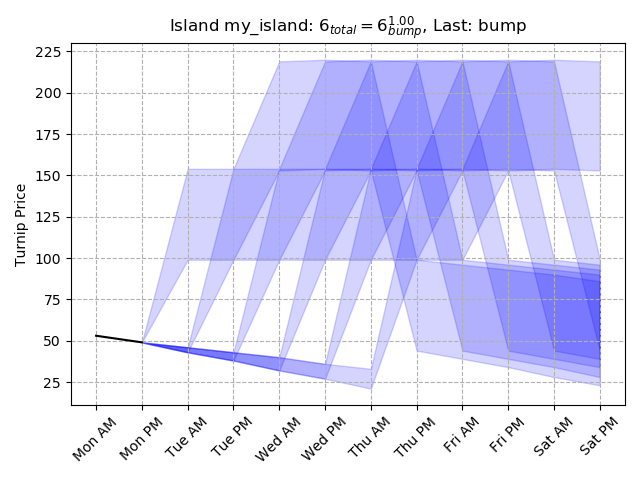
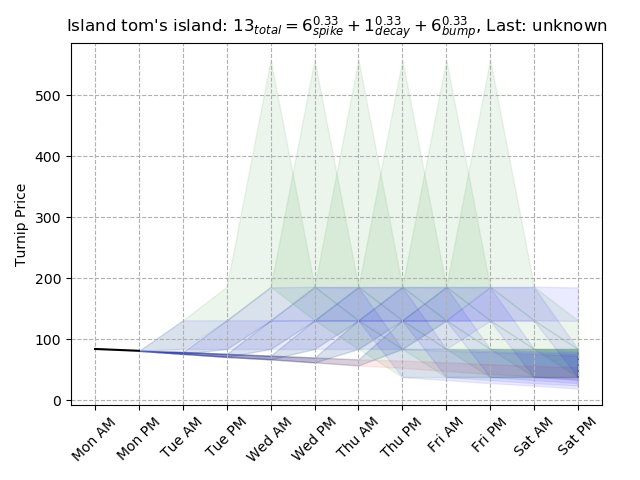
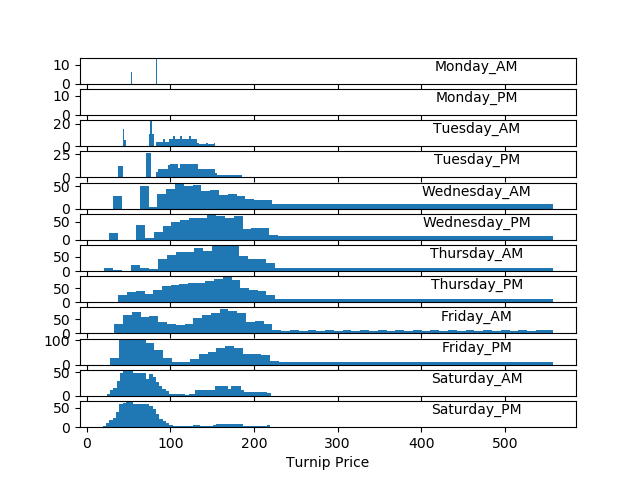
They are high in vitamin K.
This is a fork of Turnips by nago.
This fork contains the hacked together changes that are used within Turnip Bot, a discord bot. The changes are explained as follows.
After creating a model with prices = turnips.meta.MetaModel.blank()
Explained down below you can do the following functions.
prices.summary() Instead of printing the normal summary you will be provided
a dict like follows.
{
   "Monday_AM":{
      "price":"36 - 154",
      "likely":"66 - 72",
      "chance":"11.55%"
   },
   "Monday_PM":{
      "price":"66 - 66",
      "likely":"66 - 66",
      "chance":"100.00%"
   },
   ...
}It's a Stalk Market price analysis library. If you give it the prices observed on your island, it will help you predict your prices for the rest of the week.
Stalk Market prices in AC:NH are determined by four possible patterns you can get for the week. Each pattern has a distinctive shape; by entering in prices already seen, we can usually rule out many possibilities.
In some cases, some patterns look too close to each other, though; this happens often between a "Decay" week and a "Spike" week, which can look identical until the spike happens.
This is really meant as a library and not as an end-user tool, but there is a little interface you can configure to see some graphs.
Look at sample.yml or sample.json --both file formats work, use whichever format you are most comfortable with.
Edit them to reflect your and your friends' islands as best as you are
able into a file named e.g. islands.json
The json file should look like this:
{ "islands": {
    "my_island": {
      "initial_week": true,
      "timeline": {
        "Sunday_AM": 110,
        "Monday_AM": 53,
        "Monday_PM": 49
      }
    },
    "tom's island": {
      "previous_week": "bump",
      "timeline": {
        "Sunday_AM": 93,
        "Monday_AM": 84,
        "Monday_PM": 81
      }
    }
  }
}
Some notes on this format:
- Set "initial_week" to true if the owner of that island has purchased turnips on their own island for the first time that week. This forces a BumpModel week, but obscures your buy price.
- Set "previous_week" to the name of the kind of week you had last week: "Bump", "Spike", "Decay", "Triple". This will adjust the statistics to show you the most likely week you're having now.
- Use "Sunday_AM" to set the purchase price on your island, NOT the price you purchased your turnips at. (e.g., not your friend's island's prices.)
When you're good and ready, you can run turnips --plot islands.json
from the command line to see a multi-group probability report and
forecast.
You can look at sample.txt in the repo for an example of what the multi-island forecast looks like via text. Notably, each island gets:
- A list of possible models that island is following, grouped by model
type. (Triple, Spike, Decay, Bump)
- If a model group has only one viable model left, that model is printed without odds.
- If a model group has several models left, a summary is printed for just that model group.
- If an island has at least two models left in any category, a summary is printed for that island.
- A summary is printed in aggregate for all the islands, giving your friend group an idea of what prices they can expect for the week.
If you use --plot, you'll also see some graphs and charts that help
illustrate your Stalk Market Futures.
The core of this library are "Models", each Model is a blueprint for the type of week you can have. You can create model groups, like SpikeModels or TripleModels which collect blueprints for those types of weeks in particular.
At the top is the MetaModel, which collects every last kind of week you can possibly have.
The library can be used by creating a MetaModel() object, like this:
>>> prices = turnips.meta.MetaModel.blank()
then you can get a report:
>>> prices.report()
Or just the probability for the week:
>>> prices.summary()
If you know what price was being offered on your island and you did not buy turnips from Daisy Mae for the first time, you can narrow down the possibilities:
>>> prices = turnips.meta.MetaModel.blank(98)
To start entering prices, start at Monday_AM whenever possible, and then:
>>> prices.fix_price('Monday_AM', 53)>>> prices.fix_price('Monday_PM', 49)
or, you can use numerical digits to represent the timeslots; this is equivalent:
>>> prices.fix_price(2, 53)>>> prices.fix_price(3, 49)
For more advanced usages, take a look at archipelago.py which has
Archipelago and Island classes that aggregate information for a
group of islands (you and your friends) or the data for a single island
(you) and can help print graphs and forecasts.


