Classifying galaxies using various machine learning models into 3 categories(merger,elliptical,spiral)
- Python 3.6+
- Jupyter Notebook
Libraries
- scikit-learn
- numpy
- matplotlib
- dtreeplt

Galaxy Zoo is a crowdsourced astronomy project which invites people to assist in the morphological classification of large numbers of galaxies. For this project, I limited the data to only 3 types of galaxies. The data set is a numpy array containing features and classification of 780 galaxies. This dataset is a sample of galaxies where at least 20 human classifiers (volunteers) have come to a consensus on the galaxy type. Hence, this is a high quality dataset
The features that I have used to do the galaxy classification are colour index, adaptive moments, eccentricities and concentrations. These features are provided as part of the SDSS catalogue.
Colour indices are the colour (u-g, g-r, r-i, and i-z) filters from SDSS. Studies of galaxy evolution tell us that spiral galaxies have younger star populations and therefore are 'bluer' (brighter at lower wavelengths). Elliptical galaxies have an older star population and are brighter at higher wavelengths ('redder').

Eccentricity approximates the shape of the galaxy by fitting an ellipse to its profile. Eccentricity is the ratio of the two axis (semi-major and semi-minor). The De Vaucouleurs model was used to attain these two axis. To simplify the experiment, I used the median eccentricity across the 5 filters.

Adaptive moments also describe the shape of a galaxy. They are used in image analysis to detect similar objects at different sizes and orientations. I used the fourth moment here for each band.
Concentration is similar to the luminosity profile of the galaxy, which measures what proportion of a galaxy's total light is emitted within what radius. A simplified way to represent this is to take the ratio of the radii containing 50% and 90% of the Petrosian flux. The Petrosian method allows to compare the radial profiles of galaxies at different distances. If you are interested, you can read more here on the need for Petrosian approach.
For these experiments, I will define concentration as: conc = petro R50/petro R90 , using concentrations from u,r and z bands.

Decision Tree Accuracy: 0.787179487179
Random Forest Accuracy: 0.873076923077
Neural Network Classification Accuracy: 0.8760683760683761
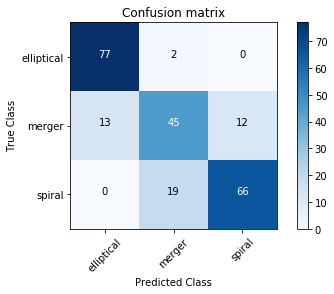
Confusion matrix

- Galaxy Zoo
- Data Driven Astronomy Course offered by the University of Sydney