dplyr.extras
The goal of dplyr.extras is to …
Installation
You can install the development version of dplyr.extras from GitHub with:
# install.packages("devtools")
devtools::install_github("vituri/dplyr.extras")
Motivation
dplyr.extras intends to:
- make it easy to apply functions conditionally in the middle of a pipe;
- modify and subset vectors in a “pipeable” manner, like we do with
dataframes using
dplyr::filteranddplyr::mutate; - generalize functions that “glue” dataframes to an existing one, like
dplyr::add_count.
Examples
For the examples, consider this dataframe:
library(dplyr.extras)
#> Carregando pacotes exigidos: dplyr
#>
#> Attaching package: 'dplyr'
#> The following objects are masked from 'package:stats':
#>
#>     filter, lag
#> The following objects are masked from 'package:base':
#>
#>     intersect, setdiff, setequal, union
#> Carregando pacotes exigidos: magrittr
set.seed(1)
n = 10
df =
  dplyr::tibble(
    a = runif(n = n)
    , b = c('a', rep('b', 2), rep('c', 3), rep('d', 4))
    )

df
#> # A tibble: 10 × 2
#>         a b
#>     <dbl> <chr>
#>  1 0.266  a
#>  2 0.372  b
#>  3 0.573  b
#>  4 0.908  c
#>  5 0.202  c
#>  6 0.898  c
#>  7 0.945  d
#>  8 0.661  d
#>  9 0.629  d
#> 10 0.0618 d
Conditionally apply a function in the middle of a pipe
Suppose we are in a shiny app and there is a filter in a widget; it
displays the letters in df$b and also the string all. If the
selected string is all, we don’t want to filter our df. This can be
done in a pipe as this:
selected_string = 'all' # from the input$selected_string

df %>%
  {
    if (selected_string == 'all') {
      (.)
    } else {
      (.) %>% filter(b %in% selected_string)
    }
  } # %>%
#> # A tibble: 10 × 2
#>         a b
#>     <dbl> <chr>
#>  1 0.266  a
#>  2 0.372  b
#>  3 0.573  b
#>  4 0.908  c
#>  5 0.202  c
#>  6 0.898  c
#>  7 0.945  d
#>  8 0.661  d
#>  9 0.629  d
#> 10 0.0618 d
#  ... the rest of the pipe
With dplyr.extras, this can be a bit shorter:
df %>%
  map_if_true(condition = selected_string != 'all', .f = . %>% filter(b %in% selected_string)) # %>%
#> # A tibble: 10 × 2
#>         a b
#>     <dbl> <chr>
#>  1 0.266  a
#>  2 0.372  b
#>  3 0.573  b
#>  4 0.908  c
#>  5 0.202  c
#>  6 0.898  c
#>  7 0.945  d
#>  8 0.661  d
#>  9 0.629  d
#> 10 0.0618 d
  # ...
There is also the variant
df %>%
  map_if_condition(condition, .f_if_true, .f_if_false)
where we can apply two different functions, depending on the truthy of
condition.
As another example: using dbplyr to query a table in a database, we
can create a function like this
get_data_from_my_table = function(con, var1 = NULL, var2 = NULL, var3 = NULL) {
  tbl(con, 'table_name') %>%
    map_if_true(!is.null(v1), . %>% filter(Column1 %in% var1)) %>%
    map_if_true(!is.null(v2), . %>% filter(Column2 %in% var2)) %>%
    map_if_true(!is.null(v3), . %>% filter(Column3 %in% var3)) %>%
    # ...
    collect()
}
to query data with the filters we give. If var1 is NULL, for
example, we won’t filter the values in Column1 of our table, and so on.
Filtering and modifying vectors
Suppose we want to do the following: given an integer vector x
x = 1:50
x
#>  [1]  1  2  3  4  5  6  7  8  9 10 11 12 13 14 15 16 17 18 19 20 21 22 23 24 25
#> [26] 26 27 28 29 30 31 32 33 34 35 36 37 38 39 40 41 42 43 44 45 46 47 48 49 50
we want to:
- keep only the even numbers of x;
- add 1 to all numbers of x;
- multiply by -1 the numbers less than 25;
- sum the result
# dplyr.extras approach can be "piped"
x %>%
  vec_filter(\(x) x %% 2 == 0) %>% # keep the even
  vec_mutate(\(x) x+1) %>% # sum 1
  vec_mutate(\(x) -x, \(x) x < 25) %>% # multiply by -1 only those that satisfy x < 25
  sum()
#> [1] 389
Compare it with the base R approach:
y = x[x %% 2 == 0]
z = y + 1
w = z
id = w < 25
w[id] = - w[id]
sum(w)
#> [1] 389
Another example
Let
x = 1:1e5Get the sum of all odd numbers in x:
x %>% vec_filter(\(x) x %% 2 == 0) %>% sum()
#> [1] 2500050000
Get all numbers where the square of it is less than 10000:
x %>% vec_filter(\(x) x^2 < 10000)
#>  [1]  1  2  3  4  5  6  7  8  9 10 11 12 13 14 15 16 17 18 19 20 21 22 23 24 25
#> [26] 26 27 28 29 30 31 32 33 34 35 36 37 38 39 40 41 42 43 44 45 46 47 48 49 50
#> [51] 51 52 53 54 55 56 57 58 59 60 61 62 63 64 65 66 67 68 69 70 71 72 73 74 75
#> [76] 76 77 78 79 80 81 82 83 84 85 86 87 88 89 90 91 92 93 94 95 96 97 98 99
Modifying dataframes
Fill the NA values of a dataframe using another column:
# take values from column b when a is NA
df =
  tibble::tibble(
  a = 1:10 %>% vec_mutate(NA, \(x) x %% 2 == 0)
  ,b = -(1:10)
)

df
#> # A tibble: 10 × 2
#>        a     b
#>    <int> <int>
#>  1     1    -1
#>  2    NA    -2
#>  3     3    -3
#>  4    NA    -4
#>  5     5    -5
#>  6    NA    -6
#>  7     7    -7
#>  8    NA    -8
#>  9     9    -9
#> 10    NA   -10
df %>%
dplyr::mutate(
if_a_is_na_then_b = a %>% vec_mutate(b, is.na)
)
#> # A tibble: 10 × 3
#> a b if_a_is_na_then_b
#> <int> <int> <int>
#> 1 1 -1 1
#> 2 NA -2 -2
#> 3 3 -3 3
#> 4 NA -4 -4
#> 5 5 -5 5
#> 6 NA -6 -6
#> 7 7 -7 7
#> 8 NA -8 -8
#> 9 9 -9 9
#> 10 NA -10 -10Comparing vector manipulation with purrr
The purrr package has two functions that are analogue to vec_mutate
and vec_filter, respectively: purrr::keep and purrr::modify.
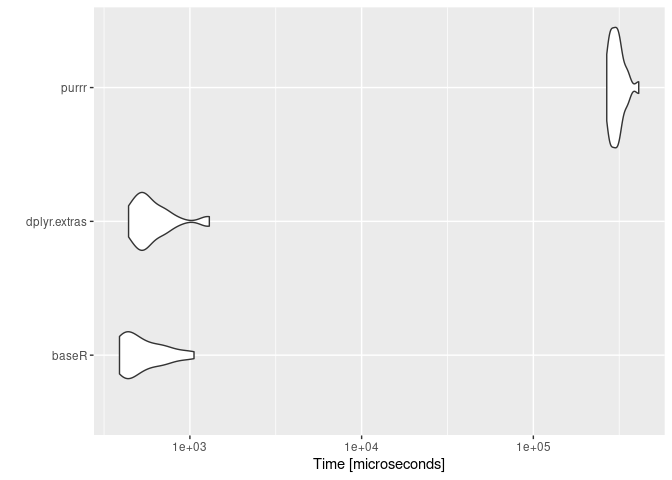
However, dplyr.extras is faster because it only accepts vectors and
vectorized functions, and the result is a vector (not a list).
x = 1:1e5

mbm = microbenchmark::microbenchmark(
  baseR = {
    x[x^2 <= 5000]
  }
  ,dplyr.extras = {
    x %>% vec_filter(~ .x^2 <= 5000)
  }
  ,purrr = {
    x %>% purrr::keep(~ .x^2 <= 5000)
  }

  ,times = 25L
)

mbm
#> Unit: microseconds
#>          expr        min        lq        mean     median         uq        max
#>         baseR    389.042    421.88    552.7139    469.952    671.028   1056.618
#>  dplyr.extras    439.333    508.23    628.6824    561.893    672.648   1297.781
#>         purrr 267616.134 282738.81 307406.1830 301738.524 318851.278 410925.056
#>  neval
#>     25
#>     25
#> 25ggplot2::autoplot(mbm)x = 1:1e5
mbm2 = microbenchmark::microbenchmark(
baseR = {
ids = x <= 10000
x[ids] = x[ids] + 2
x
}
,dplyr.extras = {
x %>% vec_mutate(~ .x + 2, ~ .x <= 10000)
}
,purrr = {
x %>% purrr::modify_if(.f = ~ .x + 2L, .p = ~.x <= 10000)
}
,times = 25L
)
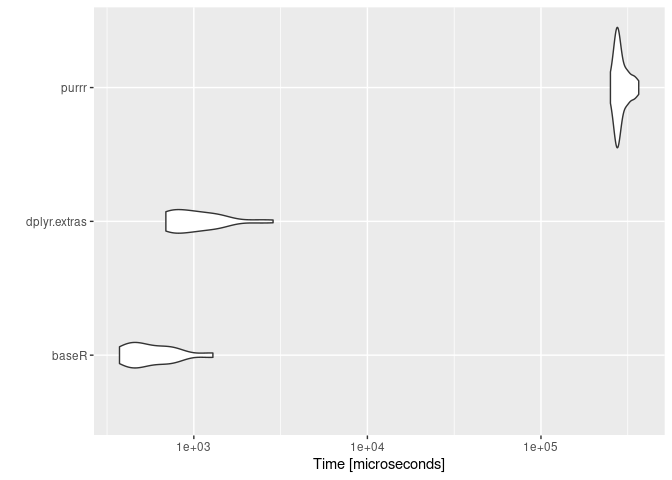
mbm2
#> Unit: microseconds
#> expr min lq mean median uq
#> baseR 373.026 436.768 609.4924 520.123 699.230
#> dplyr.extras 690.105 732.597 1114.8807 971.928 1314.007
#> purrr 251271.782 271122.177 289337.6700 278473.997 303992.804
#> max neval
#> 1287.846 25
#> 2860.998 25
#> 365765.380 25ggplot2::autoplot(mbm2)
