This project illustrates how you can easily add a trendline to your Highchart charts.
Note: If you are looking for a more complete implementation, checkout the highcharts-regression plugin.
Include the regression.js script into your HTML page.
Given your source data array, supply a function which calls fitData(<source>).data to produce the regression data for the trendline.
E.g.
// E.g. source data
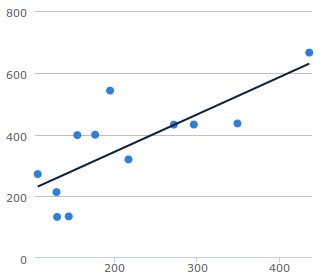
var sourceData = [
[106.4, 271.8], [129.2, 213.4],
[295.6, 432.3], [154.4, 398.1],
[129.9, 133.2], [271.5, 432.1],
[144.0, 134.7], [176.0, 399.2],
[216.4, 319.2], [194.1, 542.1],
[435.6, 665.3], [348.5, 435.9]
];
var chart_linear = new Highcharts.Chart({
chart: {
renderTo: 'linear'
},
plotOptions: {
series: {
enableMouseTracking: false
}
},
series: [{
type: 'scatter',
data: sourceData
},
{
type: 'line',
marker: { enabled: false },
/* function returns data for trend-line */
data: (function() {
return fitData(sourceData).data;
})()
}]
});Checkout the demo HTML files for examples of how to plot various trendlines.
-
-
Linear Regression - One dimensional data
-
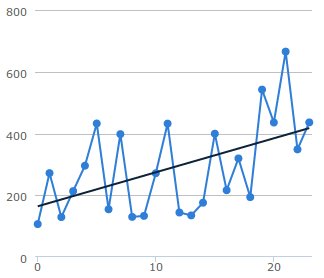
Line Regression (X axis set to category)
-
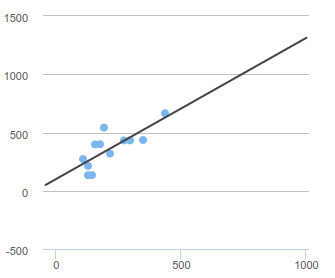
Linear Regression - With Projection


The code for the regression.js script was extracted from jqplot.trendline.js, by Chris Leonello.