Matplotlib style sheet to create plots for scientific journals
To use this style place
Place the file 'Rplot.mplstyle' in the directory ...\Lib\site-packages\matplotlib\mpl-data\stylelib
import numpy as np
import matplotlib.pyplot as plt
# make matplotlib to use the Rplot style sheet
plt.style.use('Rplot')

# data
y = np.sin(np.linspace(0, 2 * np.pi));
x = np.linspace(0,len(y),len(y));

# initialize a figure with proper figure size and the axis
Figure = plt.figure(figsize=(8,3));
Figure_Axis = plt.subplot(111)

# plot the data
Figure_Axis.plot(x,y, 'r-o',label="Legend");

# set axis labels
Figure_Axis.set_xlabel(r'Time [s]');
Figure_Axis.set_ylabel(r'Acceleration [g]');

# set tick mark spacing
plt.yticks(np.arange(min(y), max(y)+1, 0.5));
plt.xticks(np.arange(min(x), max(x)+1, 10));

# set x and y limit
Figure_Axis.set_xlim([0,50]);
Figure_Axis.set_ylim([-1,1]);

# enable grid lines
Figure_Axis.grid(b=True, which='major', color='k', linestyle='-')
Figure_Axis.grid(b=True, which='minor', color='k', linestyle='-', alpha=0.2)

# show the legend on the top outside the figure
Figure_Axis.legend(bbox_to_anchor=(0,1.02,1,0.2), loc="lower left",mode="expand", borderaxespad=0, ncol=5);

# have a tight layout to remove spaces
Figure.tight_layout();

# save the figure
plt.savefig('Example.png', bbox_inches = 'tight', dpi = 800); 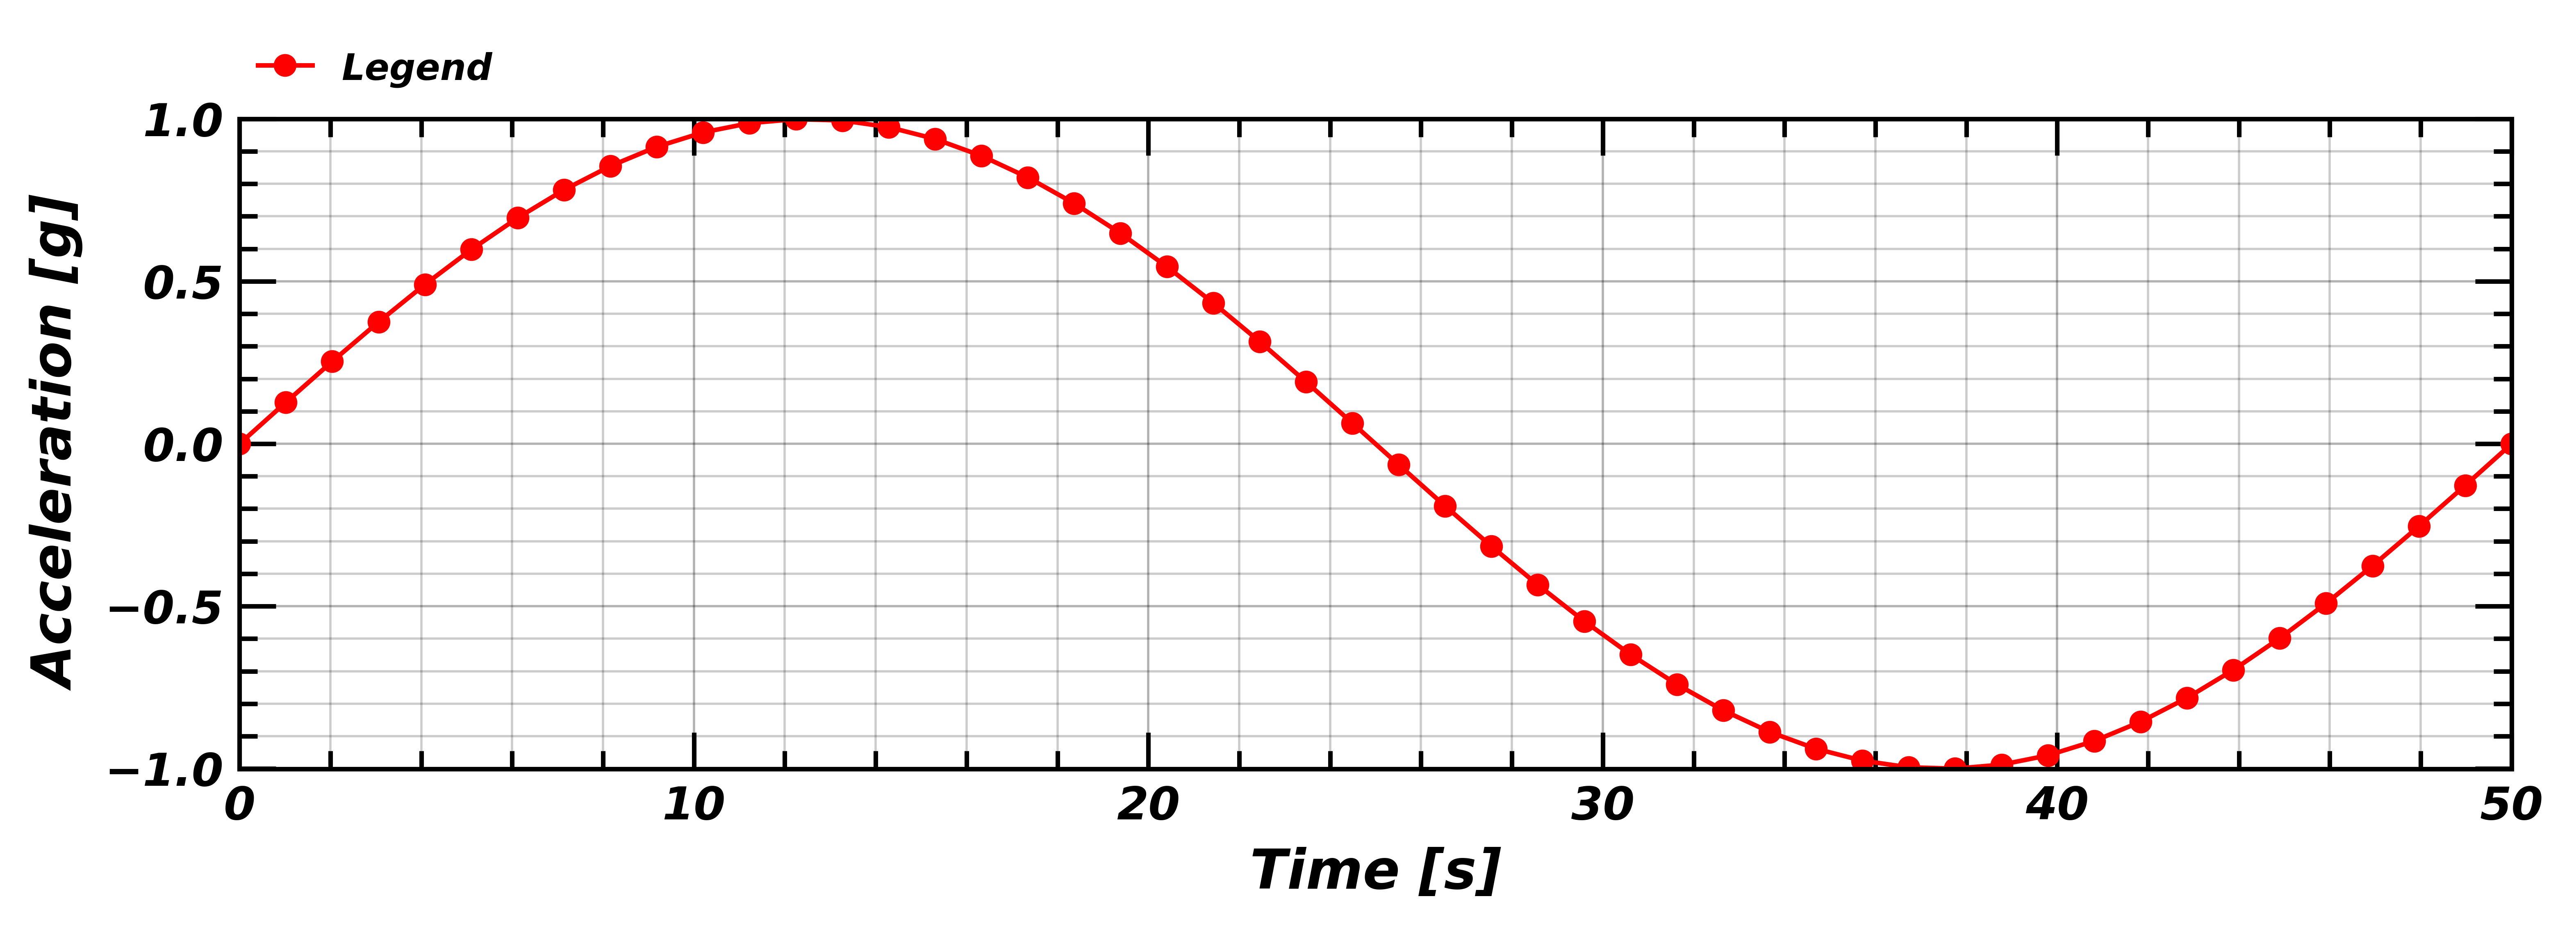
Send your comments, bugs, issues and features to add to Sumeet Kumar Sinha at sumeet.kumar507@gmail.com. Please feel free to create issues on https://github.com/SumeetSinha/DAQData/issues