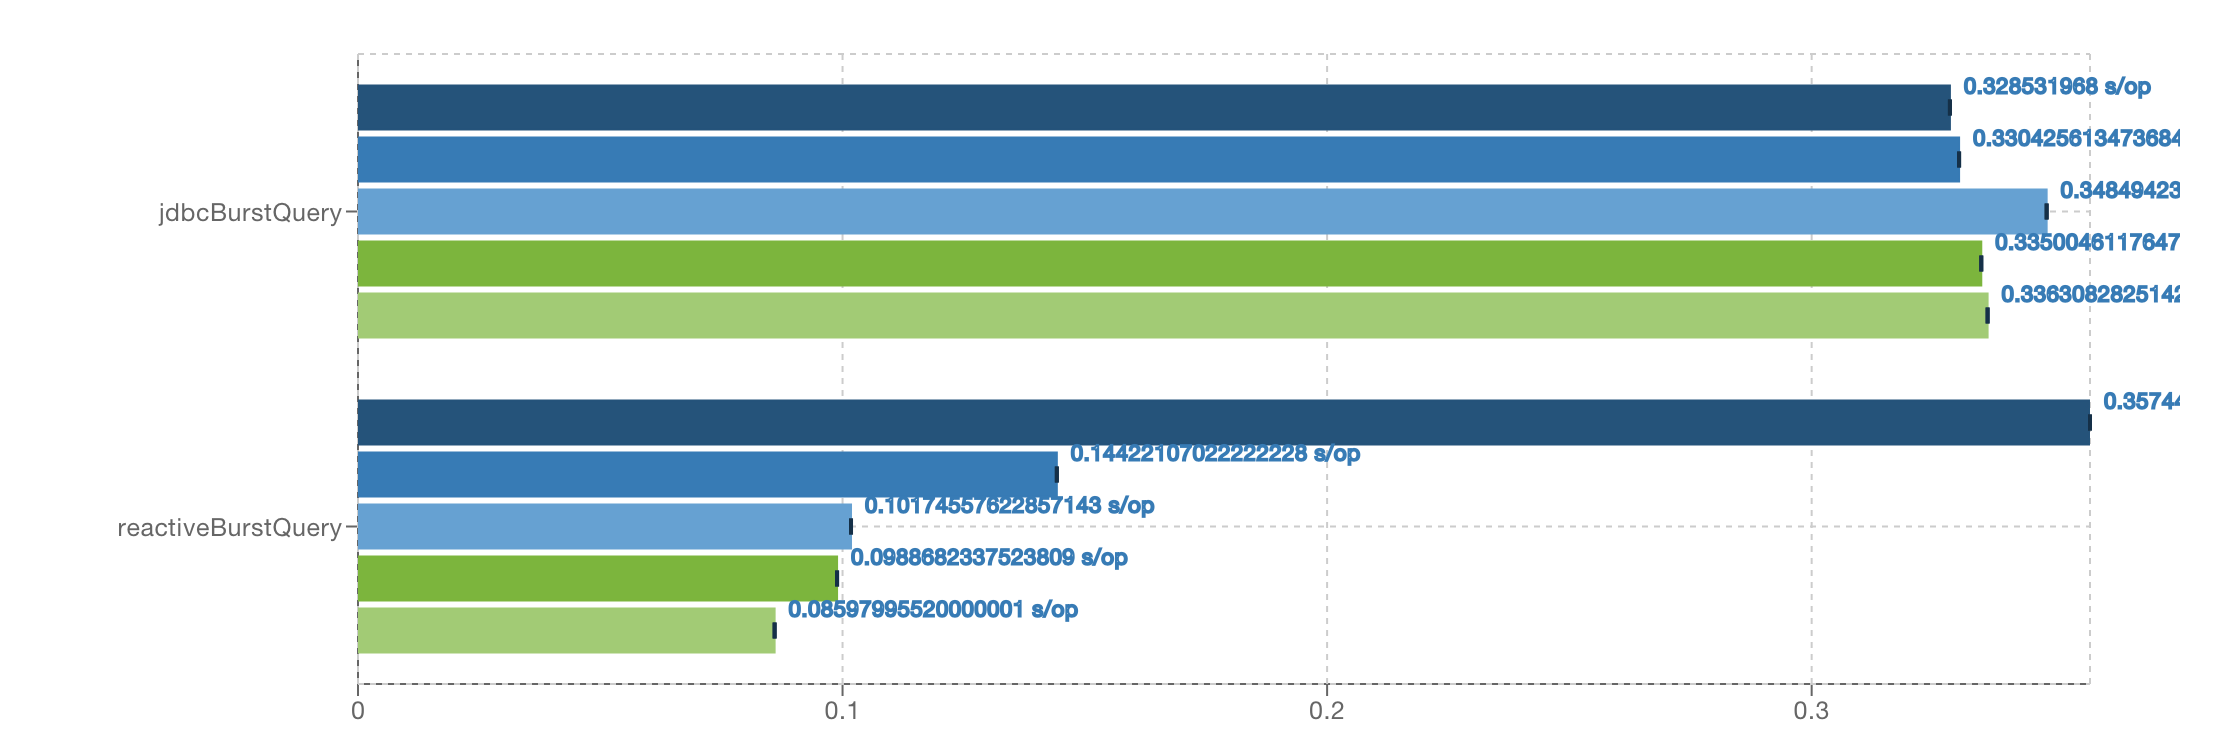
What does this benchmark measure ?
Client latencies over a single connection to PostgreSQL using a bunch clients under various concurrency configuration.
The benchmark uses JMH for execution although it is not a micro-benchmark. JMH is mostly used as an engine for running the benchmark that provides lot of flexibility and reporting features.
Buld the fat jar
> mvn clean packageRun it
> java -jar target/benchmark.jarThe benchmark is executed with an embedded database on localhost running a vanilla sql statement with both JDBC and the Reactive Postgres Client. This is just for demonstating the bare usage, results cannot be trusted.
Using an external database, executing a specific statement:
java -jar target/jmh-benchmark.jar \
   -p pipelining=1,2,4,16
   -p connectUri=postgres://benchmarkdbuser:benchmarkdbpass@TFB-database:5432/hello_world \
   -p sql="SELECT * from World where id=1"
-p count=5000-
pipeliningdefines the pipeling applied to the connection (only effective for the Reactive PG client -
connectUrifollows the libpq format -
sqlis the SQL statement to execute, note it cannot contain a,char as this is used as a separator by JMH -
countthe number of times the prepared statement is executed
Each operation samples the time to execute the total number of times the prepared statement
is executed, in the example above it measures how long it takes to execute SELECT * from World where id=1
5000 times with JDBC and the Reactive PG client with pipelining values 1, 2, 4 and 16.
The pipelining effect varies according to:
-
the database latency: increased latencies increase pipelining benefits
-
the statement latency: expensive queries don’t benefit from latency
Those are the results gathered using dedicated hardware, don’t trust them instead
-
run them on your own hardware
-
review the benchmark
This benchmark executed the example above.
|
Warning
|
The two results are not normalized, the 100µs latency executes the 5000 queries in about 300ms, the 1ms latency executes the 5000 queries in about 13 seconds. |

