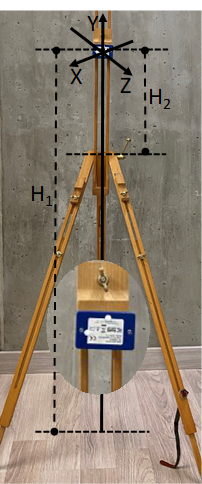
This repository is containing data analysis of sensor node attached to a dedicated mechanism shown in figure below for collecting postural sway data for the classification of the postural sway behaviour.
Experimental surveys aimed to acquire the dataset have been performed by using the dedicated structure, shown in Fig. 1. This set-up allows for reproducing different dynamics, thus resembling the following movements:
- Stable behaviors (ST),
- Antero-Posterior (AP),
- Medio-Lateral (ML) dynamics,
- Unstable behaviors (UNST).
The sensor node is located on the structure in a position corresponding to the user chest, where H1 is the distance between the sensor node and the bottom joint (on the floor), while H2 is the distance between the node and the belt joint. ML displacements are obtained by manually tilting the system around the belt joint, while APs are generated by exploiting tilting around the bottom joint.
The sensor setup is depicted in the picture below.
Data contains extracted features from the accelerometer data sampled at 100Hz . Two features are extracted from the data namely Antero-Posterior Displacement (DAP) and Medio-Lateral displacement (DML).
Starting from three acceleration components, time evolutions of the Antero-Posterior and Medio-Lateral displacement (DAP and DML) have been estimated by the following relationships
H1 and H2 are the distance between the sensor node and the bottom joint (on the floor) and the belt joint respectively.
The dataset is organized as follows:
- In each folder Case_x you can find the time evolution of [DAP DML] for several examples of Standing, AP, ML, Unstable dynamics, obtained by the above-described set-up.
- Each case represents a different positioning of the sensor node (different heights H1 and H2).
Quick Note
Plotting DAP against DML you can find the stabilogram for each dynamic, and then you can save as images to be used for training and testing AI classification tool. If you prefer stabilograms centered around zero DAP-DML values, you have just to remove the mean value from time-series.
To be able to run the code, you need to install the following libraries:
matplotlib==3.6.2
numpy==1.21.5
pandas==1.4.2
pycaret==3.0.0rc4
scikit_learn==1.2.0
scipy==1.7.3
tensorflow==2.10.0
tensorflow_text==2.11.0
To install the libraries, you can use the following command:
pip install -r requirements.txt