英文 | 中文
A visualization tool that monitors the status of machines and services in NebulaGraph clusters.
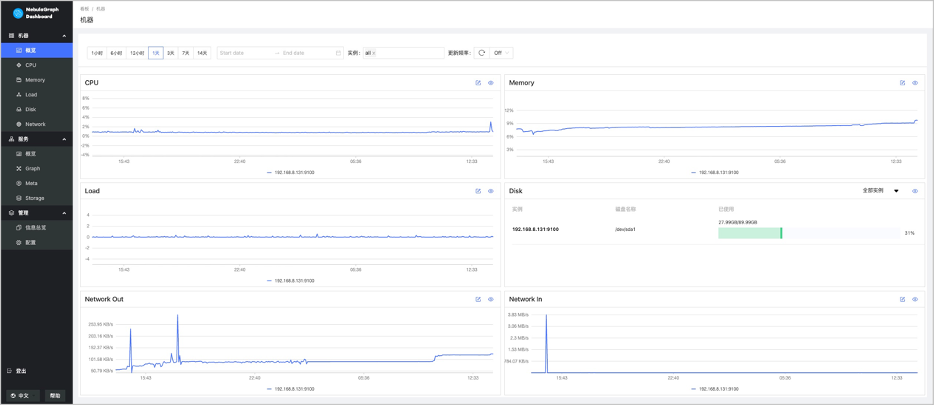
NebulaGraph Dashboard Community Edition (Dashboard for short) is a visualization tool that monitors the status of machines and services in NebulaGraph clusters.
- The status of all the machines in clusters, including CPU, memory, load, disk, and network.
- The information of all the services in clusters, including the IP addresses, versions, and monitoring metrics (such as the number of queries, the latency of queries, the latency of heartbeats, and so on).
- The information of clusters, including the information of services, partitions, configurations, and long-term tasks.
- Set how often the metrics page refreshes.
- Check NebulaGraph config info.
You can use Dashboard in one of the following scenarios:
- You want to monitor key metrics conveniently and quickly, and present multiple key information of the business to ensure the business operates normally.
- You want to monitor clusters from multiple dimensions (such as the time, aggregate rules, and metrics).
- After a failure occurs, you need to review it and confirm its occurrence time and unexpected phenomena.
The NebulaGraph Dashboard docuementaion is available at Documentation
If you're interested in contributing to the NebulaGraph Dashboard project:
- Learn hot wo set up you local environment, in developer guide
The version correspondence between NebulaGraph and Dashboard Community Edition is as follows.
| NebulaGraph Version | Dashboard Version |
|---|---|
| 3.4.x | 3.4.0 |
| 3.3.x | 3.2.0 |
| 2.5.0 ~ 3.2.0 | 3.1.0 |
| 2.5.x ~ 3.1.0 | 1.1.1 |
| 2.0.1 ~ 2.5.1 | 1.0.2 |
| 2.0.1 ~ 2.5.1 | 1.0.1 |