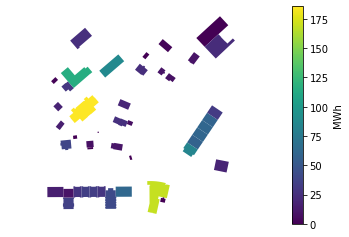
This code takes data from Honeybee pickled files containing solar hourly energy generation per each module and extracts statistics, 3D graphs, plots, etc.
- a pickled dataframe containing hourly data for solar production of each module on building envelopes, obtained by tassellation of built surface. Such data can be obtained, given a 3D geometry input, via a Honeybee Radiance+Daysim based workflow in Rhino Grasshopper, such as this one. The dataframe should look like this (shape: 8760 x n):
| datetime | 0 | 1 | 2 | 3 | 4 |
|---|---|---|---|---|---|
| 2005-01-01 05:05:00 | 0 | 0 | 0 | 0 | 0 |
| 2005-01-01 06:05:00 | 0 | 0 | 0 | 0 | 0 |
| 2005-01-01 07:05:00 | 0 | 0 | 0 | 0 | 0 |
| 2005-01-01 08:05:00 | 1 | 1 | 1 | 1 | 1 |
| 2005-01-01 09:05:00 | 10 | 10 | 10 | 10 | 15 |
| 2005-01-01 10:05:00 | 13 | 13 | 13 | 13 | 62 |
| 2005-01-01 11:05:00 | 23 | 23 | 23 | 23 | 46 |
| 2005-01-01 12:05:00 | 12 | 12 | 12 | 12 | 12 |
| 2005-01-01 13:05:00 | 11 | 11 | 11 | 11 | 11 |
| 2005-01-01 14:05:00 | 9 | 9 | 9 | 9 | 8 |
- a dataframe containing the coordinates of each module's vertices (1st vert, 2nd vert, 3rd vert, 4th vert, 1st vert to close the polyline), and the index of the building, row, position in a row it belongs to. Such data can be obtained from Rhino Grasshopper opportune manipulation. The dataframe should look like this (shape: n x 7):
| BLDGID | SRFID | ROWID | PANELID | PANELCOORDINATES | ROOF T/F | |
|---|---|---|---|---|---|---|
| 0 | 1013643 | 0 | 2 | 0 | -20.215867 31.742712 429.776565 -20.758787 30.561514 429.779312 -20.031812 30.228196 430.134322 -19.488892 31.409395 430.131575 -20.215867 31.742712 429.776565 | True |
| 1 | 1013643 | 0 | 2 | 1 | -20.942841 32.076031 429.421584 -21.485762 30.894832 429.424331 -20.758787 30.561515 429.779342 -20.215867 31.742713 429.776595 -20.942841 32.076031 429.421584 | True |
| 2 | 1013643 | 0 | 3 | 0 | -20.758788 30.561514 429.779342 -21.301708 29.380315 429.782089 -20.574733 29.046998 430.137099 -20.031813 30.228197 430.134352 -20.758788 30.561514 429.779342 | True |
| 3 | 1013643 | 0 | 3 | 1 | -21.485764 30.894833 429.4243 -22.028684 29.713634 429.427047 -21.30171 29.380317 429.782058 -20.75879 30.561515 429.779311 -21.485764 30.894833 429.4243 | True |
| 4 | 1013643 | 1 | 1 | 0 | -19.10557 28.377467 429.602967 -18.562648 29.558665 429.60022 -19.271384 29.885347 429.995942 -19.814307 28.704149 429.99869 -19.10557 28.377467 429.602967 | True |
- a dataframe containing the Visual Amplitude values per each module. Such dataframe can be built in Rhino Grasshopper using the Solid Angle component and the Visual Amplitude component, after having set-up a grid of viewpoints on roads or sidewalks using the Medial Axis component. The dataframe should look like this (shape: n x 2):
| AV | ROOF T/F | |
|---|---|---|
| 0 | 0.800298 | True |
| 1 | 0.800432 | True |
| 2 | 0.803987 | True |
| 3 | 0.804112 | True |
| 4 | 1.03443 | True |
- an output dataframe from CitySim, which contains several columns, the first featuring the timestep, the others a series of variables relative to each building as a thermal zone, for example the indoor temperature, the heating and the cooling needs. The dataframe should have shape 8760 x n x m with m number of variables calculated by CitySim per each building
'#timeStep',
 '1(1):10:Ta(celsius)',
 '1(1):10:Heating(Wh)',
 '1(1):10:Cooling(Wh)',
 '1(1):10:Qi(Wh)',
 '1(1):10:Qs(Wh)',
 '1(1):10:VdotVent(m³/h)',
 '1(1):HeatStockTemperature(celsius)',
 '1(1):DHWStockTemperature(celsius)',
 '1(1):ColdStockTemperature(celsius)',
 '1(1):MachinePower(W)',
 '1(1):FuelConsumption(MJ)',
 '1(1):ElectricConsumption(kWh)',
 '1(1):SolarPVProduction(kWh)',
 '1(1):SolarThermalProduction(Wh)',
- 2d map of PV production per building
- 3d map of PV production per module
- various statistics about energy needs, energy production, load match, etc.: check
SolViz stats.ipynb
Python 3.x with the following libraries:
- numpy
- pandas
- geopandas
- matplotlib.pyplot
- seaborn
- plotly
- descartes
- First use the
Read_PD_pickle.ipynbnotebook to analyse the input, nest them in the tree structure and create both the 2d and 3d maps - Check the CitySim output with the
Read CitySim Out.ipynbnotebook - Use the
SolViz stats.ipynbnotebook to plot the statistics. Beware some variables are context sensitive and were built for the specific case of Geneva


