A Visual Studio Code extension with rich support for CSCS (Customized Scripting in C#). The CSCS scripting language has been described in CODE Magazine, MSDN Magazine, and in this Syncfusion E-book. The main source code repository with the description of the language is here.
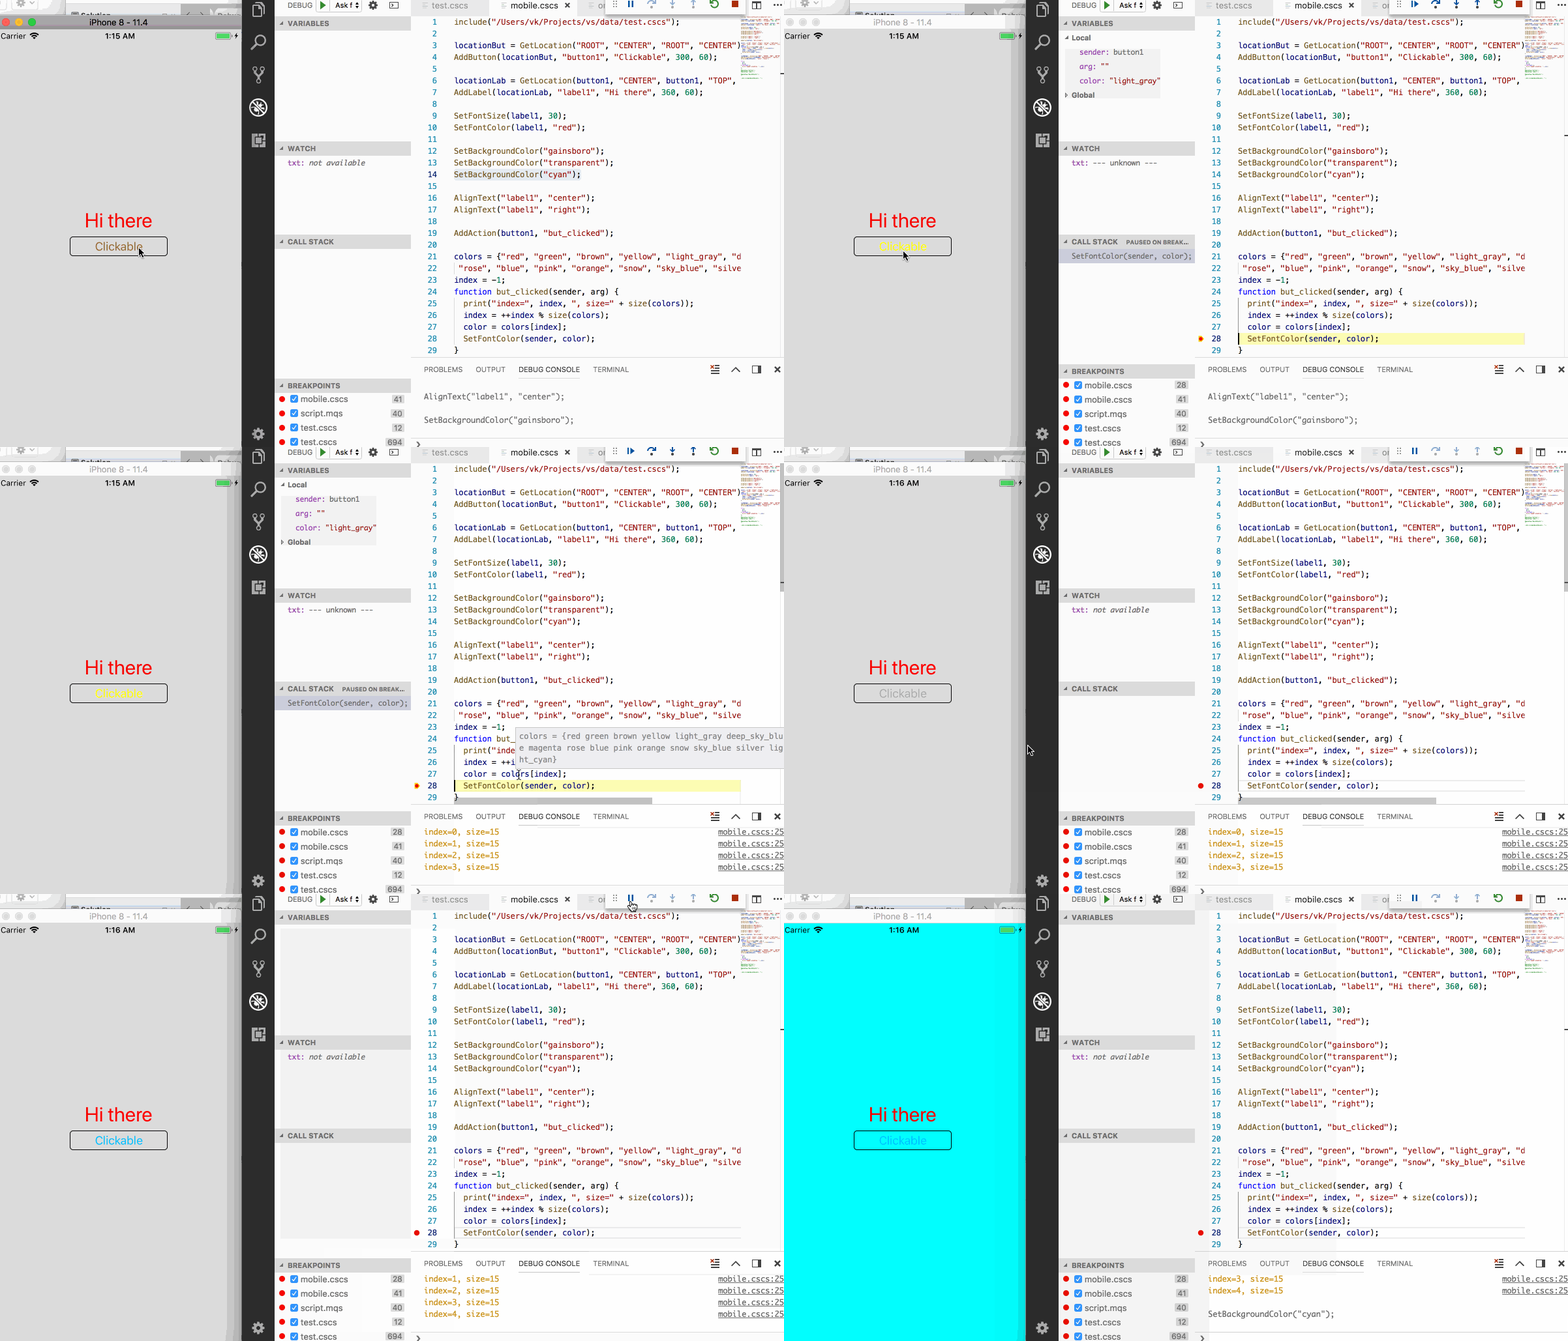
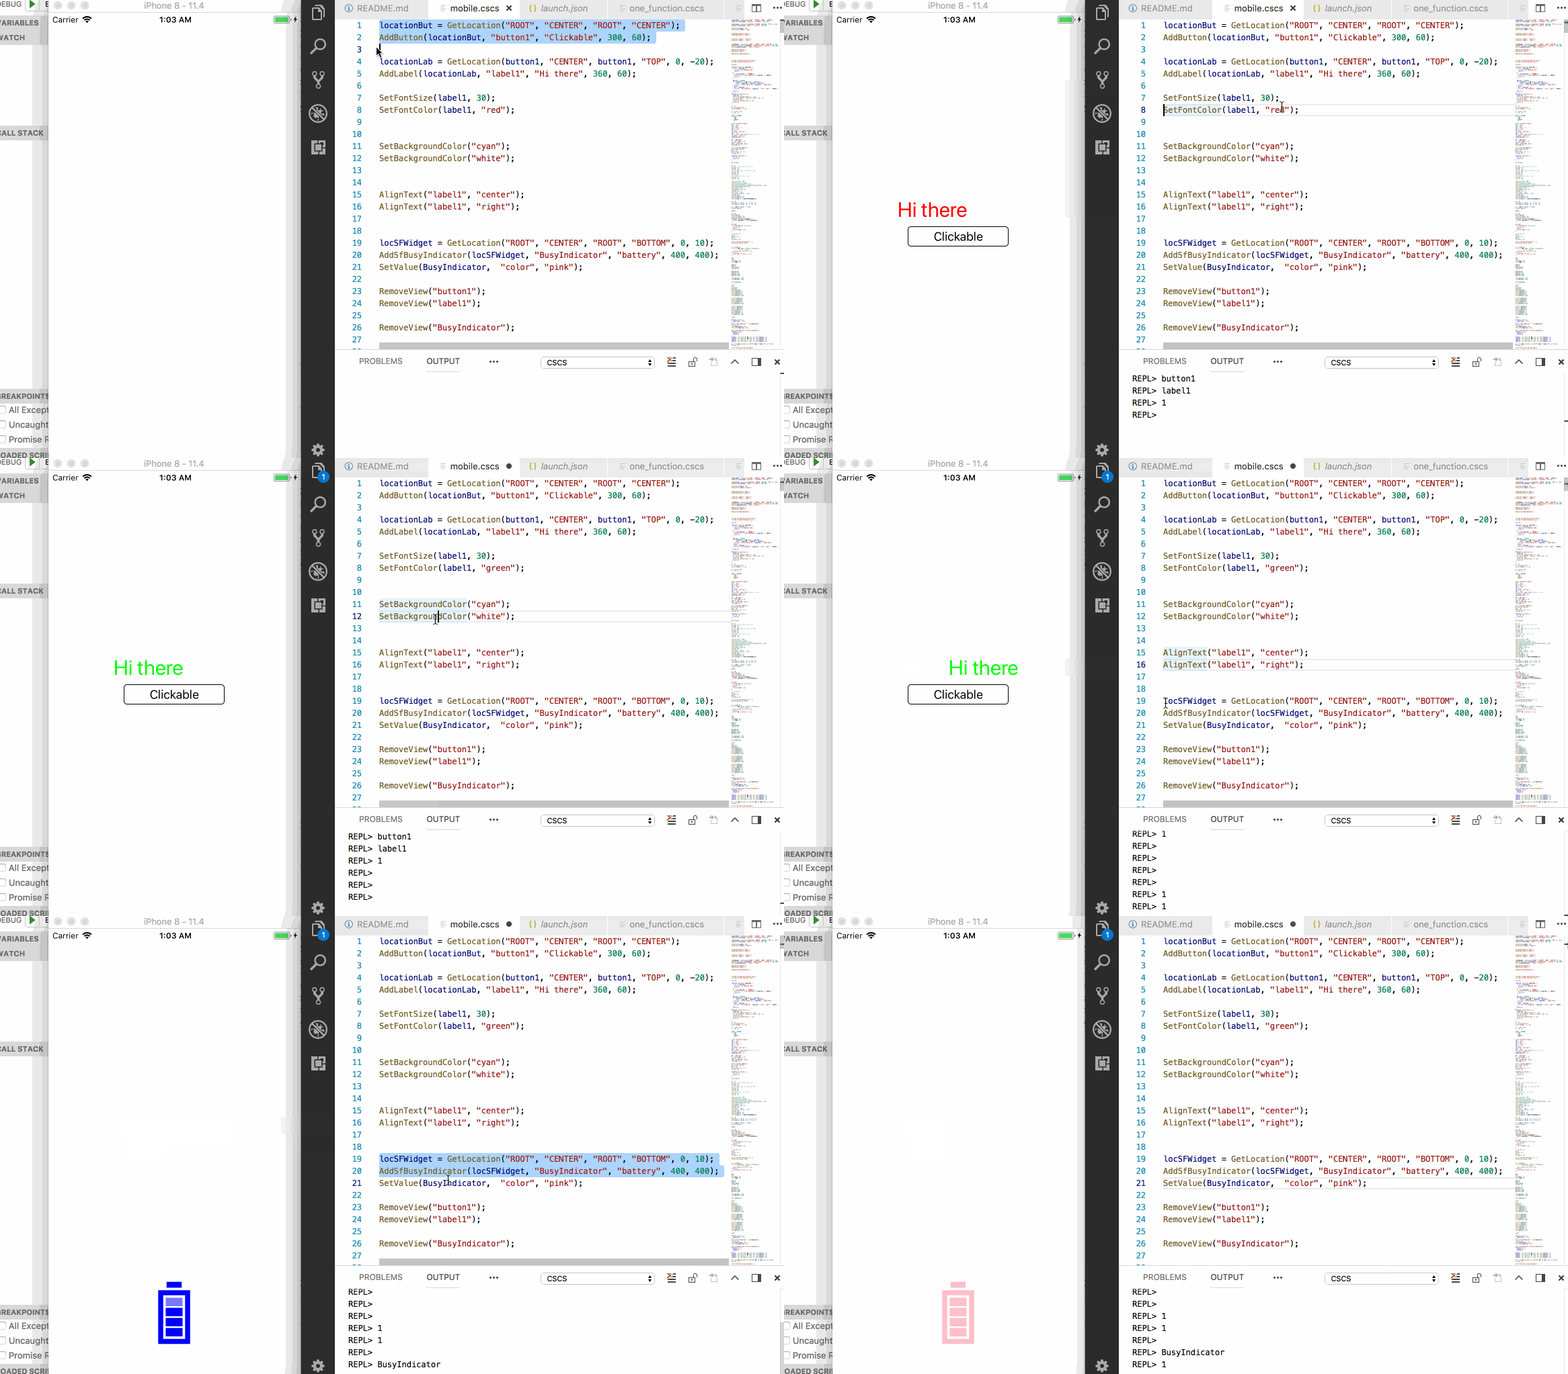
The cool thing about CSCS is that you can modify the mobile app Layout on the fly! And this is using the same code for iOS and for Android devices. Check out the first animated gif below.
The main advantage of the CSCS scripting language is the possibility to easily modify the language functionality or to add new functions. Everything is open sourced (see Windows/Mac Version and Mobile Development Version) and is absolutely free to use.
You can also use CSCS for cross-platform mobile development (iOS and Android) with Xamarin. See CODE Magazine, MSDN Magazine and this Syncfusion E-book.
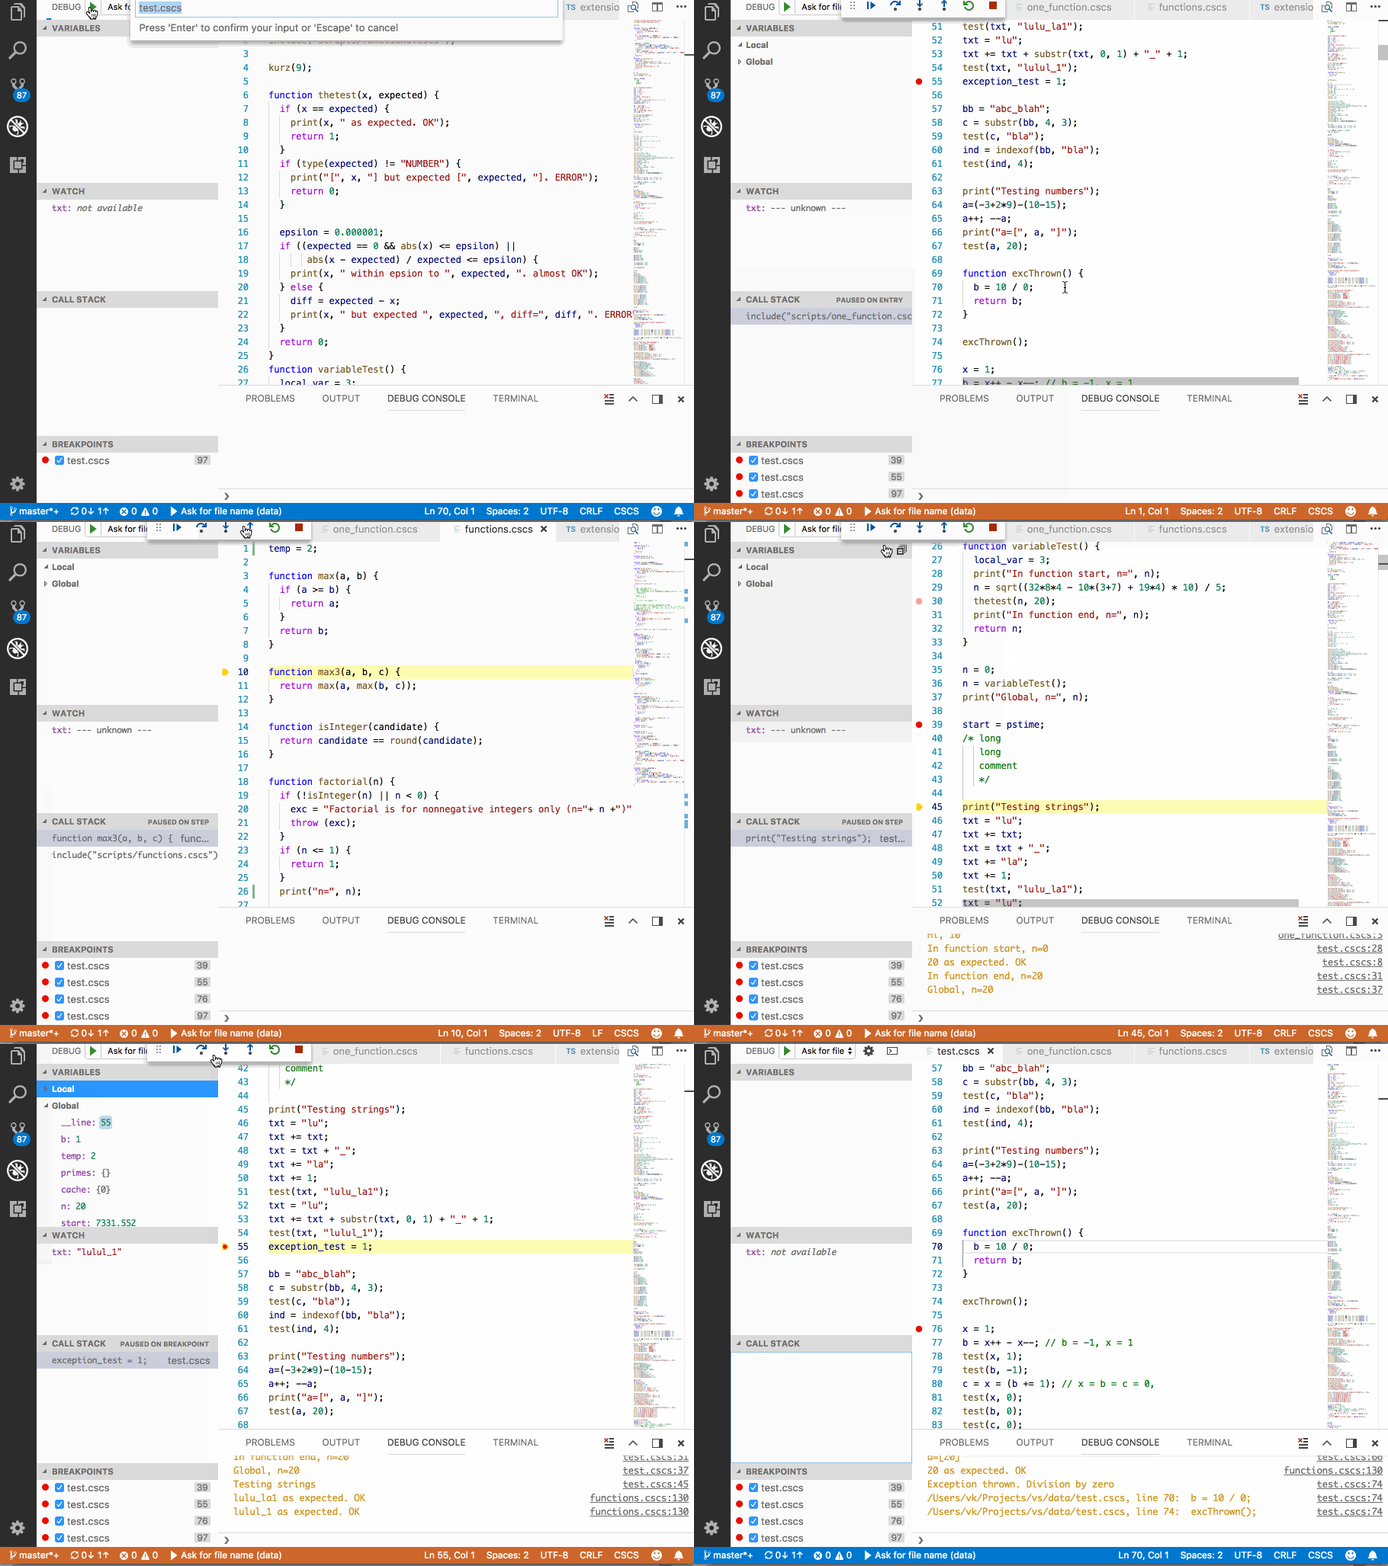
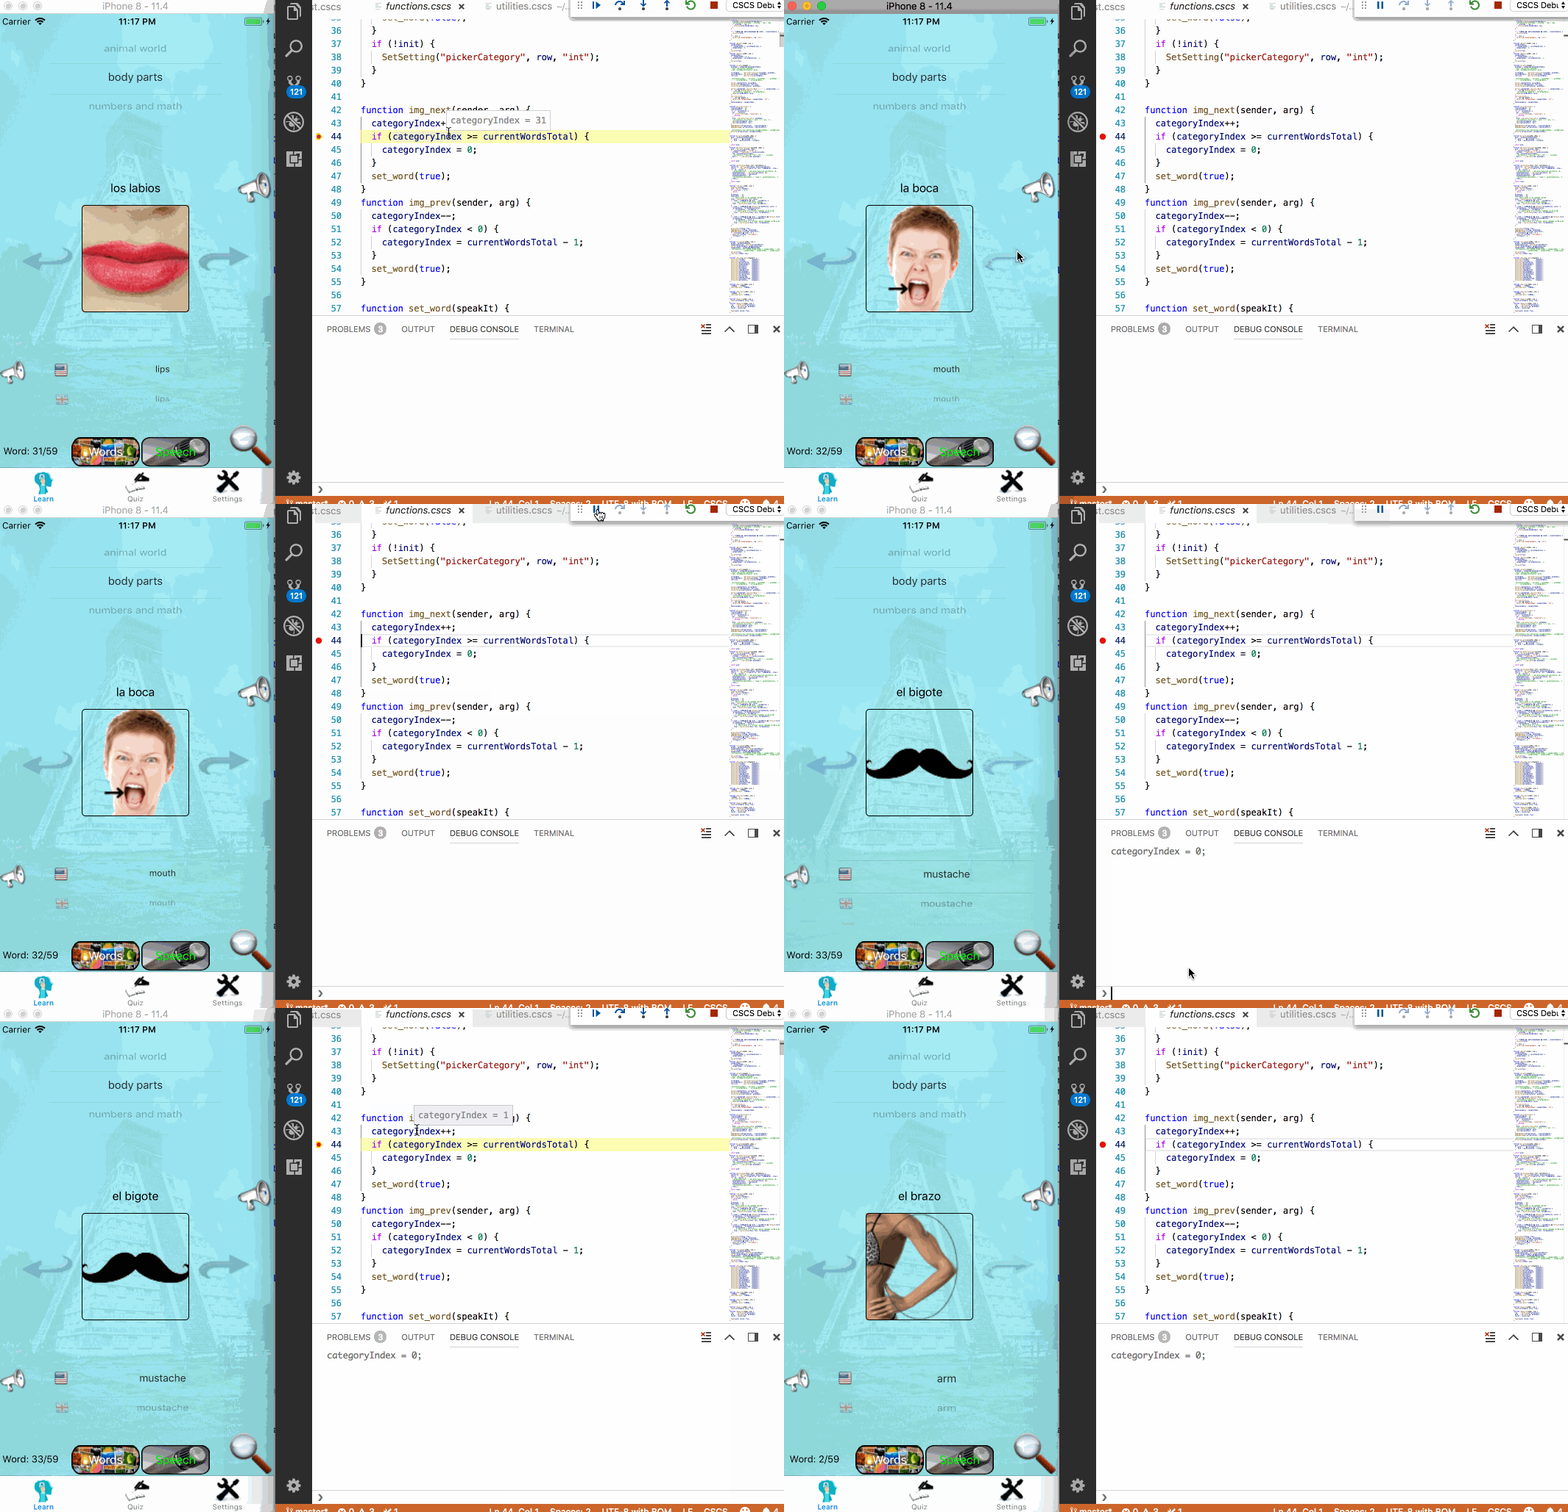
This extention contains the CSCS syntax highlighting and supports debugging (including step-in, step-out, breakpoints, call stack, exceptions, etc.)
-
Step 1. Download the CSCS parser: Windows/Mac Version.
-
Step 2. Open the project downloaded in the first step in Visual Studio and compile it.
-
Step 3. Start the DebugServer either from Visual Studio or from the command-line. The default port is 13337. The host and port are configurable.
-
Step 4. Open any CSCS file in Visual Studio Code and start selecting code fragments and pressing Cmd+8 (Ctrl+8) (see the animated gifs below).
-
Step 1. Download the CSCS parser Mobile Development Version.
-
Step 2. Open the project downloaded in the first step Visual Studio and compile it.
-
Step 3. Start the DebugServer from Visual Studio with Xamarin. The default port is 13337.
-
Step 4. Open any CSCS file in Visual Studio Code and start selecting code fragments and pressing Cmd+8 (Ctrl+8) (see the animated gifs below).
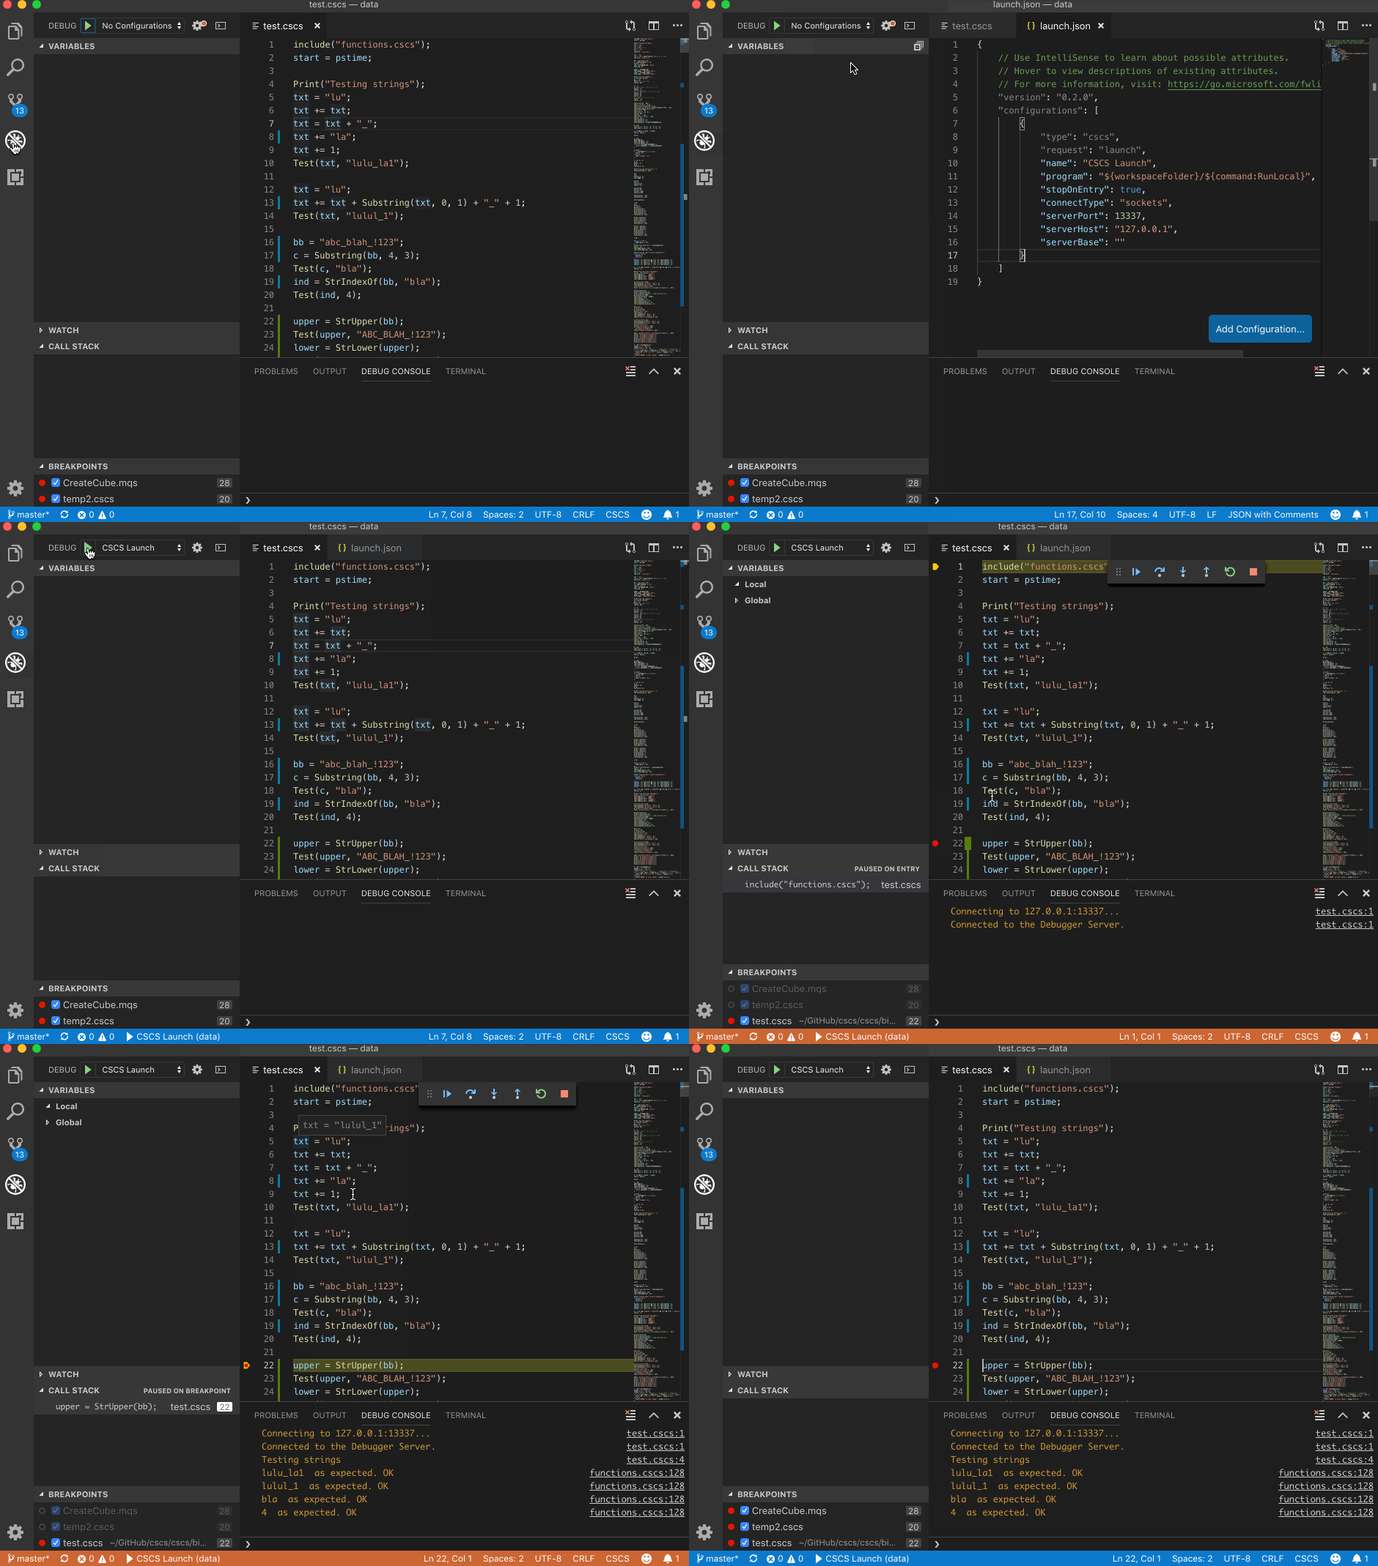
This is how you can configure CSCS debugger when you use it for the first time (remove ".vscode" folder in the current directory to start configuring from the beginning):
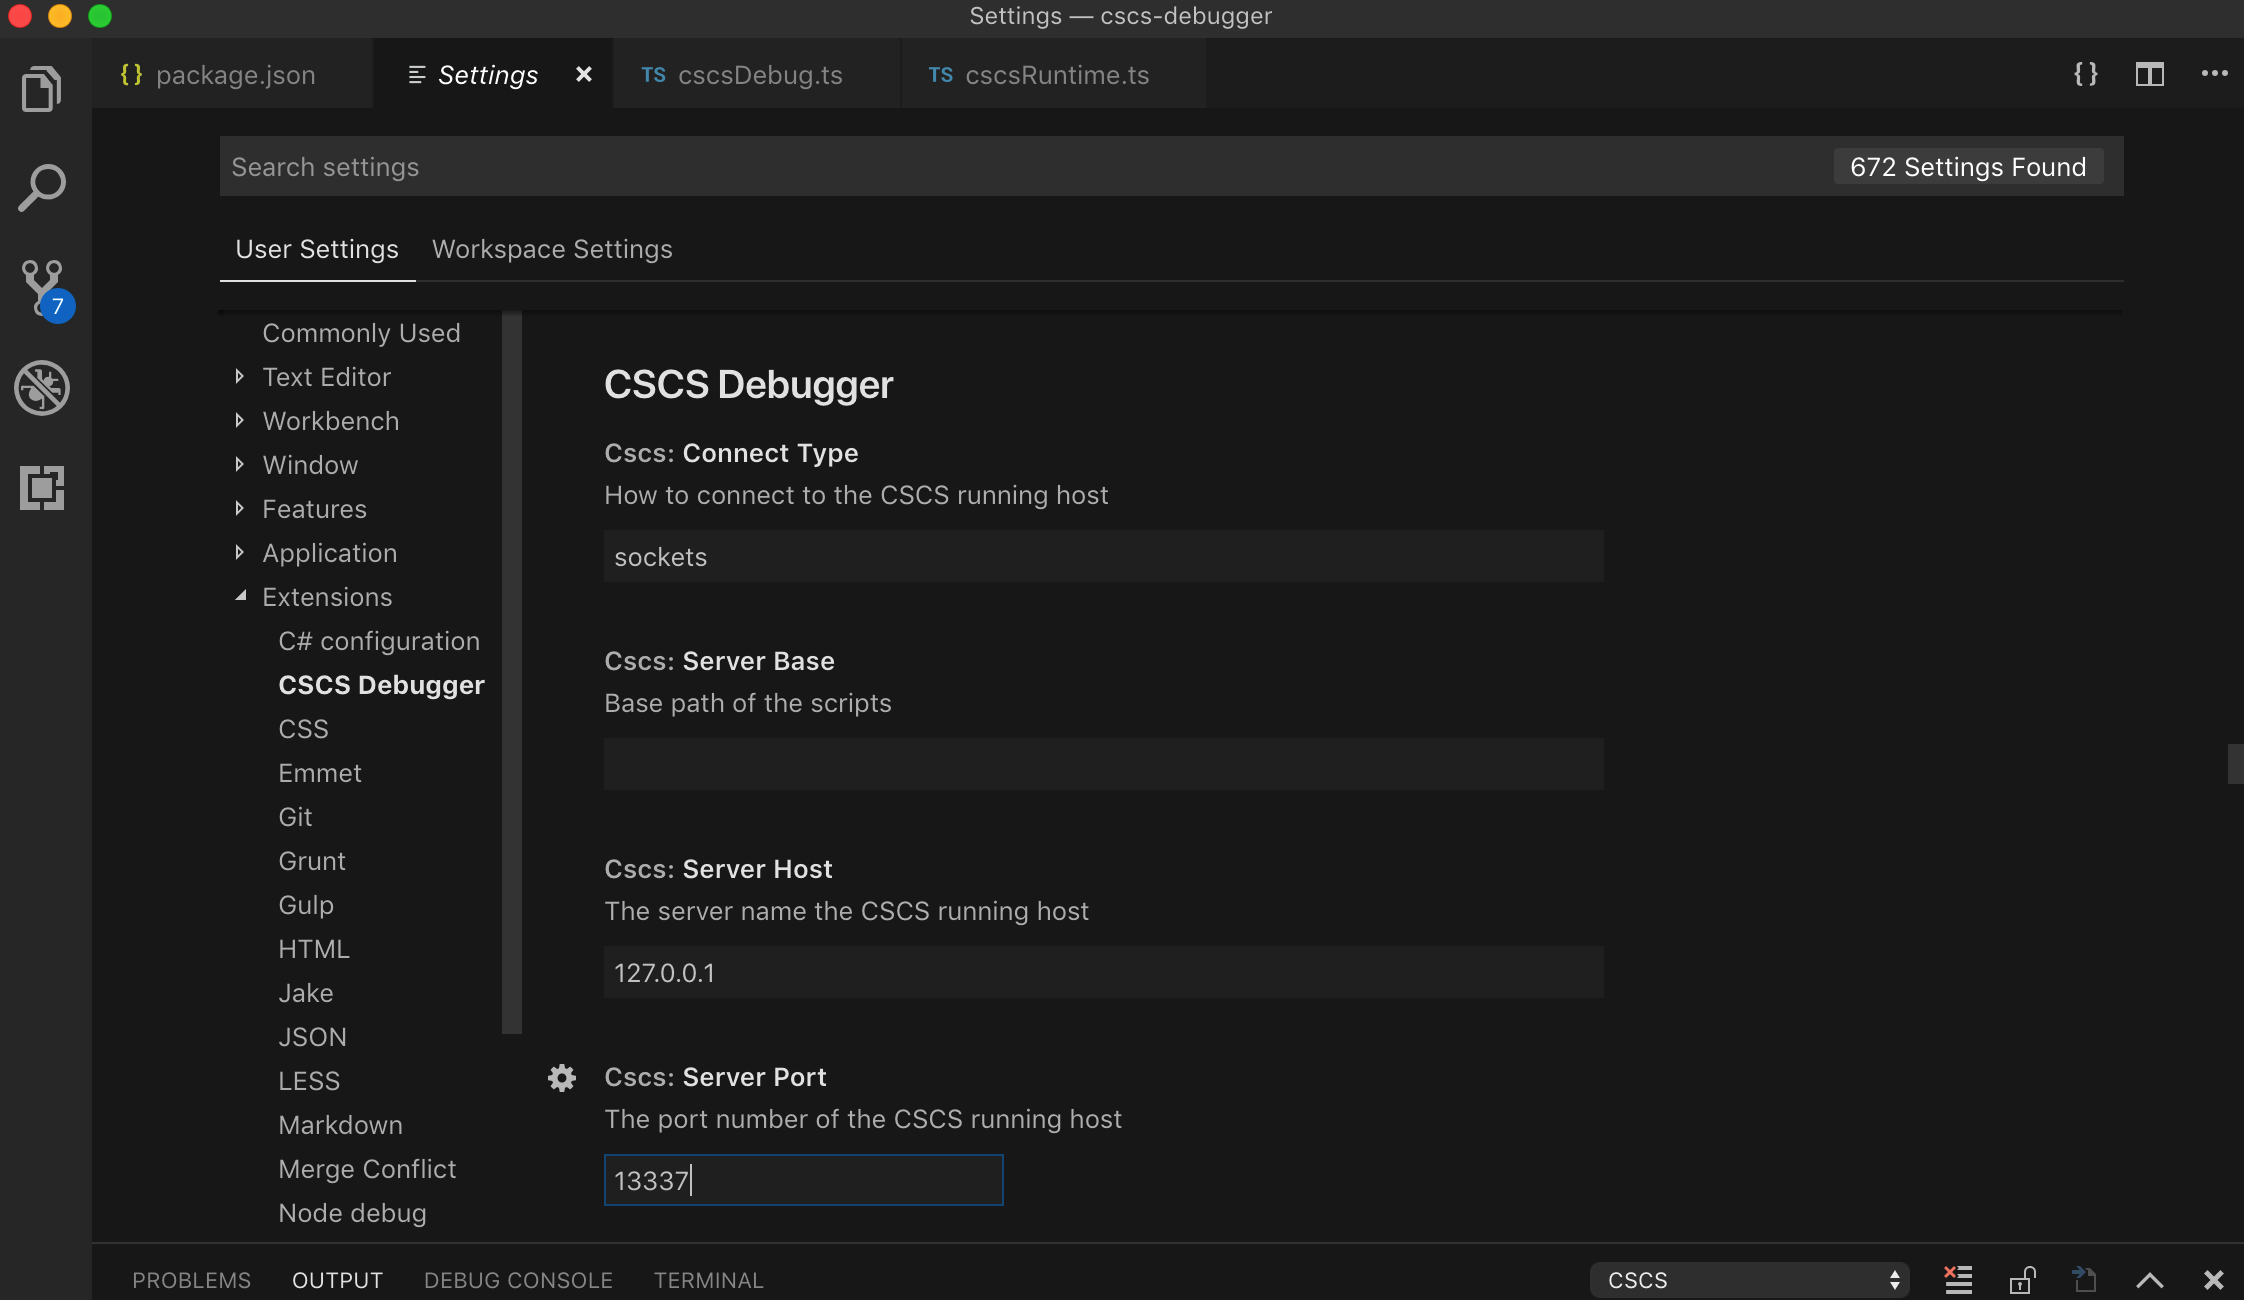
You can configure various debugging parameters in Visual Studio Code settings (use the keyboard shortcut (⌘, on Mac and Ctrl, on Windows)). Connect type parameter is currently not used, but you can configure the debugging host and port (remote debugging is possible as well but don't forget opening the corresponding port in the firewall settings).
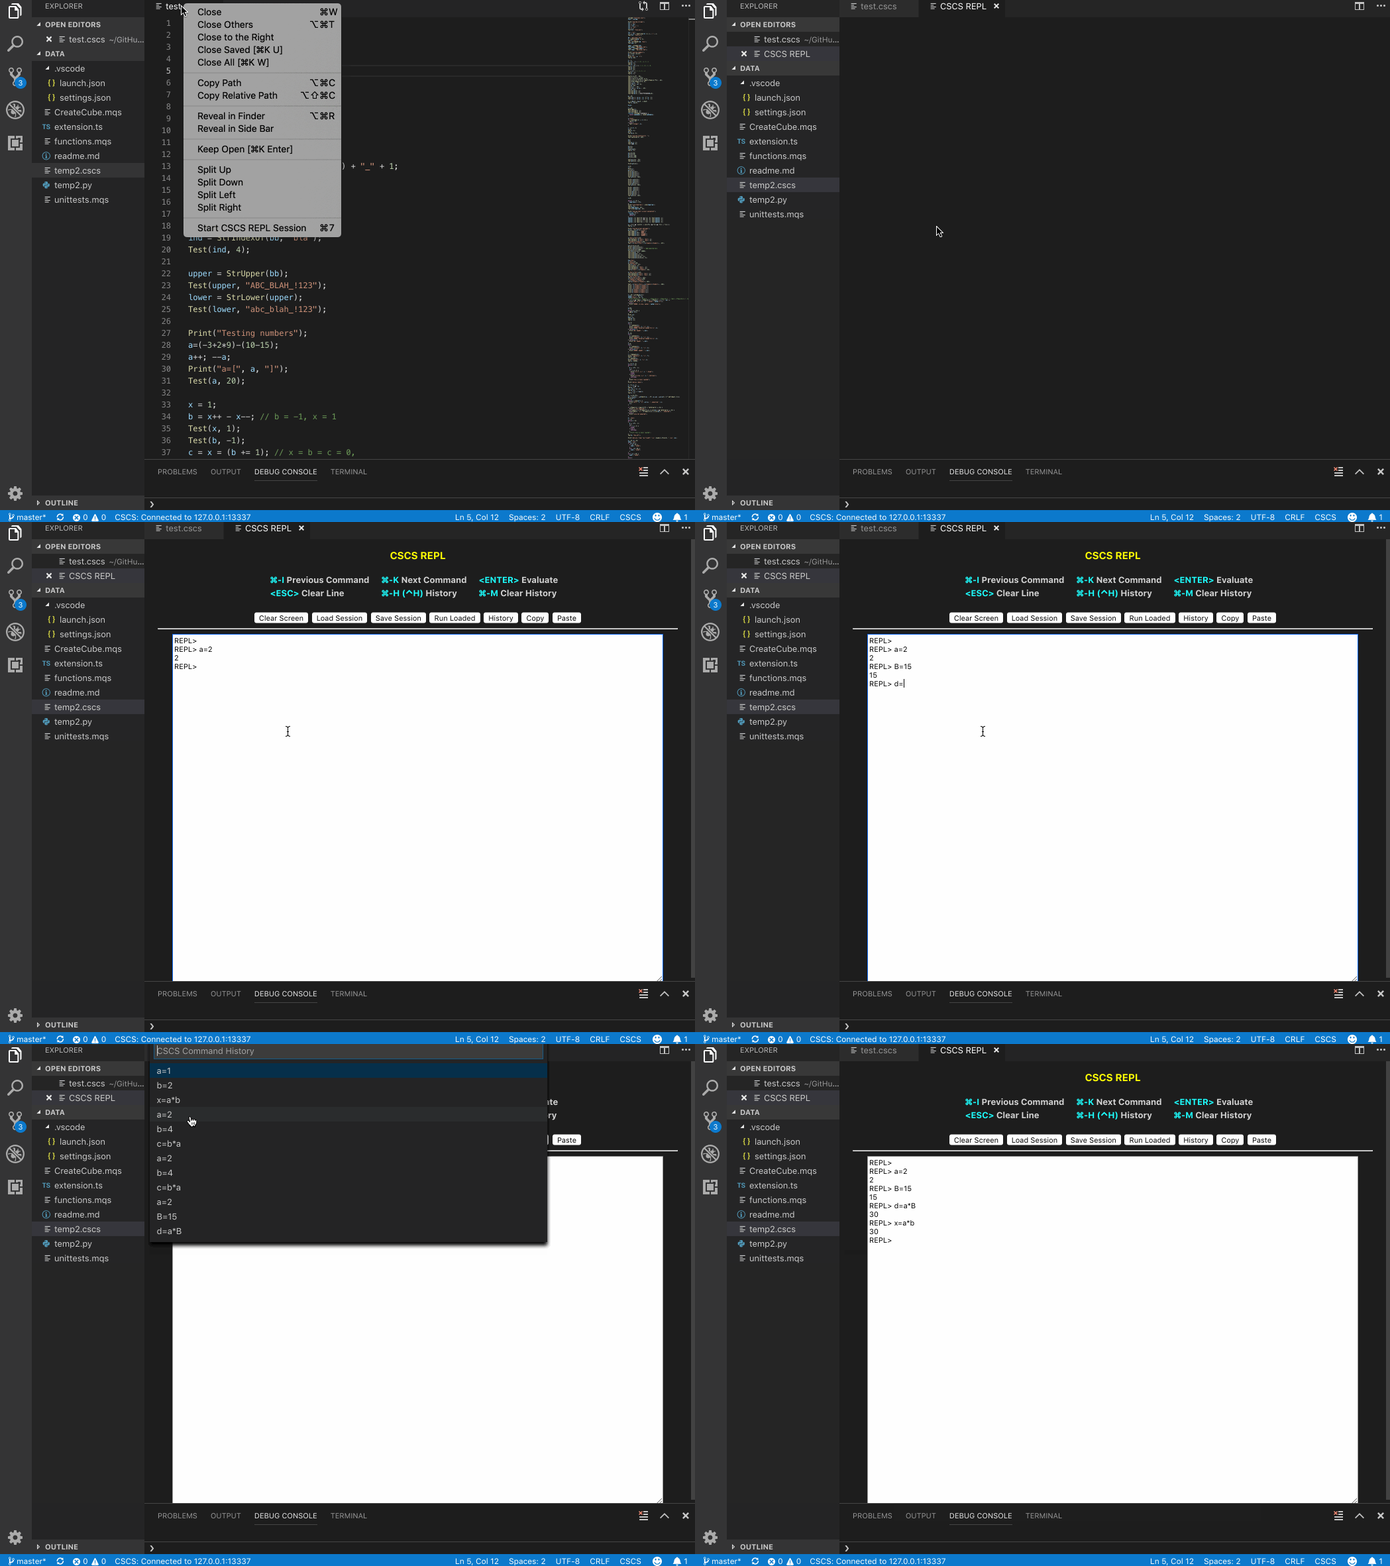
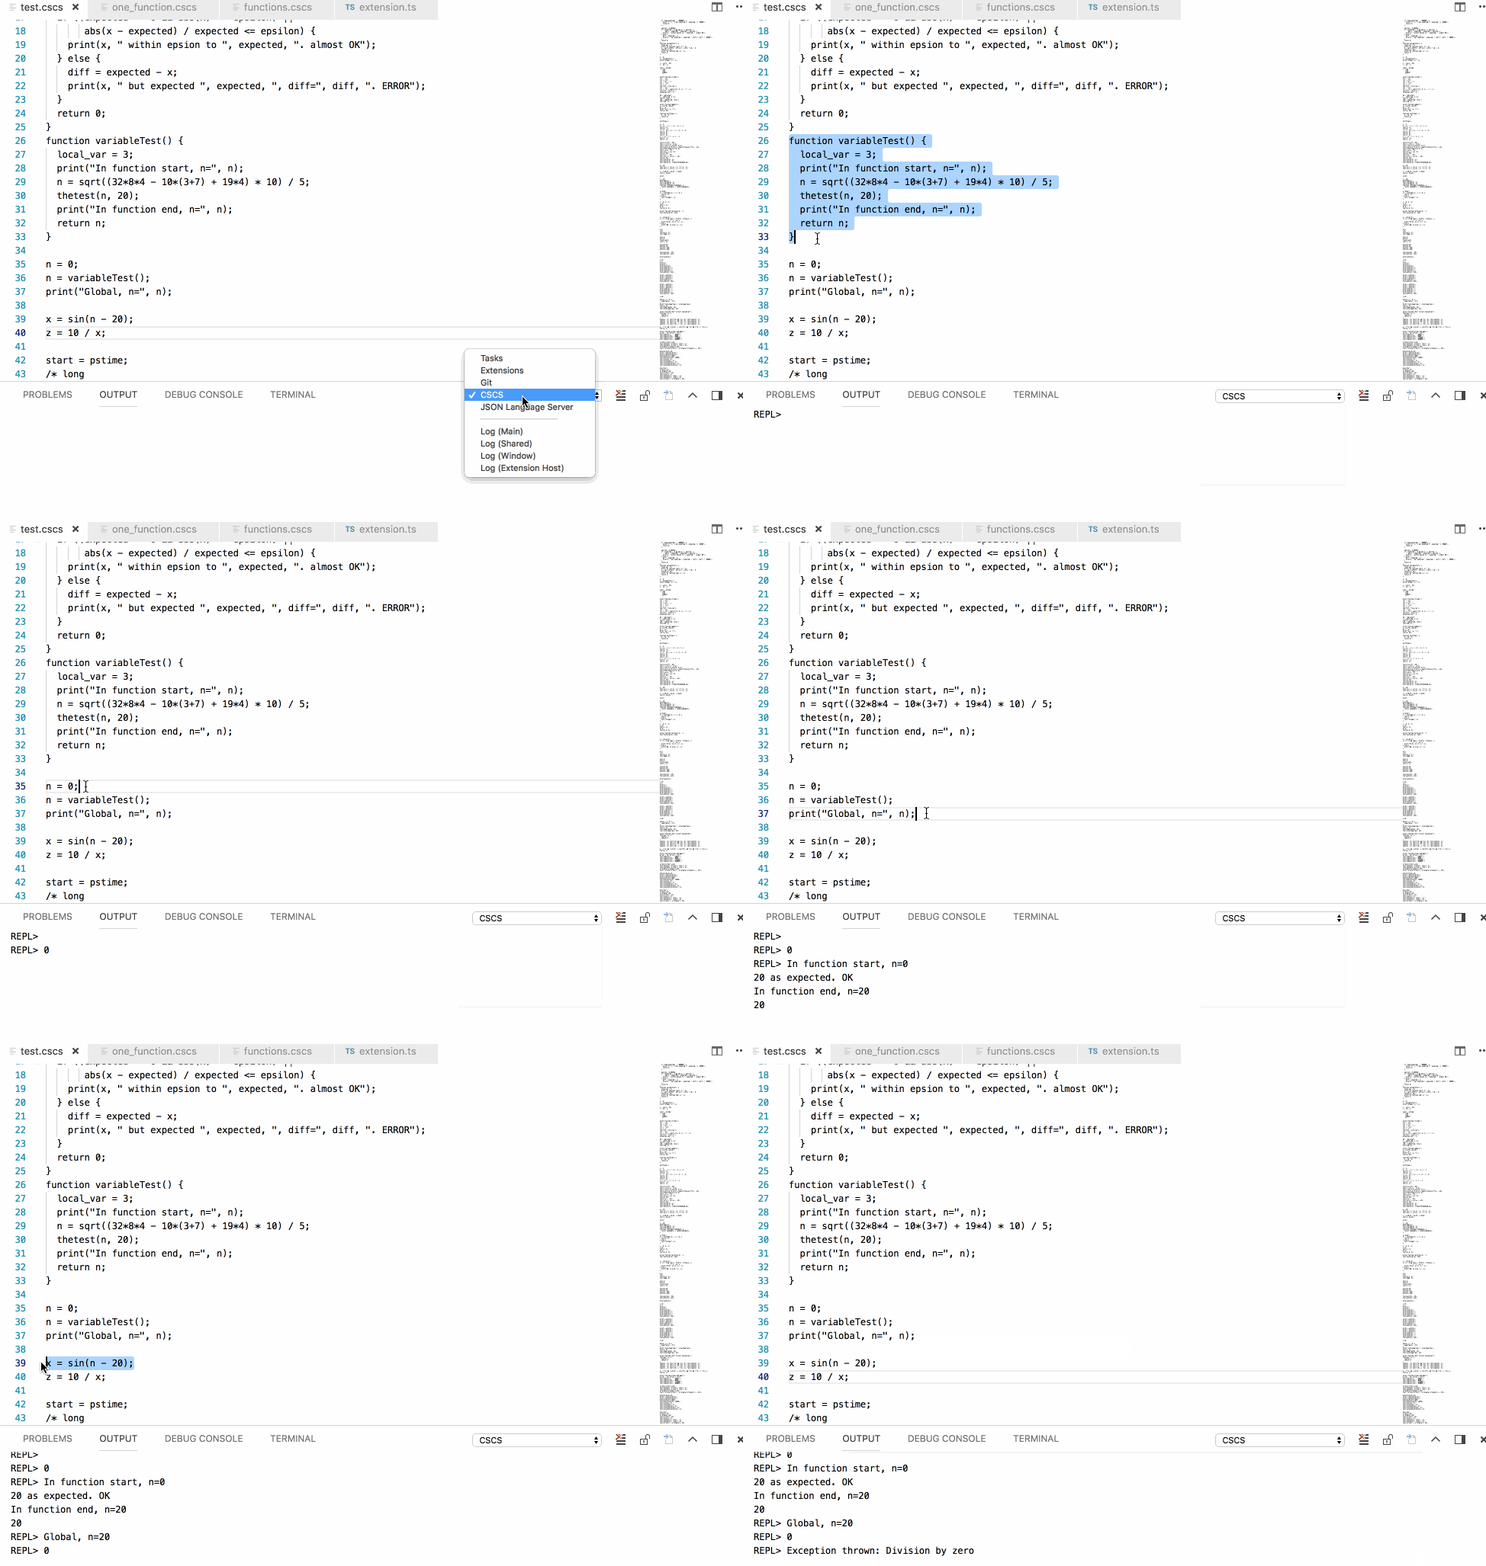
You can use REPL either by selecting some text and pressing Cmd-8 (Ctrl-8) or by typing on a bash-like command-line interface. Right click on a file title and choose "Start CSCS REPL Session" option to start a separate REPL window:
- If you have a question about how to accomplish something with the extension or come across a problem with the extension, please ask me
- Watch Window
- Local and Global Variables
- Add/Remove Breakpoints
- Step Through Code ("Step in", "Step out", "Continue")
- Call Stack
- Hover over variables or functions to see their current values
- Possibility to Step-in to the "include file" Statements and to Any CSCS Function
Setting breakpoints in custom functions:
You can also execute REPL from the command-line while debugging, changing the variable values:
The corresponding launch.json configuration looks like this:
{
    "version": "0.2.0",
    "configurations": [
        {
            "type": "cscs",
            "request": "launch",
            "name": "CSCS Debugger",
            "program": "${workspaceFolder}/${command:RunLocal}",
            "stopOnEntry": true,
            "serverBase": "",
            "connectType": "sockets",
            "serverPort": 13337,
            "serverHost": "127.0.0.1"
        }
    ]
}- Here is the REPL Extension in action using an iOS device. You can see that you can add and remove widgets on the fly!
* Here is the REPL Extension with a normal CSCS script.
- You can also use this Extension to debug CSCS scripts and run REPL if you are using CSCS with Unity.
The CSCS Extension for Visual Studio Code DOES NOT collect any data from the user.
