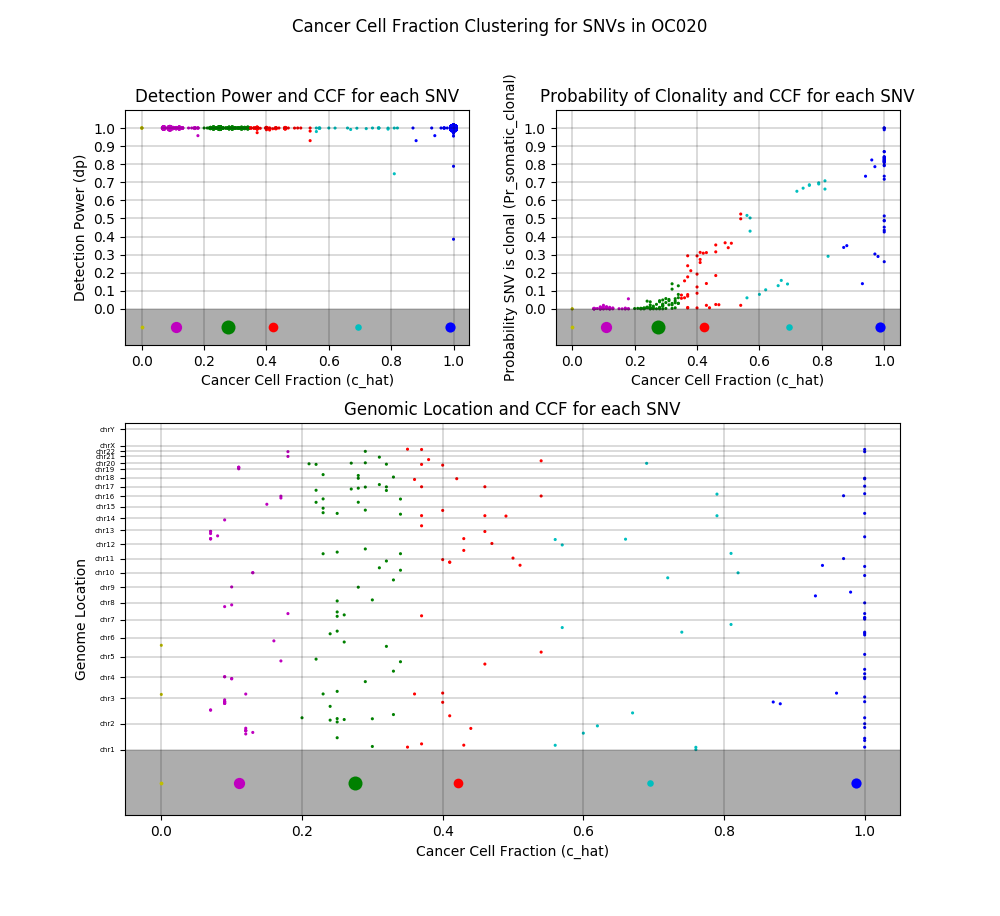
The AbsMafAnalyzer workflow can be used to visualize the data from an *ABS_MAF.txt absolute file output. Detection power, probability of clonality, and genomic locus are plotted for all SNPs, along with clustering information based on cancer cell fraction.
An example plot describing the SSD dropoff for different values of k can also be found in the example_plots folder.
Add abs_maf_analyzer and k_means_abs_maf folders into your project folder.
Ensure the libraries specified in the requirements.txt file are available in your working environment.
If not, simply run pip install -r requirements.txt.
Then, as described below, just import the AbsMafAnalyzer class from the abs_maf_analyzer package.
The following parameters can be provided to an AbsMafAnalyzer object:
-
abs_maf_path: The path to the *ABS_MAF file to be analyzed. -
detection_power_threshold: A threshold for detection power. By default there is no threshold; if one is set, only SNPs with a detection power above the given threshold will be analyzed and plotted. -
accession: The accession for the sample. It will be used to title the output plots. -
exclude_silent: If set to True, only SNPs with a non-silent effect will be analyzed and plotted. -
k_ranges: By default k-means will test k-values between 1 and 10. A customized range of k-values can be tested instead by supplying such a list for this parameter.
Example usages in a script:
from abs_maf_analyzer.abs_maf_analyzer import AbsMafAnalyzer

def main():
    path = '/Users/erickofman/Documents/Projects/OralCancer/OCSCC-OC011-TP-NB-SM-F3R74-SM-F3R84_ABS_MAF.txt'
    a = AbsMafAnalyzer(path, accession="OC011")

    # k is not specified -- all values of k between 1 and 10 will be tested for optimal number of clusters. This
    # takes around 12 seconds.
    a.cluster()

    path = '/Users/erickofman/Documents/Projects/OralCancer/OCSCC-OC011-TP-NB-SM-F3R74-SM-F3R84_ABS_MAF.txt'
    b = AbsMafAnalyzer(path, accession="OC011")

    # k is specified -- value specified will be used for number of clusters
    b.cluster(k=5)

if __name__ == '__main__':
    main()
- The k-means implementation used here, which leverages pandas, is very loosely based on an implementation by Jack Maney, which can be found here: https://github.com/jackmaney/k-means-plus-plus-pandas. Significant changes were made to improve the conciseness, accuracy, and clarity of the code in the aforementioned framework.
