cellxgene VIP unleashes full power of interactive visualization, plotting and analysis of scRNA-seq data in the scale of millions of cells
Since the first single-cell RNA sequencing (scRNA-seq) study was debuted in 2009[1], over 1050 scRNA-seq studies have been published to date. At least 25 studies reported profiles in 200k or more cells[2]. The largest scRNA-seq study reported 2.5 million mouse cells[3]. It is foreseen that there will be a trend of increasing cell size of 500k or more in scRNA-seq studies. The sheer amount of data had brought a challenge in visualizing and interactively exploring such big data set for scientists, even computational savvy specialists.
Cellxgene[4] is a leading open source scRNA-Seq data visualization tool recommended in a recent evaluation[5], which scales well in millions of cells and scores high in user experience by leveraging modern web techniques with interactive features. We tested with a large community of biologists, cellxgene works the best in meeting the need of handling data themselves except lack of some essential plotting seen in scRNA-seq related publications and analysis functions that biologists are used to, hinders its utility and limits scientists from taking advantage of ever accumulating scRNA-seq data in the public to its full potential.
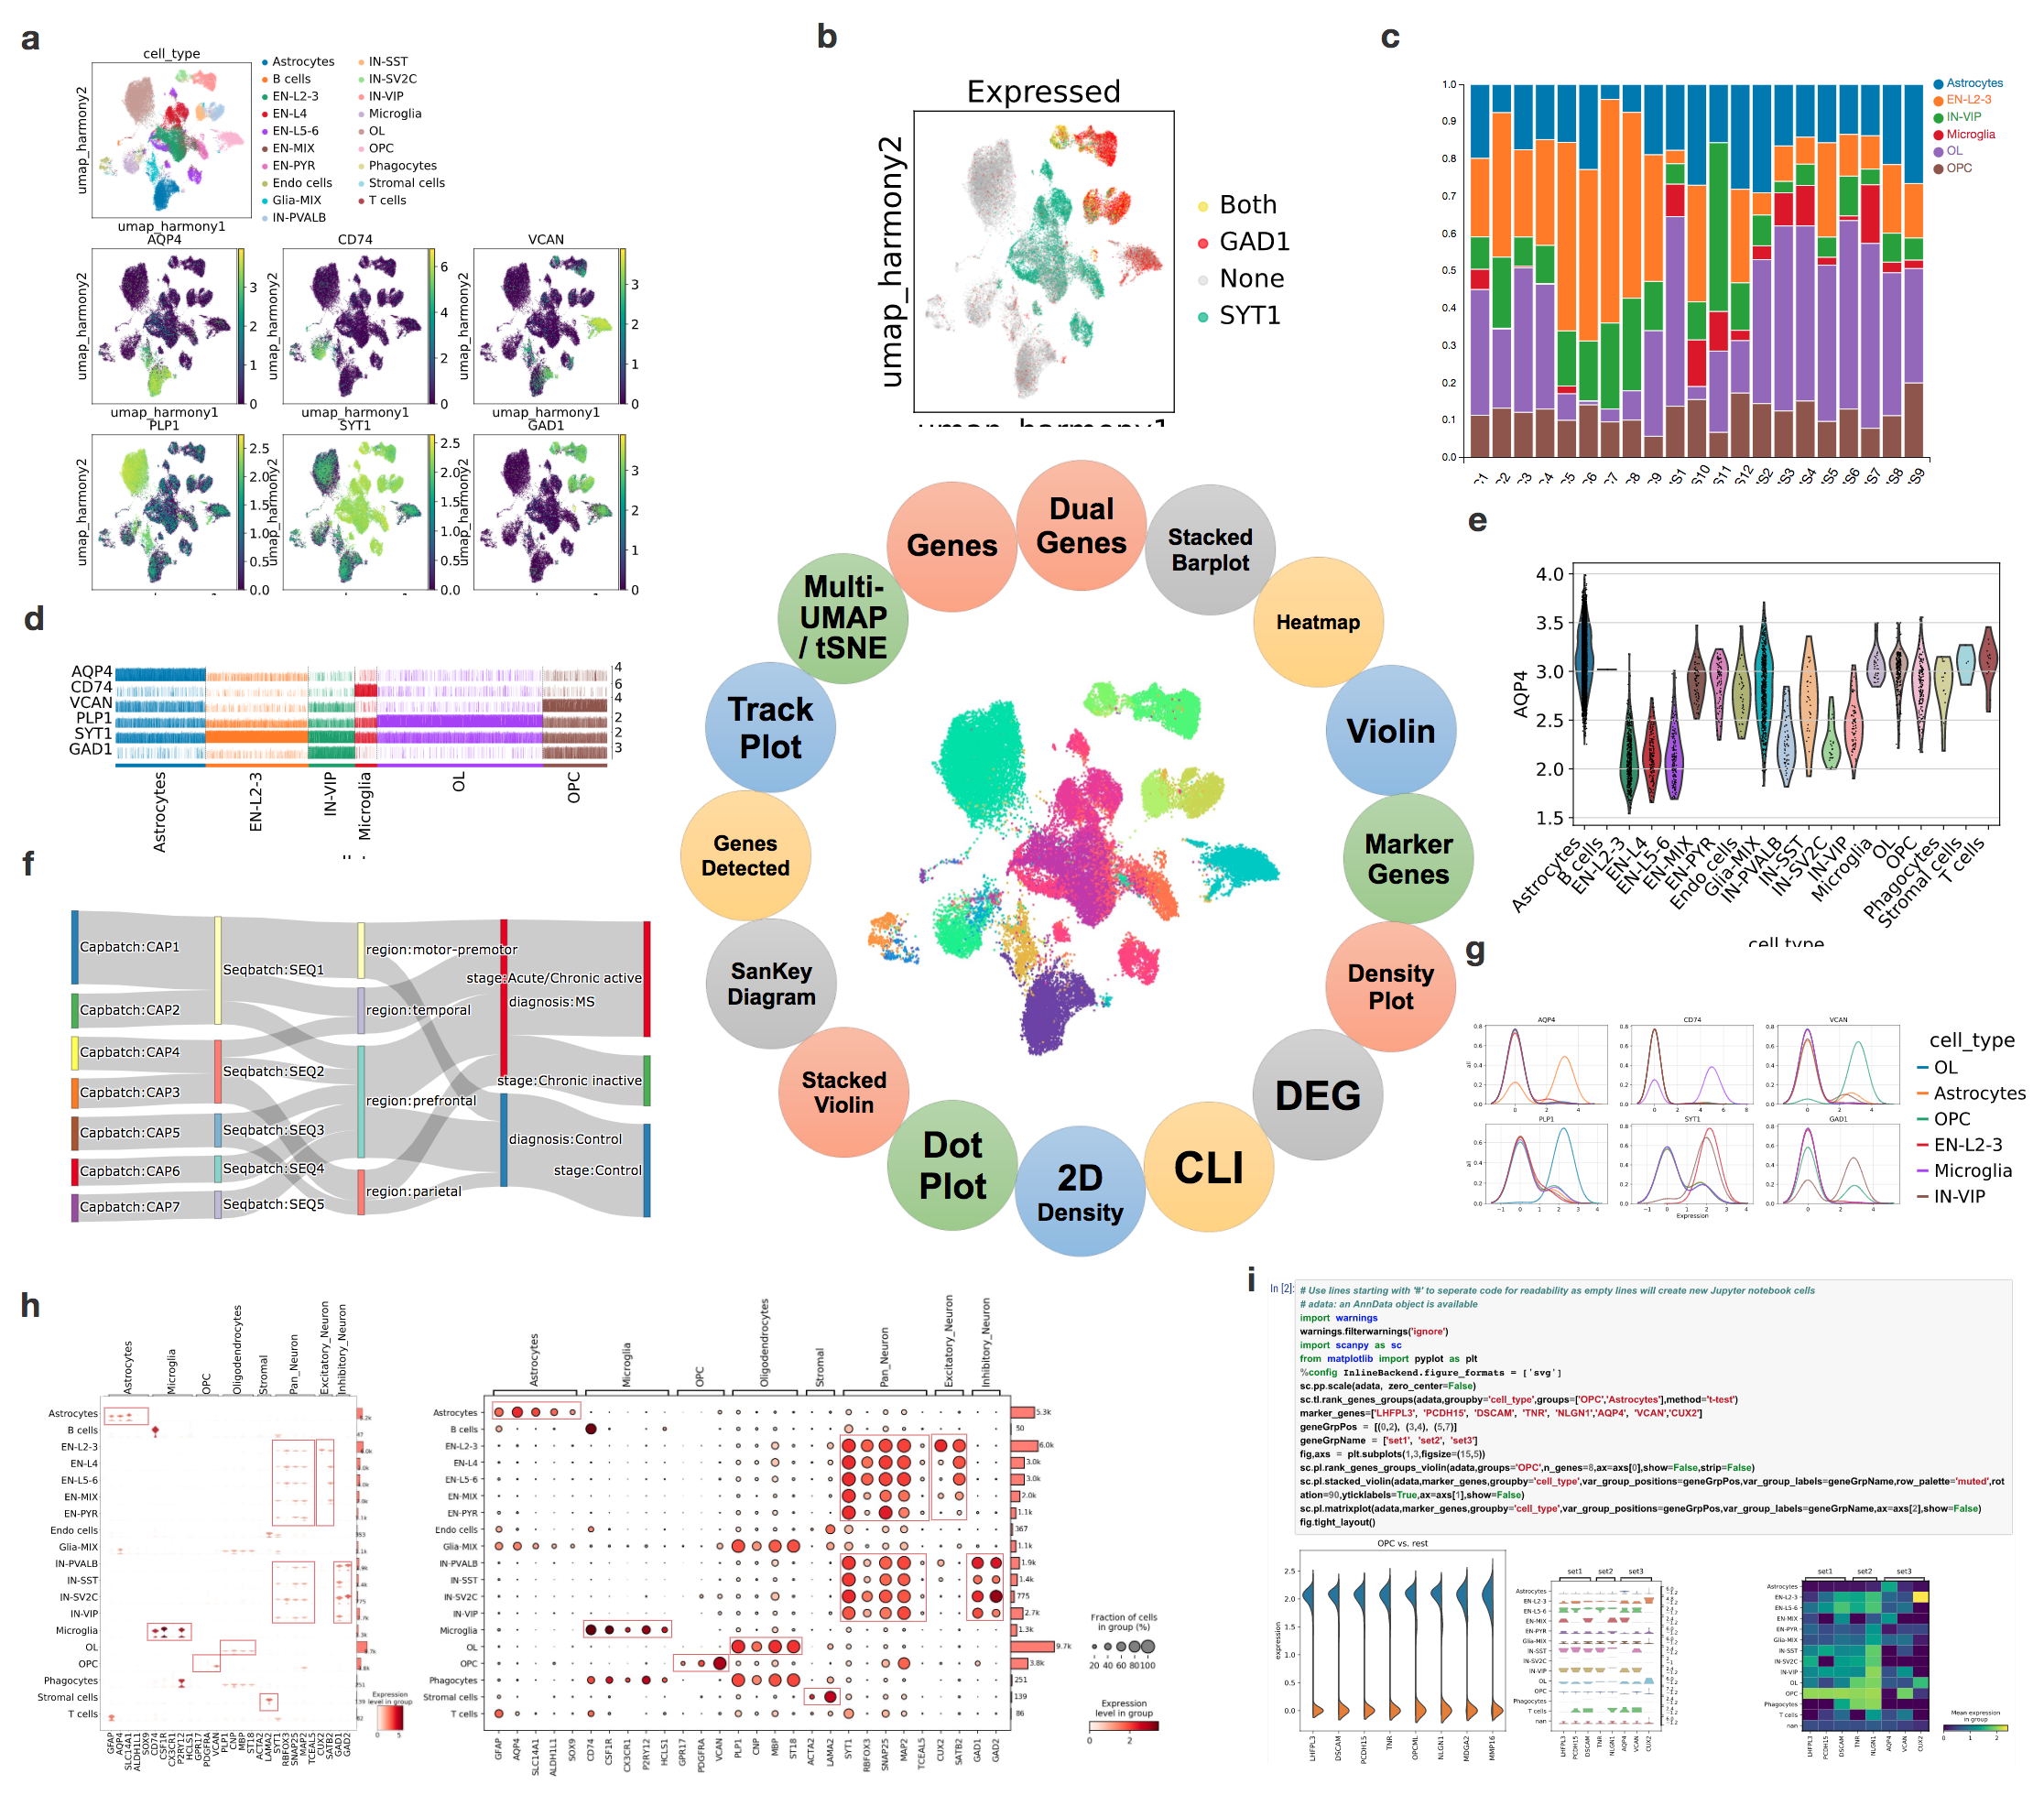
To fill the gap, we developed a plugin of cellxgene named Visualization in Plugin, in short VIP, to address the urgent needs of such essential functions for interactive visual exploration and generation of publication-ready figures. Notably, it enhanced plotting functions significantly to generate violin, stacked violin, stacked bar, heatmap, volcano, embedding, dot, track, density, 2D density, sankey and dual-gene plot in high-resolution by calling server-side scanpy’s[6] plotting functions and general plotting libraries as illustrated in Figure 1 and Supplementary Tutorial.

- Tang, F. et al. mRNA-Seq whole-transcriptome analysis of a single cell. Nature Methods 6, 377-382 (2009).
- Svensson, V., da Veiga Beltrame, E. & Pachter, L. A curated database reveals trends in single-cell transcriptomics. bioRxiv, 742304 (2019).
- Rodriques, S.G. et al. Slide-seq: A scalable technology for measuring genome-wide expression at high spatial resolution. Science 363, 1463 (2019).
- Chan Zuckerberg Initiative chanzuckerberg/cellxgene: An interactive explorer for single-cell transcriptomics data. Available at https://chanzuckerberg.github.io/cellxgene/ ([Accessed: 5 May 2020]).
- Cakir, B. et al. Comparison of visualization tools for single-cell RNAseq data. NAR Genomics and Bioinformatics 2 (2020).
- Wolf, F.A., Angerer, P. & Theis, F.J. SCANPY: large-scale single-cell gene expression data analysis. Genome Biology 19, 15 (2018).
- Li, K. et al. figureComposer: A web-based interactive multi-panel bio-infographic designing tool. bioRxiv, 2020.2003.2004.976589 (2020).
Demo site: https://cellxgenevip-ms.bxgenomics.com
- Anaconda3-2020.02-Linux-x86_64.sh
- node-v12.16.2-linux-x64
conda create -n <env name> python=3.7
conda activate <env name>git clone https://github.com/interactivereport/cellxgene_VIP.git
cd cellxgene_VIP
./config.sh3. Run cellxgene by specifiying a h5ad file storing scRNA-seq data along with a host and a port, use "ps" to find used ports to spare, see https://chanzuckerberg.github.io/cellxgene/posts/launch for details.
ps -ef | grep cellxgene
cellxgene launch --host <xxx> --port <xxx> --disable-annotations --verbose <h5ad file>You should be able to see this in Console of Chrome Developer Tools if everything is right.

note: while spinning up the cellxgene from HPC, do NOT use qlogin. ssh directly to the server.
./update.VIPInterface.sh # if "interface.html" or "VIPInterface.py" is modified, often.

./update.index_template.sh # if jsPanel is modified, very rare.In command line:
export LIBARROW_MINIMAL=falseThen in R:
install.packages("arrow”)