A wrapper for tracing test runs and for complex shell-based tracing using TTB.
This component is based on locks_ttb, whose main purpose was to be used in complicated multi-node test cases: a wrapper around the test case sets up a multi-node trace using ttb; if the test case succeeds, the traces are discarded, but if it fails, the logs are fetched, merged and formatted for 'easy' viewing.
The idea is complemented with the notion of using an event() function,
whose only purpose is to be traced. This can serve as extremely lightweight
runtime debugging statements. Since the event() function only returns
ok, the whole operation is cheaper than any runtime test for debug level
could be. The include/trace_runner.hrl include file defines ?event
macros that can be used, including one that tests whether the event()
function is traced, before evaluating the argument expression. This can
be used to 'pretty-print' the arguments to the event() function without
incurring overhead when not tracing (obviously there is some overhead in
checking the trace status).
There is also support for shell-based tracing, making use of the instrumentation callbacks e.g. for pretty-printing of trace output.
The main API functions are:
tr_ttb:on_nodes(Nodes, OutputFile, Spec) -> {ok, [{Item, MatchDesc}]}.This function acts as a wrapper to ttb:start_trace/4, and returns whatever
that call returns. The Spec can be either a module name, where the module
is expected to export some or all of the supported configuration callbacks
(see below), or a map():
-type spec() :: #{ patterns => [tr_ttb:pattern()]
                 , flags    => {tr_ttb:procs(), tr_ttb:flags()},
                 , collect  => on_error | always
                 , info     => any() }
The info attribute is used for documentation purposes. If the trace
includes tracing on tr_ttb:event/3, a trace message will be included
showing tr_ttb:event(_Line, ttb_started, Spec). The tr_ct trace
wrapper, described below, uses the info attribute to signal where,
at which checkpoint, the trace started.
Example (from https://github.com/PDXOstc/rvi_core, although at the time of writing, the trace_runner support hasn't yet been merged)
First, we create a callback module for the tr_ttb behavior, which
lets us specify trace patterns and trace flags.
patterns() ->
    [{authorize_rpc        , event, 3, []},
     {service_edge_rpc     , event, 3, []},
     {service_discovery_rpc, event, 3, []},
     {dlink_tcp_rpc        , event, 3, []},
     {connection           , event, 3, []},
     {dlink_tls_rpc        , event, 3, []},
     {dlink_tls_conn       , event, 3, []},
     {dlink_bt_rpc         , event, 3, []},
     {bt_connection        , event, 3, []},
     {dlink_sms_rpc        , event, 3, []},
     {schedule_rpc         , event, 3, []},
     {proto_json_rpc       , event, 3, []},
     {proto_msgpack_rpc    , event, 3, []},
     {rvi_common           , event, 3, []},
     {?MODULE              , event, 3, []}
     | tr_ttb:default_patterns()].

flags() ->
    {all, call}.
Then, we instrument our test suite(s):
t_multicall_sota_service(Config) ->
    with_trace(fun t_multicall_sota_service_/1, Config,
     	       "t_multicall_sota_service").

t_multicall_sota_service_(_Config) ->
    %% the actual test case
    Data = <<"abc">>,
...The module tr_ct contains a wrapper function, tr_ct:with_trace/3,
which calls the above tr_ttb:on_nodes/3 at a chosen time, applies
a test function, and fetches and pretty-prints the trace data if the
test function fails. Note that if collect => always, fetching and
pretty-printing will happen even if the test case succeeds.
Example, from the mnesia_rocksdb project
mrdb_two_procs(Config) ->
    tr_ct:with_trace(fun mrdb_two_procs_/1, Config,
                     tr_flags(
                       {self(), [call, sos, p]},
                       tr_patterns(
                         mrdb, [ {mrdb, insert, 2, x}
                               , {mrdb, read, 2, x}
                               , {mrdb, activity, x} ], tr_opts()))).

mrdb_two_procs_(Config) ->
    ....

tr_opts() ->
    #{patterns => [ {mrdb, '_', '_', x}
                  , {mrdb_lib, '_', '_', x}
                  , {tr_ttb, event, 3, []}
                  , {?MODULE, go_ahead_other, 3, x}
                  , {?MODULE, wait_for_other, 3, x}
                  , {?MODULE, await_other_down, 3, x}
                  , {?MODULE, do_when_p_allows, 4, x}
                  , {?MODULE, allow_p, 3, x}
                  ]}.

tr_patterns(Mod, Ps, #{patterns := Pats} = Opts) ->
    Pats1 = [P || P <- Pats, element(1,P) =/= Mod],
    Opts#{patterns => Ps ++ Pats1}.

tr_flags(Flags, Opts) when is_map(Opts) ->
    Opts#{flags => Flags}.
The with_trace/3 wrapper will derive the output filename from the
Common Test Config: either via the property destination, or via
the test case name, taken from the tc_logfile property maintained
by the Common Test support logic. In the latter case, a ".tr_ct"
suffix is added to the test case name.
In the wrapper, we determine which nodes to include in the trace,
give the trace a name, then call the test case within a try ... catch.
If the test succeeds, we call stop_nofetch(), discarding the trace,
otherwise, we fetch the trace logs and merge them, pretty-printing
the result.
with_trace(F, Config, File) ->
    Nodes = [N || {N,_} <- get_nodes()],
    rvi_ttb:on_nodes([node()|Nodes], File),
    try F(Config)
    catch
	error:R ->
	    Stack = erlang:get_stacktrace(),
	    ttb_stop(),
	    ct:log("Error ~p; Stack = ~p", [R, Stack]),
	    erlang:error(R);
	exit:R ->
	    ttb_stop(),
	    exit(R)
    end,
    rvi_ttb:stop_nofetch(),
    ok.

ttb_stop() ->
    Dir = rvi_ttb:stop(),
    Out = filename:join(filename:dirname(Dir),
			filename:basename(Dir) ++ ".txt"),
    rvi_ttb:format(Dir, Out),
    ct:log("Formatted trace log in ~s~n", [Out]).
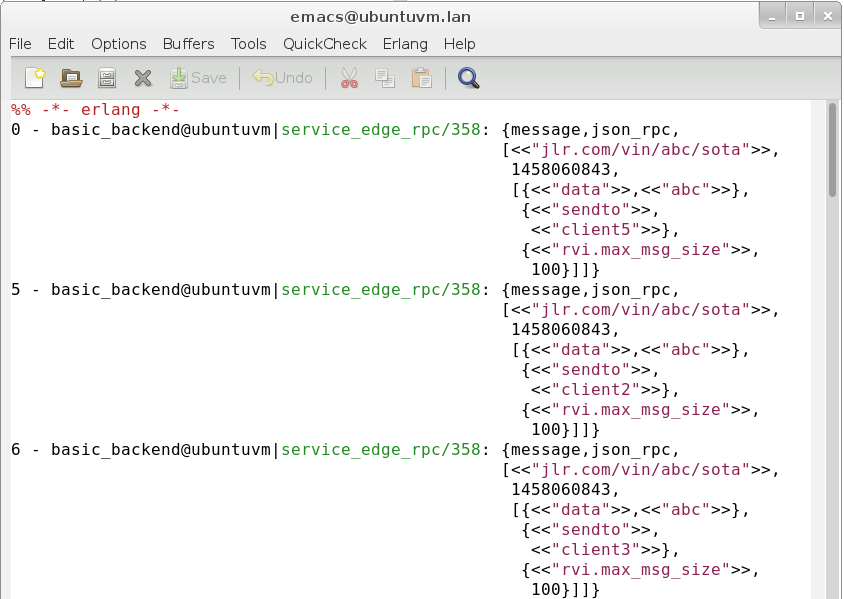
On test failure, this would result in the following output in the CT log:
The formatted text log has an emacs erlang-mode header, so is best viewed in emacs.
Note that the log formatter prefixes each message with the relative time
(in ms) since the start of the trace, the name of the node where the
trace event originated and the module/line of the traced call.
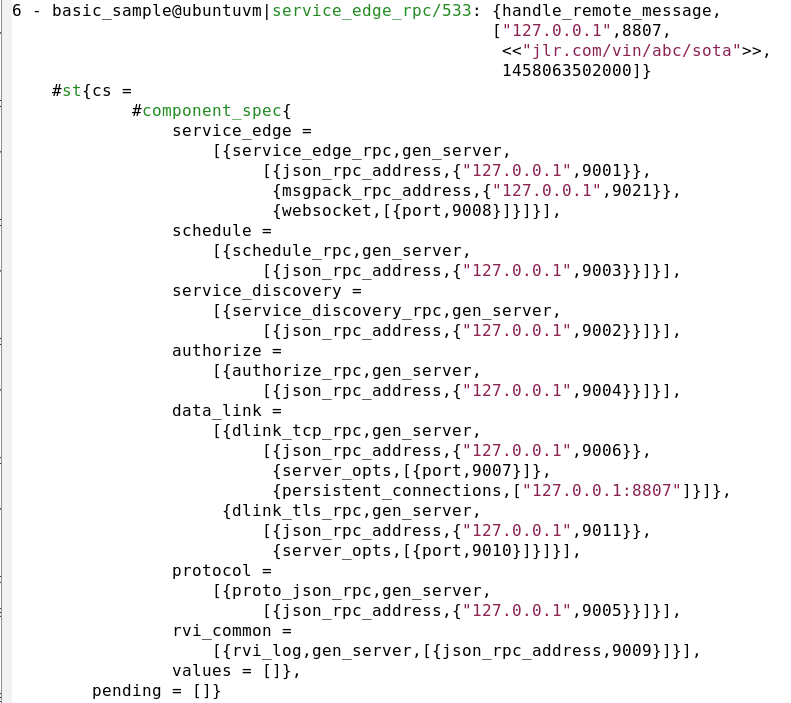
It also tries to pretty-print records, looking for a
record_fields(RecName) callback in the module named in the call trace.
A record_fields/1 function might look like this:
record_fields(service_entry)	-> record_info(fields, service_entry);
record_fields(st           )	-> record_info(fields, st);
record_fields(component_spec)	-> record_info(fields, component_spec);
record_fields(_) -> no.For some test cases, it may be useful to defer tracing start until the point
where tricky stuff starts happening. This can be done with the functions
tr_ct:set_activation_checkpoint(Label, Config), and
tr_ct:trace_checkpoint(Label, Config).
Example:
init_per_suite(Config) ->
    tr_ct:set_activation_checkpoint(?TABS_CREATED, Config).

...

encoding_sext_attrs(Config) ->
    tr_ct:with_trace(fun encoding_sext_attrs_/1, Config,
                     tr_patterns(mnesia_rocksdb,
                                 [{mnesia_rocksdb,'_',x}], tr_opts())).

encoding_sext_attrs_(Config) ->
    Created = create_tabs([{t, [{attributes, [k, v]}]}], Config),
    ok = mrdb:insert(t, {t, 1, a}),
    ok = mnesia:dirty_write({t, 2, b}),
    expect_error(fun() -> mrdb:insert(t, {t, a}) end, ?LINE,
                 error, {mrdb_abort, badarg}),
    expect_error(fun() -> mnesia:dirty_write({t, a}) end, ?LINE,
                 exit, '_'),
    delete_tabs(Created),
    ok.

...

create_tabs(Tabs, Config) ->
    Res = lists:map(fun create_tab/1, Tabs),
    tr_ct:trace_checkpoint(?TABS_CREATED, Config),
    Res.
The above test setup will cause tracing to start only after create_tabs/2
has been completed.
The pretty-printer allows terms to be custom-formatted using a pp_term(Term) callback,
optionally exported from the callback module. The semantics of the callback is:
pp_term(Term) -> {yes, Term1} | no.The custom formatting function can call on subsequent pp_term/1 callbacks using
the trace_runner helper function tr_ttb:pp_term(Term, Mod) -> Term1.
The helper unwraps any {yes, ...} tuples etc., returning either a modified term
or the original term.
Instead of a callback module, tr_ttb:pp_term/2 can take a fun as second argument.
Technically, the implementation is:
pp_term(T, M) when is_atom(M) ->
    pp_term(T, fun M:pp_term/1);
pp_term(T, F) when is_function(F, 1) ->
    try F(T) of
        {yes, Out} ->
            Out;
        no         -> pp_term_(T, F)
    catch
        error:_ ->
            pp_term_(T, F)
    end.
... where pp_term_/2 traverses the term, looking for opportunities to pretty-print
sub-terms. That is, by returning no, the callback allows the traversal to continue.
If it is known that no opportunities to pretty-print exist in a subterm, returning
{yes, Term} will stop further inspection in that area.
As an example of how layered pretty-printing can be leveraged, see the pretty-printing
of Merkle Patricia Trees (MPT) in the Aeternity system. MPTs are particularly hard
to read in raw form, partly since terms are encoded twice. The pp_term/1 callbacks
at the application level therefore first call on a generic helper function, which
converts a tree to a key-value list, then applies application-specific decoding of
the stored terms. Note the trick to tag custom-formatted terms with '$...' tags,
both to help the reader and to allow higher levels to detect and further refine
the data.
record_fields(_) -> {check_mods, [ aec_accounts ]}.

pp_term(Term) ->
    aeu_mp_trees:tree_pp_term(Term, '$accounts', fun aec_accounts:deserialize/2).
The helper function:
%% Utility trace support for state tree modules
%%
tree_pp_term(#mpt{} = Term, CacheTag, XForm) ->
    Dec = fun(X) -> pp_mpt_decode(X, CacheTag, XForm) end,
    {yes, tr_ttb:pp_term(tr_ttb:pp_term(Term, aeu_mtrees), Dec)};
tree_pp_term(_, _, _) ->
    no.

pp_mpt_decode({'$mpt', L}, Tag, XForm) ->
    {yes, {Tag, [{K, XForm(K, V)}
                 || {K, V} <- L]}};
pp_mpt_decode(_, _, _) ->
no.The pretty-printer uses a generalized version of the record_print_fun used in
io_lib_pretty.erl. This way, record_fields(Term) can be exported from the
callback module. In addition to the normal {yes, FieldNames} | no returns,
the callbacks can also return {check_mods, Modules}, instructing the caller
to inspect any record_fields/1 callbacks of the listed modules.
The function tr_ttb:pr(Term, Module) can be used to similar effect as
lager:pr(Term, Module). It's intended to be used in e.g. log output
and will try to pretty-print a record for a single line, given the record_info()
data accessible via Module.
Shell tracing can make use of the same instrumented pretty-printing via the
function tr_ttb:dbg_tracer(Options) function. This starts a dbg tracer
which calls on the pretty-printing callbacks described above. As formatting
is likely to be slower, it is recommended that tracing is stopped using the
function tr_ttb:dbg_stop(), which waits until the tracer process has processed
queued trace messages before stopping it.
The optional Options argument is a map, and supports the following options:
fd           - the output descriptor. Defaults to the group_leader of the current process
print_header - whether to print the preamble mainly meant for emacs. Defaults to 'false'
limit        - How many lines of trace output to print. Defaults to 'infinity'
time_resolution - millisecond | microsecond. Defaults to 'millisecond'
delay        - The trace handler will sleep for the given number of milliseconds
shell_records - If possible, records definitions stored in the shell via `rr(Mod)` will be used
The delay option, e.g. delay => 1000 causes a sleep when encountered. The option is then removed
from the accumulator. A callback could then reinsert it for another sleep, although currently, there is
no provision for user modification of the accumulator state.
In the future, more log formatting options may be added. Pull requests are welcome.
If Patterns is given as a list, all patterns will be applied as in ttb:start_trace/4.
tr_ttb also supports an extended description:
PatternMap :: #{ start := [tuple()]
               , tp   => [{M, F, A, MatchSpec}]
               , tpl  => [{M, F, A, MatchSpec}]
               , tpe  => [{Event, MatchSpec}]
               , ctp  => [{M, F, A}]
               , ctpl => [{M, F, A}]
               , ctpg => [{M, F, A}]
               , ctpe => [Event] }.
When this form is used, the start element (mandatory) is passed to ttb:start_trace/4,
and then, the corresponding functions, ttb:tp/2, ttb:tpl/2, ... are called for those
other elements that are present. Note that all the other elements are optional.
This allows the caller to e.g conveniently set a wildcard trace pattern for a whole module, then selectively turn of trace on a few specific functions in that module.


