
![]()
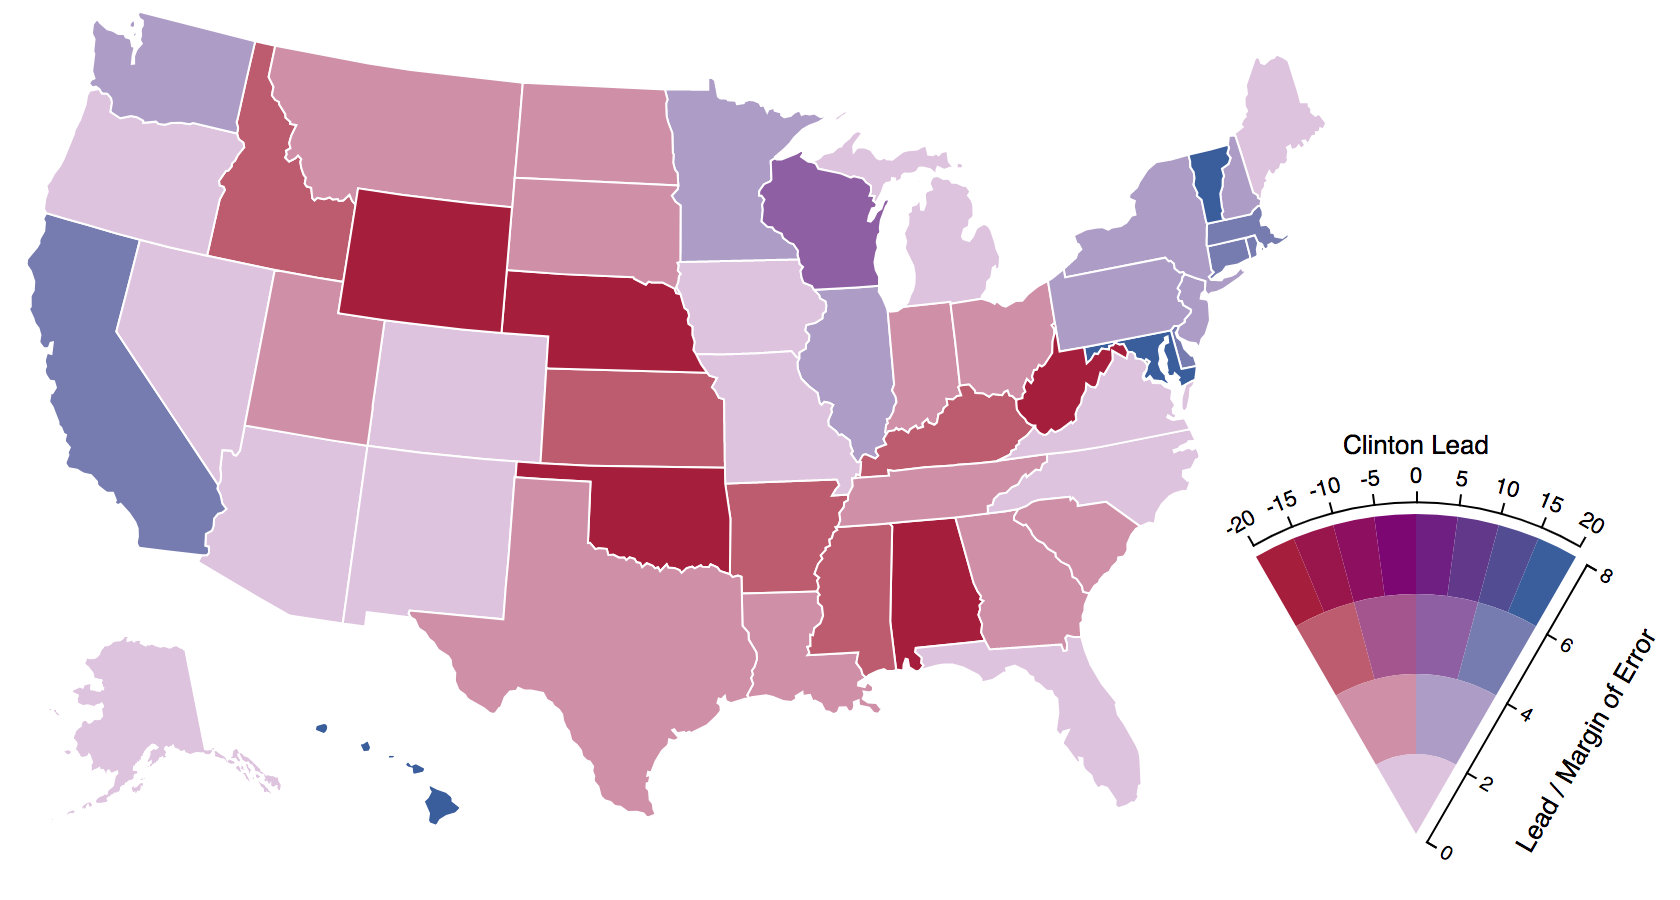
Code for generating Value-Suppressing Uncertainty Palettes for use in D3 charts. Read more about VSUPs in our introductory blog post and our research paper.
These examples are served from the examples directory.
If you use this module for a publication, please cite VSUPs as:
@inproceedings{2018-uncertainty-palettes,
 title = {Value-Suppressing Uncertainty Palettes},
 author = {Michael Correll AND Dominik Moritz AND Jeffrey Heer},
 booktitle = {ACM Human Factors in Computing Systems (CHI)},
 year = {2018},
 url = {http://idl.cs.washington.edu/papers/uncertainty-palettes},
}yarn add vsup or include the library directly from jsdelivr as https://cdn.jsdelivr.net/npm/vsup.
<script src="https://cdn.jsdelivr.net/npm/vsup@latest"></script>Quantization <>
A quantization defines how values or objects of the form {u: number, v: number} (uncertainty and value) are quantized. They are used instead of a domain in VSUP scales.
This module supports three different quantizations: linearQuantization, squareQuantization, and quantization.
This is a wrapper around d3.scaleQuantize.
Defines a quantization into a rectangular matrix of value and uncertainty.
The constructor takes a single argument n, the number of rows and columns.
var q = vsup.squareQuantization(3);q is then a function that can be used to discretize uncertainties and values.
> q(0.2,0.1);
{u: 0, v: 0.16666666666666666}
The quantization has the following methods:
rangenmatrixdatauncertaintyDomainvalueDomain
Similar to squareQuantization but creates a tree quantization. The constructor takes two arguments branchingFactor and treeLayers.
The quantization has the following methods:
rangebranchinglayerstreedatauncertaintyDomainvalueDomain
Scales <>
The interface to create a scale mirrors scales in D3. The difference of VSUP scales is that they use a quantization instead of a domain. The range can be set to any color range.
The constructor takes three optional arguments: mode (usl, us, ul), range, and quantization. It returns a function that takes two arguments value and uncertainty.
For example
var s = vsup.scale();s is now a function that takes two arguments
> s(0.8, 0.1);
"rgb(137, 214, 99)"
The scale has the following methods:
rangeto get or set the color range (e.g.d3.interpolateViridis)colorListcolorDistsmodequantize
Legends <>
This module implements three kinds of legends (simpleLegend, heatmapLegend, and arcmapLegend) corresponding to the three quantization types.
To add a legend to the DOM, create a legend and attach it to an element. For example:
var legend = vsup.legend().arcmapLegend();
svg.append("g").call(legend)
You can find example code in test/legend.html.
A simple legend for linear quantizations.

A rectangular legend for tree quantization or square quantization.

A legend for a tree quantization.

- Test the examples in
test yarn versionnpm publishgit push --tags