Description
This is a demo project experimenting with Scala, Finatra and the InfluxDB. This three-tier application collects metrics (currently CPU) at the client, sends these to the backend which in turn ingests the data to an InfluxDB instance. In addition, the server application provides API operations that allow insights regarding metric history in general and on certain clients in particular.
Setup
- the serve stores the metrics in an influxdb and makes the visible through a Grafana interface
- the following docker container bundles both, Grafana and Influxdb
docker run -d \
 --name docker-influxdb-grafana \
 -p 3003:3003 \
 -p 3004:8083 \
 -p 8086:8086 \
 -p 22022:22 \
 -v /home/twiechert/data/influxdb:/var/lib/influxdb \
 -v /home/twiechert/data/grafana:/var/lib/grafana \
 philhawthorne/docker-influxdb-grafana:latest
- influx interface http://localhost:3004/
navigate to the interface and make sure the database METRICS is created
- grafana interface http://localhost:3003/login root:root
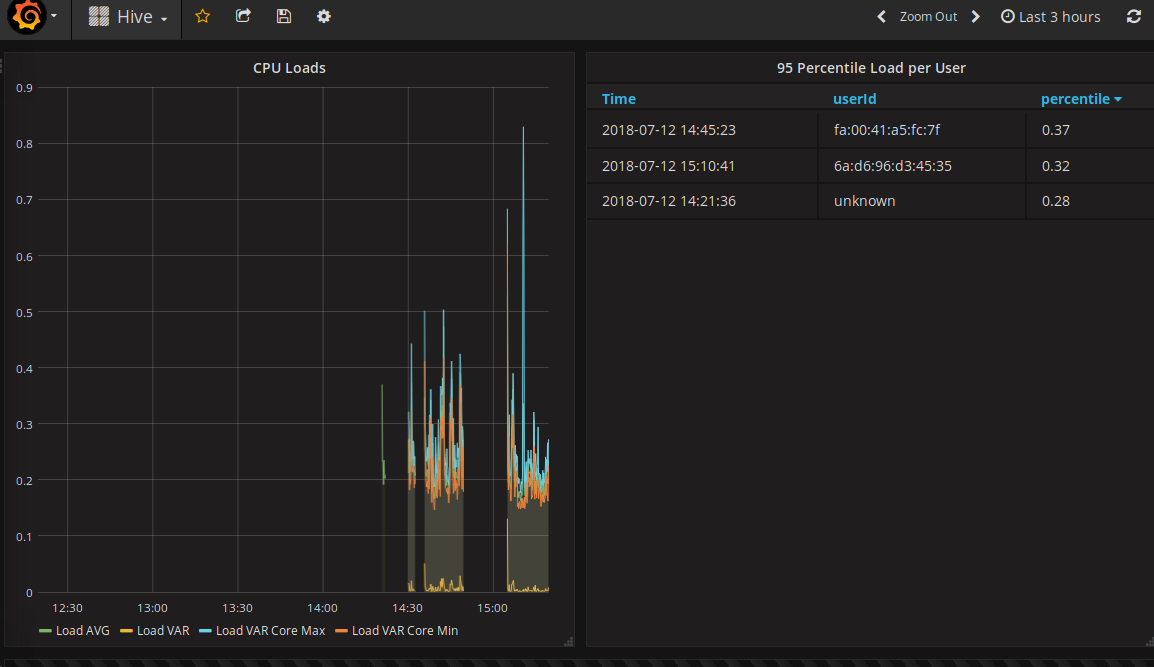
Server
The server stores metrics that it receives through its HTTP based API on InfluxDB. Data is then visualized in a Grafana dashboard
API Operations
- POST /api/v1/metrics
curl --header "Content-Type: application/json" \
  --request POST \
  --data '{
            "user_id": "6a:d6:96:d3:45:35",
            "start_timestamp": 1531402660605,
            "end_timestamp": 1531402665626,
            "observations_per_metric": 100,
            "os_type": "Linux",
            "os_version": "18.04 LTS",
            "metrics": [
              {
                "type": "CPU",
                "avg_utilization": 0.2148631642976225,
                "var_utilization": 0.005718669350831782,
                "avg_utilization_by_core": [
                  0.19575989029493227,
                  0.19210218632004747,
                  0.24848360030511063,
                  0.18310711960197185
                ],
                "var_utilization_by_core": [
                  0.0033936742208834853,
                  0.002245358139130047,
                  4.7853845483180853E-4,
                  0.0030582163825456816
                ],
                "name": "CpuUtilization"
              }
            ]
          }
' \
  http://localhost:8888/api/v1/metrics
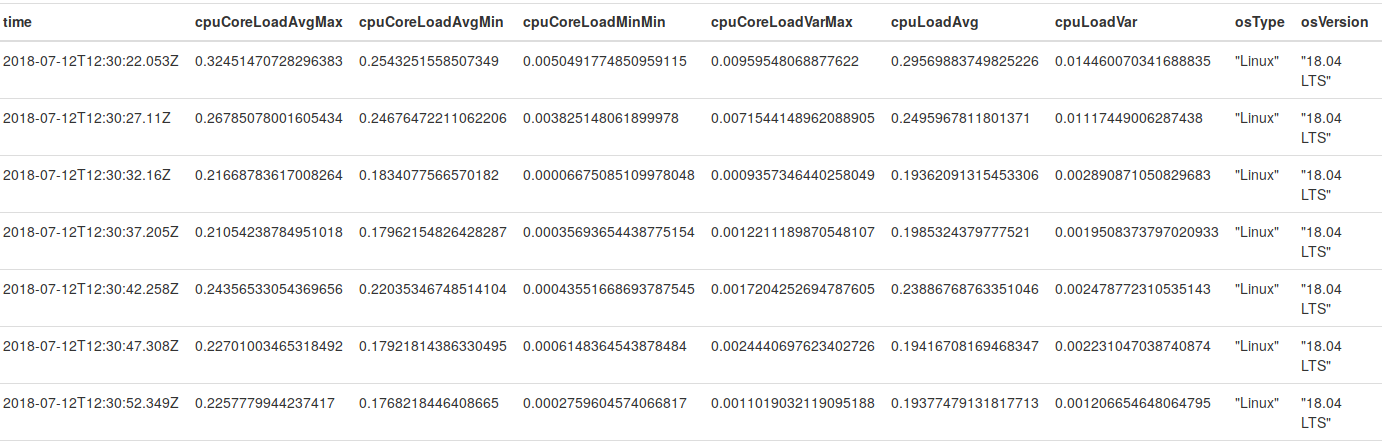
- GET /api/v1/metrics/:metric/byUser/:userId
curl --header "Content-Type: application/json" \
  --request GET \
  --data '{
            "start":"2018-07-12T12:15:00Z",
            "end": "2018-07-12T16:15:00Z",
            "resample_rate" : "15m"
          }
' \
  http://localhost:8888/api/v1/metrics/cpuLoadAvg/byUser/6a:d6:96:d3:45:35
Client
The client collects the follwing stats which it sends to the backend
-
CPU utilization per core over time
-
The client pre-aggregates the metrics in order to reduce the amount of network traffic and computation cost on our servers
Build and Run
- first build a fat jar that contains all required dependencies
cd client && sbt assembly
- then run the generated jar
java -jar client/target/scala-2.12/metrics-client-assembly-0.1.jar
Future Work
Bi-Directional Communication
- allow bidirectional communication between server and client
- server would then be able to issue commands to the client (for example to change the sampling frequency)
Proactive Notifications
- process the stream of metric reports in a proactive fashion, interested applications can then consme this data