
How much does a used Toyota cost? Source: Johnathan Ciarrocca, Unsplash.com
This dataset comes from a collection of UK Used Car listing that were scraped and assembled for use. I chose to start off with the Toyota dataset because I happen to own one myself. The price is in English Pounds but for the use of this notebook I don't think I will be dealing with it - though I suppose I could figure out how to determine the exchange rate into Dollars depending on the year. I'm more interested in doing some EDA of the dataset and then building some Regression Models. Perhaps my model could one day estimate how much my own Toyota is worth!
- Introduction
- Project Summary
- Repo Contents
- Prerequisites
- Feature and Definitions
- Results
- Future Work
- Built With, Contributors, Authors, Acknowledgments
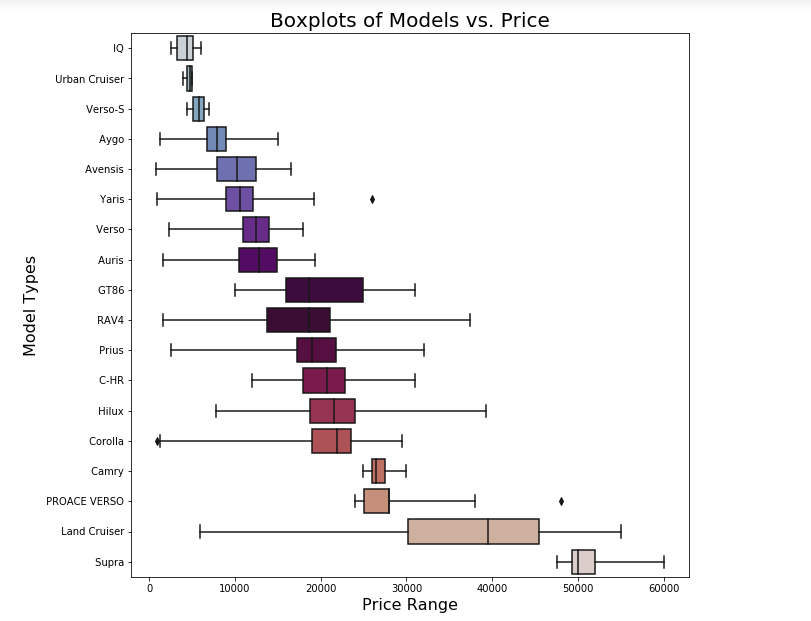
Boxplot of Price and Model Types
This repo contains the following:
- README.md - this is where you are now!
- Used_Car_Price_Notebook.ipynb - the Jupyter Notebook containing the finalized code for this project.
- LICENSE.md - the required license information.
- toyota.csv - the file containing the dataset in csv.
- CONTRIBUTING.md
- Images
These are the libraries that I used in this project.
-
import pandas as pd
-
import numpy as np
-
import matplotlib.pyplot as plt
-
%matplotlib inline
-
import seaborn as sns
-
from sklearn.model_selection import train_test_split
-
from sklearn.preprocessing import StandardScaler
-
from sklearn.linear_model import LinearRegression
-
from sklearn.svm import SVR
-
from sklearn.tree import DecisionTreeRegressor
-
from sklearn.neighbors import KNeighborsRegressor
-
import statsmodels.api as sm
-
from sklearn.metrics import mean_squared_error
-
from sklearn.model_selection import cross_val_score
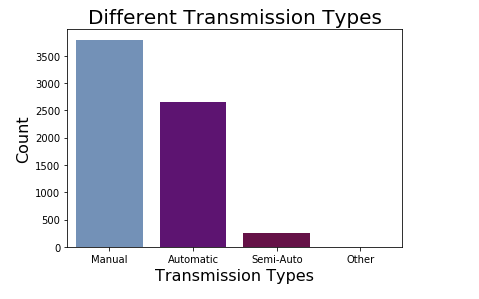
Different Transmission Types in the dataset
These are the features of this dataset.
- 5 numerical columns: 'price', 'mileage', 'tax', 'mpg' and 'engineSize'
- 3 categorical columns: 'model', 'transmission' and 'fuelType'
- 1 date column: 'year'
- LinearRegression
- SVR
- DecisionTreeRegressor
- KNeighborsRegressor
- Statsmodel OLS
From my EDA, I can conclude that a car's price is indirectly related to it's mileage. And the size of the engine is a good predictor of price since there is a direct relationship. I tried to use log transformations to remove some of the skewness in the 'mpg' and 'mileage' features but it caused an error in my models. I also used StandardScaler to fit some data AFTER performing the test/train split. The Decision Tree and Linear Regressor models had the lowest RMSE. The OLS Model had a high R^2 value but had too much multicollinearity and high p-values for me to accept this score.
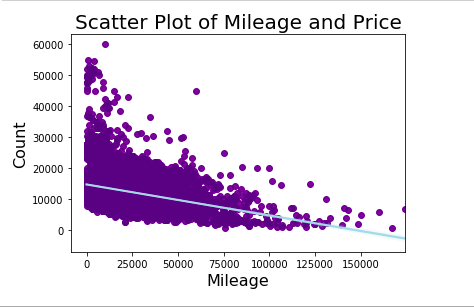
Mileage vs Price Reg Plot
Remove some of the features, especially all the random car types and 'other' things. Check out my Cross Val score more as well as hig p-values.

Roadside assistance required! Source: Jamie Brelsford, freeimages.com
Jupyter Notebook Python 3.0 scikit.learn
Please read CONTRIBUTING.md for details
Thomas Whipple
Please read LICENSE.md for details
Kaggle - 100,000 UK Used Car Data set