
Earthquake distruction in Nepal - can the data help prevent disaster? Picture Source: Adli Wahid, unsplash.com
I'm trying to predict the ordinal variable "damage_grade", which represents a level of damage to the building that was hit by the earthquake caused by the 2015 Gorkha earthquake in Nepal. There are 3 grades of the damage:
1 represents low damage 2 represents a medium amount of damage 3 represents almost complete destruction
We are predicting the level of damage from 1 to 3. The level of damage is an ordinal variable meaning that ordering is important. This can be viewed as a classification or an ordinal regression problem. (Ordinal regression is sometimes described as an problem somewhere in between classification and regression.)
To measure the performance of our algorithms, we'll use the F1 score which balances the precision and recall of a classifier.
- Introduction
- README Outline
- Repo Contents
- Libraries and Prerequisites
- Feature and Definitions
- Models
- Conclusions
- Future Work
- Built With, Contributors, Authors, Acknowledgments

A picture of one village in the mountains and how the buildings look. Source: Kalle Kortelainen, Unsplash.com
This repo contains the following:
- README.md - this is where you are now!
- Modeling_Earthquake_Damage.ipynb - the Jupyter Notebook containing the finalized code for this project.
- LICENSE.md - the required license information.
- Data - test.csv and train.csv files
- CONTRIBUTING.md
- Images - contains the fun images to this repo.
These are the libraries that I used in this project.
- import pandas as pd
- import numpy as np
- import matplotlib.pyplot as plt
- %matplotlib inline
- import seaborn as sns
- from sklearn.metrics import (accuracy_score, f1_score, confusion_matrix, classification_report, confusion_matrix)
- from sklearn.neighbors import KNeighborsClassifier
- from sklearn.ensemble import RandomForestClassifier
- from sklearn.linear_model import LogisticRegression
- from sklearn.svm import SVR
There are 39 columns in this dataset, where the building_id column is a unique and random identifier. The remaining 38 features are described in the section below. Categorical variables have been obfuscated random lowercase ascii characters. The appearance of the same character in distinct columns does not imply the same original value.
Columns
- geo_level_1_id, geo_level_2_id, geo_level_3_id (type: int): geographic region in which building exists, from largest (level 1) to most specific sub-region (level 3). Possible values: level 1: 0-30, level 2: 0-1427, level 3: 0-12567.
- count_floors_pre_eq (type: int): number of floors in the building before the earthquake.
- age (type: int): age of the building in years.
- area_percentage (type: int): normalized area of the building footprint.
- height_percentage (type: int): normalized height of the building footprint.
- land_surface_condition (type: categorical): surface condition of the land where the building was built. Possible values: n, o, t.
- foundation_type (type: categorical): type of foundation used while building. Possible values: h, i, r, u, w.
- roof_type (type: categorical): type of roof used while building. Possible values: n, q, x.
- ground_floor_type (type: categorical): type of the ground floor. Possible values: f, m, v, x, z.
- other_floor_type (type: categorical): type of constructions used in higher than the ground floors (except of roof). Possible values: j, q, s, x.
- position (type: categorical): position of the building. Possible values: j, o, s, t.
- plan_configuration (type: categorical): building plan configuration. Possible values: a, c, d, f, m, n, o, q, s, u.
- has_superstructure_adobe_mud (type: binary): flag variable that indicates if the superstructure was made of Adobe/Mud.
- has_superstructure_mud_mortar_stone (type: binary): flag variable that indicates if the superstructure was made of Mud Mortar - Stone.
- has_superstructure_stone_flag (type: binary): flag variable that indicates if the superstructure was made of Stone.
- has_superstructure_cement_mortar_stone (type: binary): flag variable that indicates if the superstructure was made of Cement Mortar - Stone.
- has_superstructure_mud_mortar_brick (type: binary): flag variable that indicates if the superstructure was made of Mud Mortar - Brick.
- has_superstructure_cement_mortar_brick (type: binary): flag variable that indicates if the superstructure was made of Cement Mortar - Brick.
- has_superstructure_timber (type: binary): flag variable that indicates if the superstructure was made of Timber.
- has_superstructure_bamboo (type: binary): flag variable that indicates if the superstructure was made of Bamboo.
- has_superstructure_rc_non_engineered (type: binary): flag variable that indicates if the superstructure was made of non-engineered reinforced concrete.
- has_superstructure_rc_engineered (type: binary): flag variable that indicates if the superstructure was made of engineered reinforced concrete.
- has_superstructure_other (type: binary): flag variable that indicates if the superstructure was made of any other material.
- legal_ownership_status (type: categorical): legal ownership status of the land where building was built. Possible values: a, r, v, w.
- count_families (type: int): number of families that live in the building.
- has_secondary_use (type: binary): flag variable that indicates if the building was used for any secondary purpose.
- has_secondary_use_agriculture (type: binary): flag variable that indicates if the building was used for agricultural purposes.
- has_secondary_use_hotel (type: binary): flag variable that indicates if the building was used as a hotel.
- has_secondary_use_rental (type: binary): flag variable that indicates if the building was used for rental purposes.
- has_secondary_use_institution (type: binary): flag variable that indicates if the building was used as a location of any institution.
- has_secondary_use_school (type: binary): flag variable that indicates if the building was used as a school.
- has_secondary_use_industry (type: binary): flag variable that indicates if the building was used for industrial purposes.
- has_secondary_use_health_post (type: binary): flag variable that indicates if the building was used as a health post.
- has_secondary_use_gov_office (type: binary): flag variable that indicates if the building was used fas a government office.
- has_secondary_use_use_police (type: binary): flag variable that indicates if the building was used as a police station.
- has_secondary_use_other (type: binary): flag variable that indicates if the building was secondarily used for other purposes.
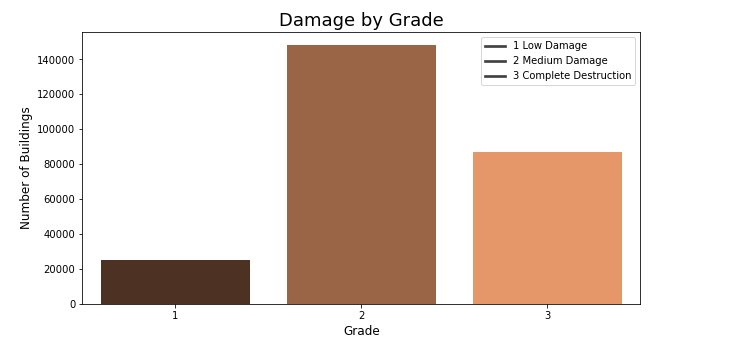
Dealing with an imbalanced dataset!
- KNeighbors Classifier
- Random Forest Classifier
- Logistic Regression
- Support Vector Regression
- Support Vector Classifier
- XGBoost
My base model where I excluded all of the non-linear features with very little cleaning other than the Min/Max Scaler worked best with the Random Forest and returned an accuracy score of 72%. I couldn't get all of the models to run, probably because of the imbalanced dataset with I need to attempt to deal with, along with adding in the non-continuous features.
Then I created a balanced dataset where all three of the target variables of damage_grade had the same number of rows using up-sampling and down-sampling. Unfortunately, this just gave me a better training score but lowered my accuracy for the test group - probably resulting in over-fitting. The score for the forest model returned an f1_score of 78% but with the actual test group the score was 68%.
I tried a third time with XGB and the Standard Scalar (even though there didn't seem to be any difference between the Min/Max Scalar and the Standard Scalar on the Random Forest Model). This time the model did slightly better for the submission but still not great - 73%, which was actually better than my own testing score.
Finally I tried using get_dummies to include all of the categorical columns. Though not only did this add a lot of columns it didn't improve the score - so in the end I left it out. Considering the leader of the board had only a score of 0.7560 I feel like I was pretty close!
Dealing with an imbalanced dataset!
I still would like to know more about dealing with the unbalanced data set as well as all the categorical columns. Plus, I need to do some hypertuning of parameters and take a closer look at the feature importance. Perhaps I can build a faster and lighter model based on only a handful of columns.
I'm curious about what other factors could be taken into account when looking at earthquake disasters (such as number of earthquakes per year, average Richter score, and how this specific earthquake came about - tectonic plate movement, volcanic eruption, or tsunami). And can more work be done looking at historic buildings and placement in relation to the center of the earthquake.

My third submission using Standard Scalar and XGBoost on the unbalanced dataset and only continuous variables.
Jupyter Notebook Python 3.0 scikit.learn
Please read CONTRIBUTING.md for details
Thomas Whipple
Please read LICENSE.md for details
Thank you to DivenData for the fun competition and interesting data: https://www.drivendata.org/competitions/57/nepal-earthquake/page/134/