https://masst.ucsd.edu/masstplus/
MASST+ is an improvement on GNPS Mass Spectrometry Search Tool (MASST). MASST+ provides fast and error tolerant search of metabolomics mass spectrometry data while reducing the search time by two orders of magnitude. It is capable of querying against databases of billions of mass spectra, which was not feasible with MASST. Like MASST, MASST+ is publicly available as a web service on GNPS.
If you know the spectrum USI of a spectrum you want to search with MASST+, you can enter it directly at https://masst.ucsd.edu/masstplus/.
(a) First, navigate to the spectrum of interest on the GNPS library. Here, a Malyngamide C spectrum is viewed. Next, click the "MASST+" link. (c) This opens the MASST+ tab which runs a mass spectral search and presents the results.
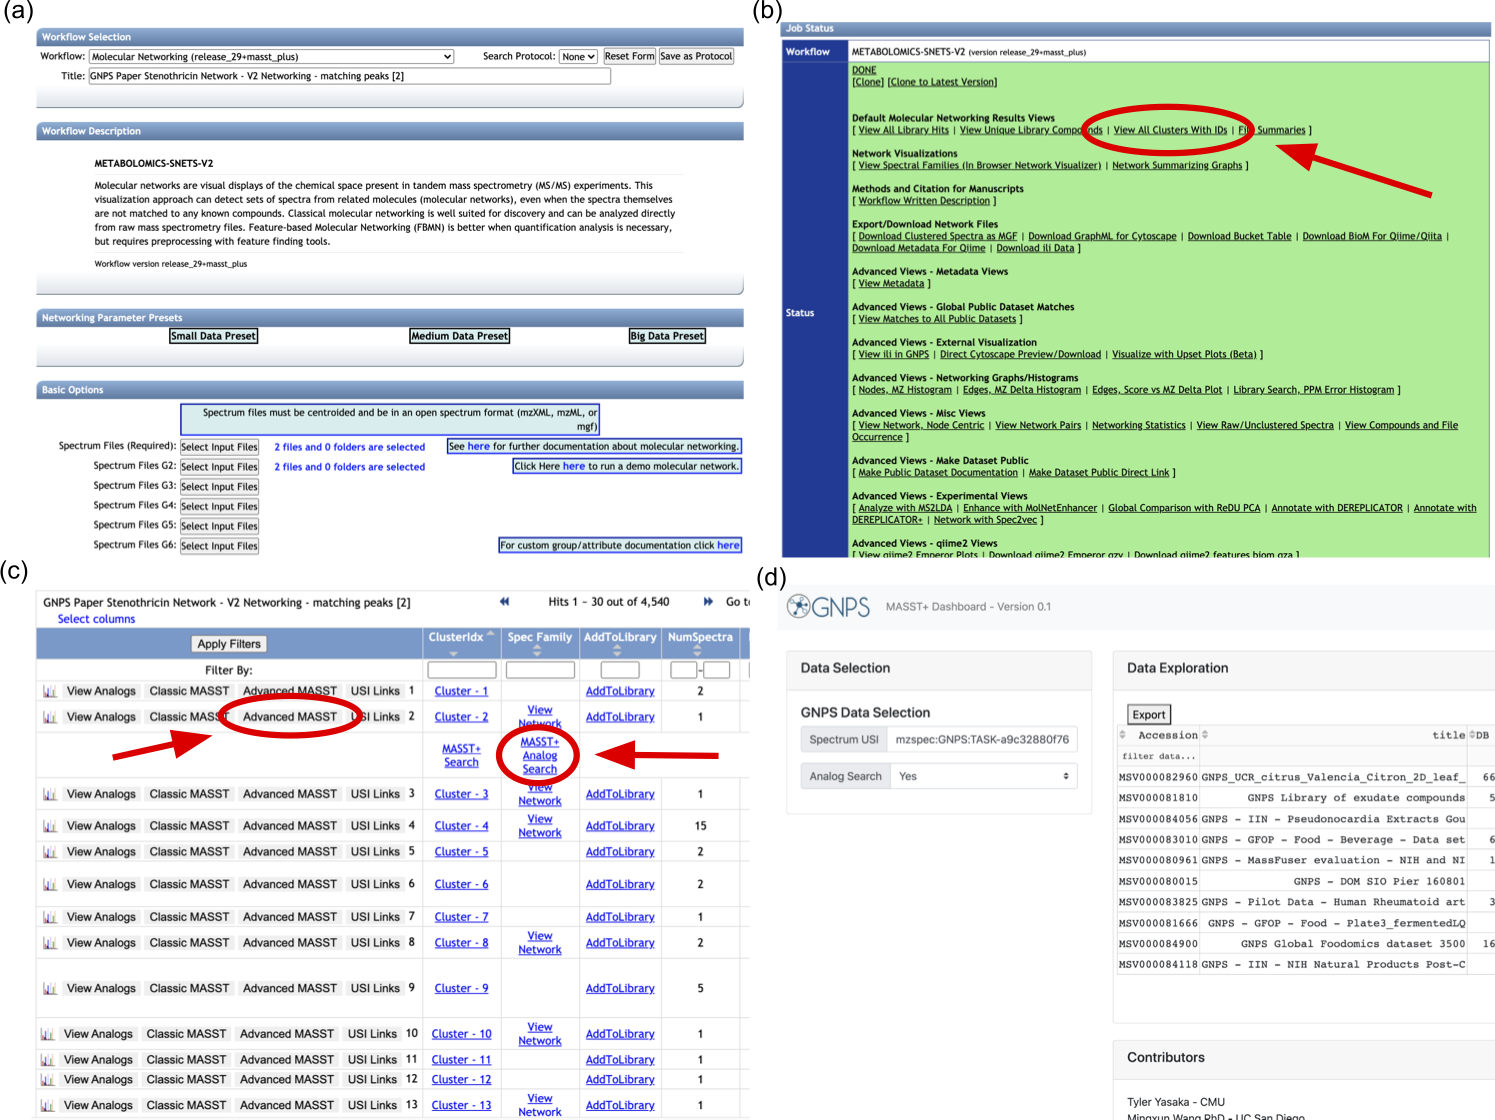
(a) Start by submitting a new molecular networking job on GNPS (this will require you to be logged in to a GNPS account). (b) When the job has completed, click "View All Clusters With IDs". (c) This will open a new tab, where you can click "Advanced MASST" and then "MASST+ Search" (or "MASST+ Analog Search") in order to start a new MASST+ search. (d) This will open a new tab for MASST+, where the search results will display after a few seconds.
We performed molecular networking (both clustering and spectral networking) using NETWORKING+ on the entirety of GNPS. We stored the results of CLUSTERING+ and PAIRING+ in tsv format.
We split the GNPS library into 9 divisions according to different precursor mass ranges and executed CLUSTERING+ on each of them. We provide the cluster information of each spectra and the centers for all clusters.
The output is in tsv format. Each row of the tsv output represents a spectra from GNPS library. The columns of the output represent:
cluster_idxis a unique ID assigned to each cluster in the divisionscanis a unique ID assigned to the each spectra in the divisionmzis the precursor mass of the spectraRTINSECONDSis the retention time of the spectraMSV_sourceis the MSV library it belongs toFilenameis the GNPS source file of this spectra inside MSV libraryLocal_scanis the spectra's scan number inside its GNPS source file
The clustering+ output files for all 9 divisions can be downloaded via the following links:
CLUSTERING+ output for division 0
CLUSTERING+ output for division 1
CLUSTERING+ output for division 2
CLUSTERING+ output for division 3
CLUSTERING+ output for division 4
CLUSTERING+ output for division 5
CLUSTERING+ output for division 6
CLUSTERING+ output for division 7
CLUSTERING+ output for division 8
We write the representative spectrum of each cluster_idx into a mgf file for each division.
The representative spectra for each cluster contains:
CLUSTERINDEXis the cluster index in the divisionCLUSTERSIZEis the number of spectra in the clusterMSV_LIBis the source MSV library of the representative spectraFILENAMEis the source GNPS file of the representative spectraLOCAL_SCANis the scan number of the representative spectra inside the GNPS source filePEPMASSis the percursor mass of the representative spectraRTINSECONDSis the retention time of the representative spectra
BEGIN IONS
CLUSTERINDEX=9
CLUSTERSIZE=282
MSV_LIB=MSV000083789
FILENAME=pos_Cd10MYY_33.mgf
LOCAL_SCAN=1069
PEPMASS=53.0051
RTINSECONDS=336.875
31.991 36
38.0024 36
38.0076 36
49.9917 111
51.9917 36
52.8466 75
53.0038 1338
53.0203 40
67.9882 72
END IONS
The spectrum file for each division can be downloaded via the following links:
cluster centers for division 0
cluster centers for division 1
cluster centers for division 2
cluster centers for division 3
cluster centers for division 4
cluster centers for division 5
cluster centers for division 6
cluster centers for division 7
cluster centers for division 8
We apply PAIRING+ to the clusters resulting from CLUSTERING+ to compute the molecular network. The network is stored in two files
The first output file stores general information for the nodes of the GNPS molecular network in tsv format. The network contains over 8M nodes (total number of non-singleton clusters resulting from CLUSTERING+) in total. Each row of the tsv output represents a node in the network. The columns of the output represent:
scan_number_among_centersis a unique ID assigned to each cluster in the networkcomponent_indexis a unique ID assigned to the each connected component in the networksource_divisionis the division this cluster came from (ranges from division0 to division8)cluster_index_in_divisionis the index of this cluster in its source divisioncluster_sizeis the size of the clustercenter_MSVis the source MSV library of the representative spectracenter_source_fileis the source GNPS file of the representative spectracenter_scan_in_source_fileis the scan number of the representative spectra inside the GNPS source filecenter_pepmassis the percursor mass of the representative spectracenter_RTis the retention time of the representative spectra
The second output file stores general information for the edges of the GNPS molecular network in tsv format. Each row of the tsv output represents an edge in the network. The columns of the output represent:
connected_component_indexis a unique ID assigned to each connected component in the networkfirst_center_scan_numberis a unique ID assigned to the each connected node in the networksecond_center_scan_numberis a unique ID assigned to the each connected node in the networkproductis the similarity dot-product between the two nodesproduct_sharedis the contribution of shared peak matches in the similarity scoreproduct_shiftedis the contribution of shifted peak matches in the similarity score

