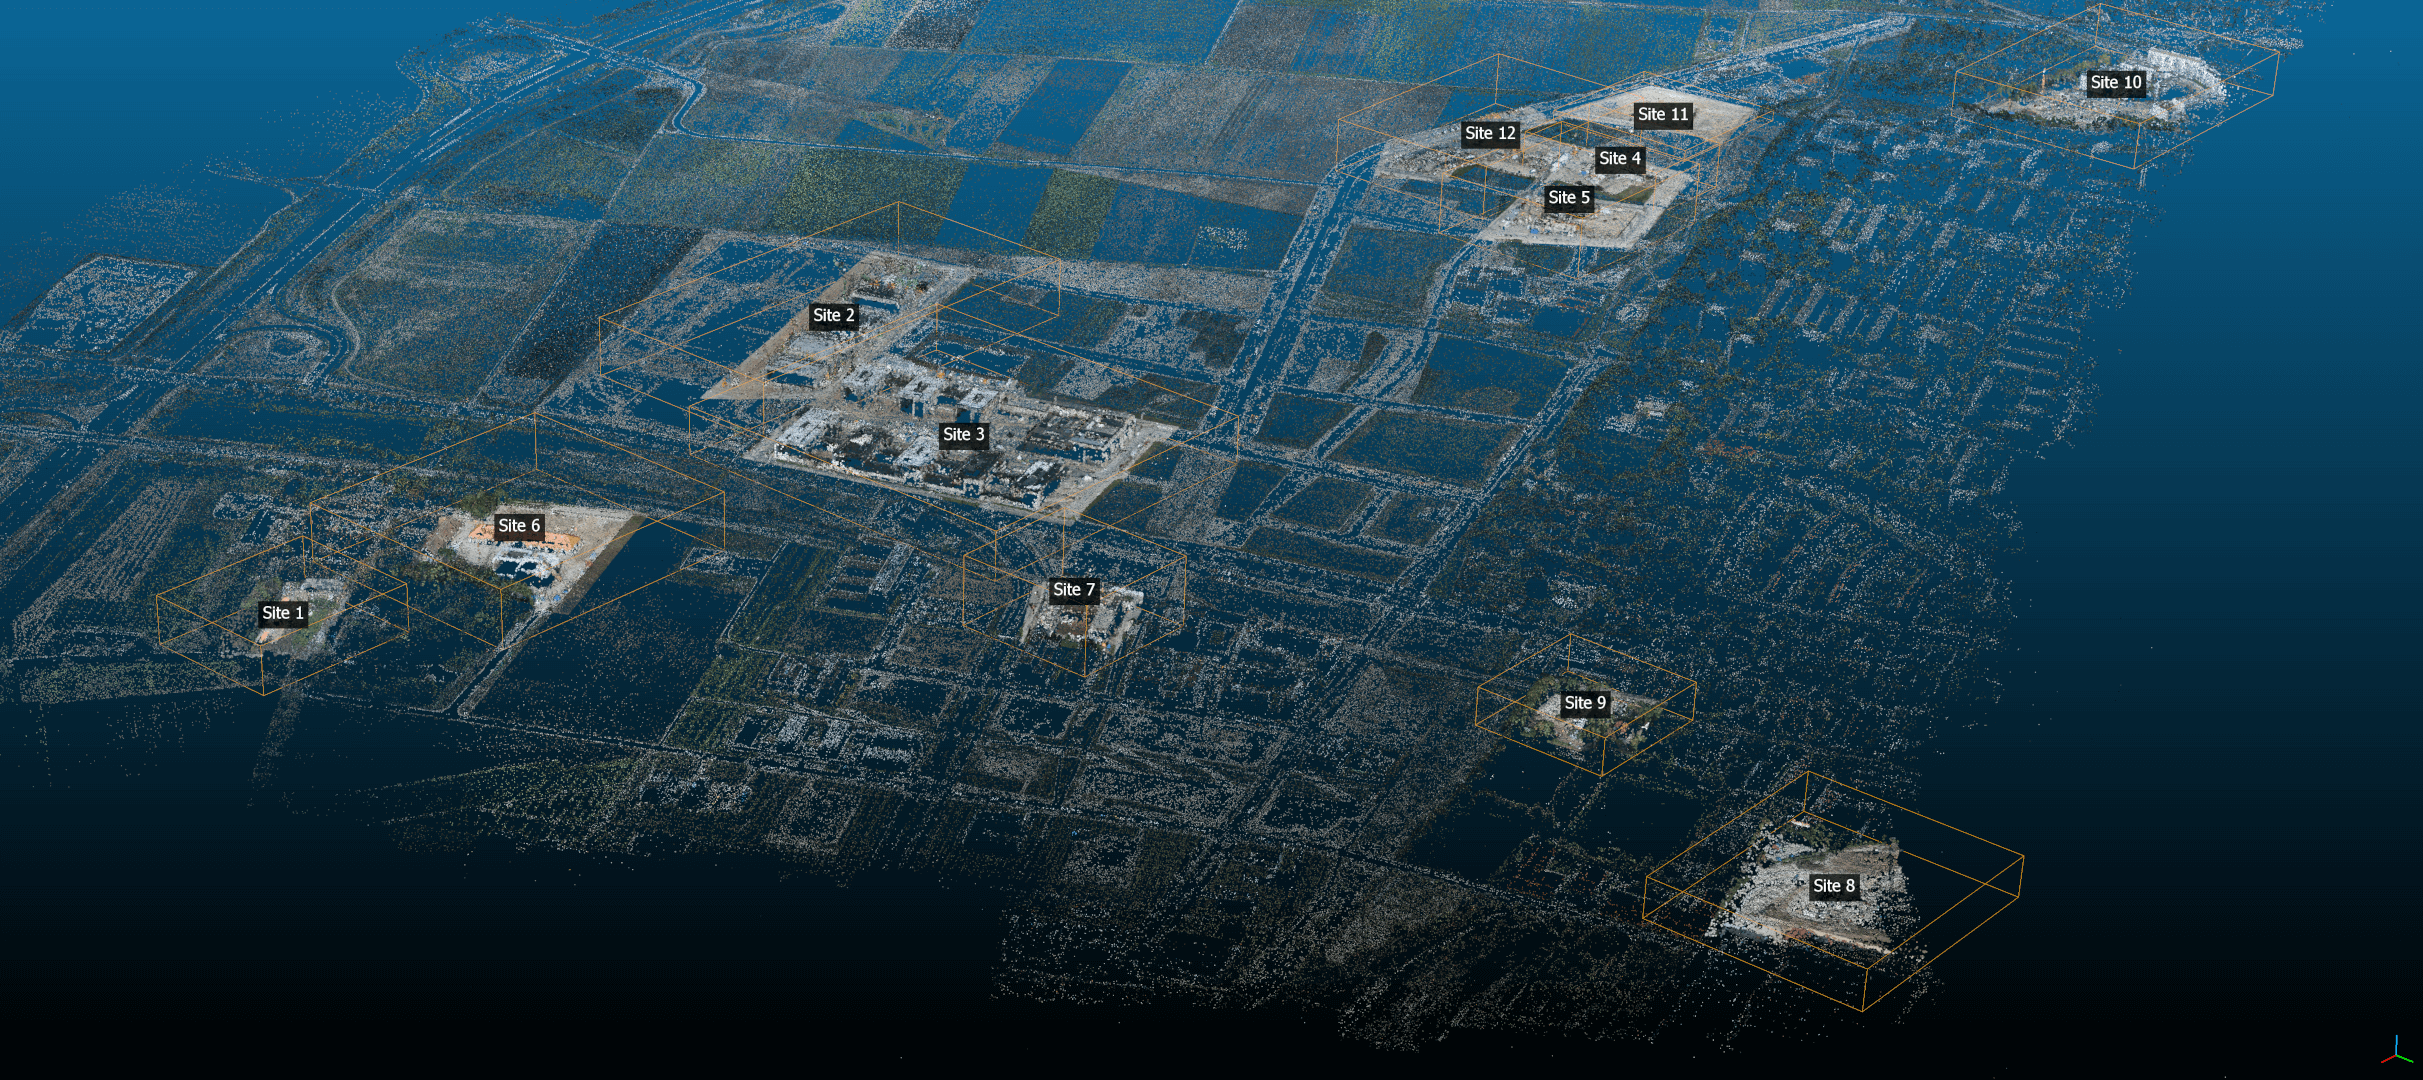
Aerial2pdsm - Extracting Areas and building point clouds from aerial surveys
This git is the accompanying code for the paper published "Adopting computer vision for extracting data from aerial images of development areas" by Jahr & Eickeler. Preferably images and GPS data of the plane / helicopter / drone is provided.
This prototype will follow this process:
- Analyze a rough set of an aerial survey (flight hight between 300 - 1000m)
- Taking object detection bounding boxes (odbb) from image detection and extracting these areas.
- If areas are recognized in multiple images, they are filtered and merge into whole "observations.
- A major image is selected, where most of the areas of all odbb are shown
- Of an inevitable overlap is present in the images; it will merge all partial bounding boxes (e.g. at the edge of the image) to one observation
- Observations have an own coordinate system that somehow resembles the one in the major image (consult the paper for more information)
- Observations are then reconstructed with colmap with different (high quality) settings
Installation
This toolchain was only developed on Linux, however, most of this code and tools are available in Windows!
Prerequisits
- install colmap (required) (https://github.com/colmap/colmap)
- install orca (optional, recommended) (https://github.com/plotly/orca)
Installation:
1.) Get this repository:
    git clone https://github.com/tumcms/aerial2pdsm.git
    cd aerial2pdsm
2.) Activate and clone the submodules:
    git submodule init
    git submodule update
3.) Install and activate the python environment (tested: 3.8.5)
    python3 -m venv ./venv
    source ./venv/bin/activate
4.) Fetch the colmap scripts. This will fetch specific files from colmap repository.
python ./submodules/populator.py
Usage:
Input data
Survey
The input was recorded from a 2-3 camera setup. Each camera was put into its own folder.
left - (mid) - right
Additionally, every image was accompanied by a file stating the recording position of a GPS system (see example files). The information can be provided in the image itself via EXIF or by a similar [image_name].aux file with GPSIMU.Position: 3, [long, lat, height]. If you have configured data already, you can also modify the data_io/exif_adder.py.-
Preprocessed images
For areas to be isolated, you will need to provide a second source of information (e.g. odd). These are usually provided by a CNN. Two diagonal corners are provided in a file, each line being one corner (see example_files/obdd.txt) for an example. You do not need to care about multiple bounding boxes in the same image or the same object being present in multiple images.
Analysis
Please keep in mind that you will need some resources (mostly GPU, Memory & Harddrive) to process a bigger dataset. Make sure that the chosen output folder does NOT exist. Moreover, make sure the location drive is sufficiently fast.
You can start the analysis by calling:
python app.py -src ~/folder/to/images -svy ~/path/to/output/folder -kpts ~/path/to/obdd.txt
Checkpoints
After each major step: copying the files, rough sfm model, isolation, fine sfm model (pdsm), a checkpoint is reached. This also means that you may need to delete the previously generated files if a step goes sour.
Results
All results a put into the /path/to/output/folder.
- The rough model is in /sparse
- The isolated areas are in /observations. The subfolders are named by the major image and are containing: a fine model, coordinate system, image, graph used (if orca was installed)
- The graph information is put into /detected_areas and is saved as XML
