The purpose of this repository is to house the Final Project for Module 1 of the Machine Learning Engineering (MLE) Course.

This repository contains a demo news summarization application for summarizing Vietnamese news articles. The application is built using the following technologies:
- Model: The ViT5 model is used for text summarization. It is a state-of-the-art pretrained Transformer-based encoder-decoder model specifically designed for Vietnamese.
- API Endpoints: The application integrates API endpoints using FastAPI, a modern, fast (high-performance), web framework for building APIs with Python.
- Containerization: The application is containerized using Docker, which allows for easy deployment and scalability.
- Deployment: The model is deployed on Google Kubernetes Engine (GKE), a managed environment for deploying, managing, and scaling containerized applications using Kubernetes. The GKE cluster is provisioned using Terraform, an infrastructure as code tool.
- Monitoring: Prometheus, an open-source monitoring and alerting toolkit, along with Grafana, a popular visualization tool, are used to monitor the deployed application and gather performance metrics.
- CI/CD Pipeline: The project includes a CI/CD pipeline implemented with Jenkins. Jenkins is installed on Google Compute Engine (GCE) using Ansible to automate image pushes to Docker Hub and streamline the model deployment process on GKE.


We will use Python 3.8
make venv
source venv/bin/activate
python3.8 download_pretrained_model.pyuvicorn main:app --host 0.0.0.0 --port 30000
Then, you can try the API at localhost:30000/docs.
-
Install gke-gcloud-auth-plugin
sudo apt-get install google-cloud-cli-gke-gcloud-auth-plugin -
Setup Gcloud Project
- Authorizes gcloud and other SDK tools to access Google Cloud and setup configuration
gcloud init - Login to GCP
gcloud auth application-default login
- Authorizes gcloud and other SDK tools to access Google Cloud and setup configuration
Run the following commands to create a GKE cluster using Terraform
cd terraform
terraform init
terraform plan
terraform apply
After a while, you should see this if your cluster is successfully created

-
Connect to the cluster using
gcloudcommand.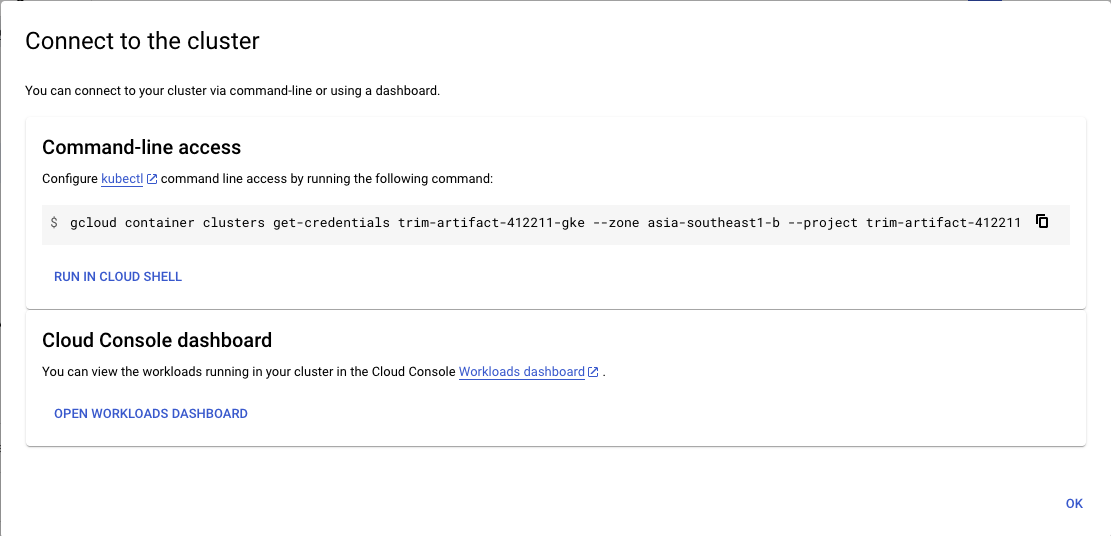
-
Switch the current
contextusingkubectx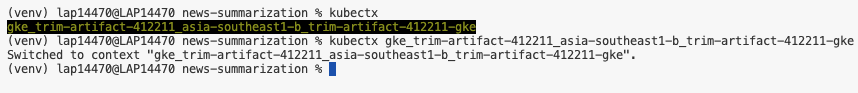
-
Create namespaces
kubectl create ns nginx-ingress kubectl create ns model-serving -
Deploy NGINX-ingress
kubens nginx-system
helm upgrade --install nginx-ingress helm-charts/nginx-ingress
-
Get External IP of NGINX-ingress
kubens nginx-system
kubectl get svc
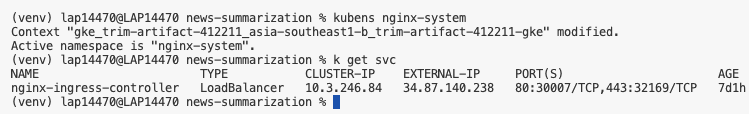
-
Replace the External IP above in
spec/rules/hostin filehelm-charts/model-deployment/templates/nginx-ingress.yaml -
Deploy Model
kubens model-serving helm upgrade --install news-summarization helm-charts/model-deployment -
You can access the API in
NGINX_EXTERNAL_IP.nip.io/docs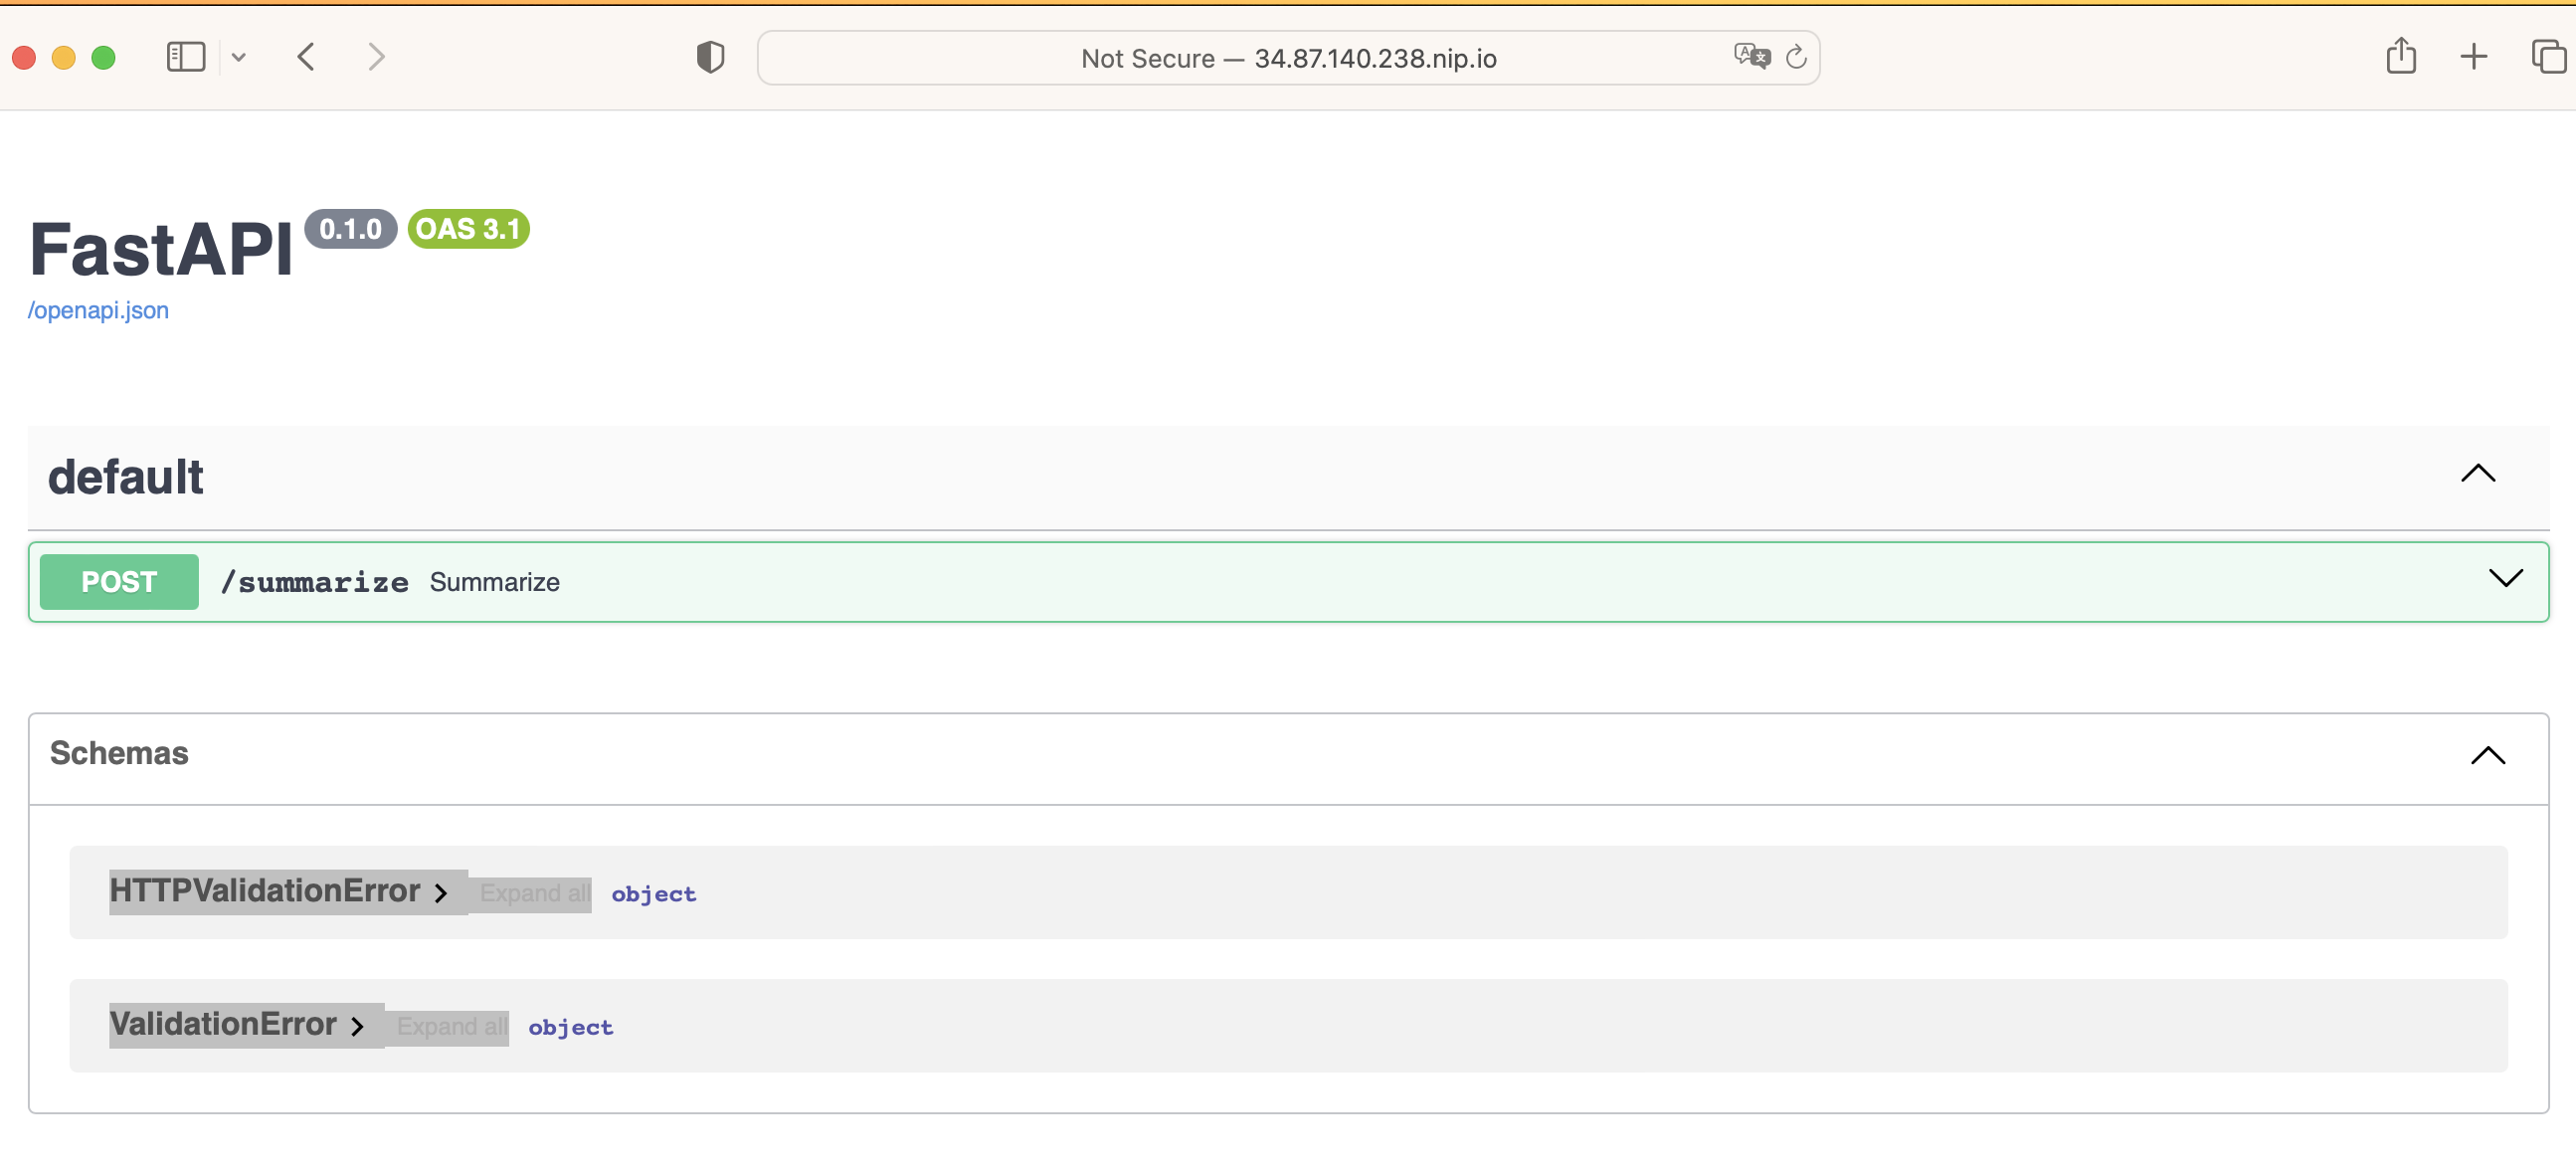


-
Create a new service account with Compute Admin role. In this project, the service account is named
ansible-sa. -
Navigate to Service accounts section, select action Manage keys.
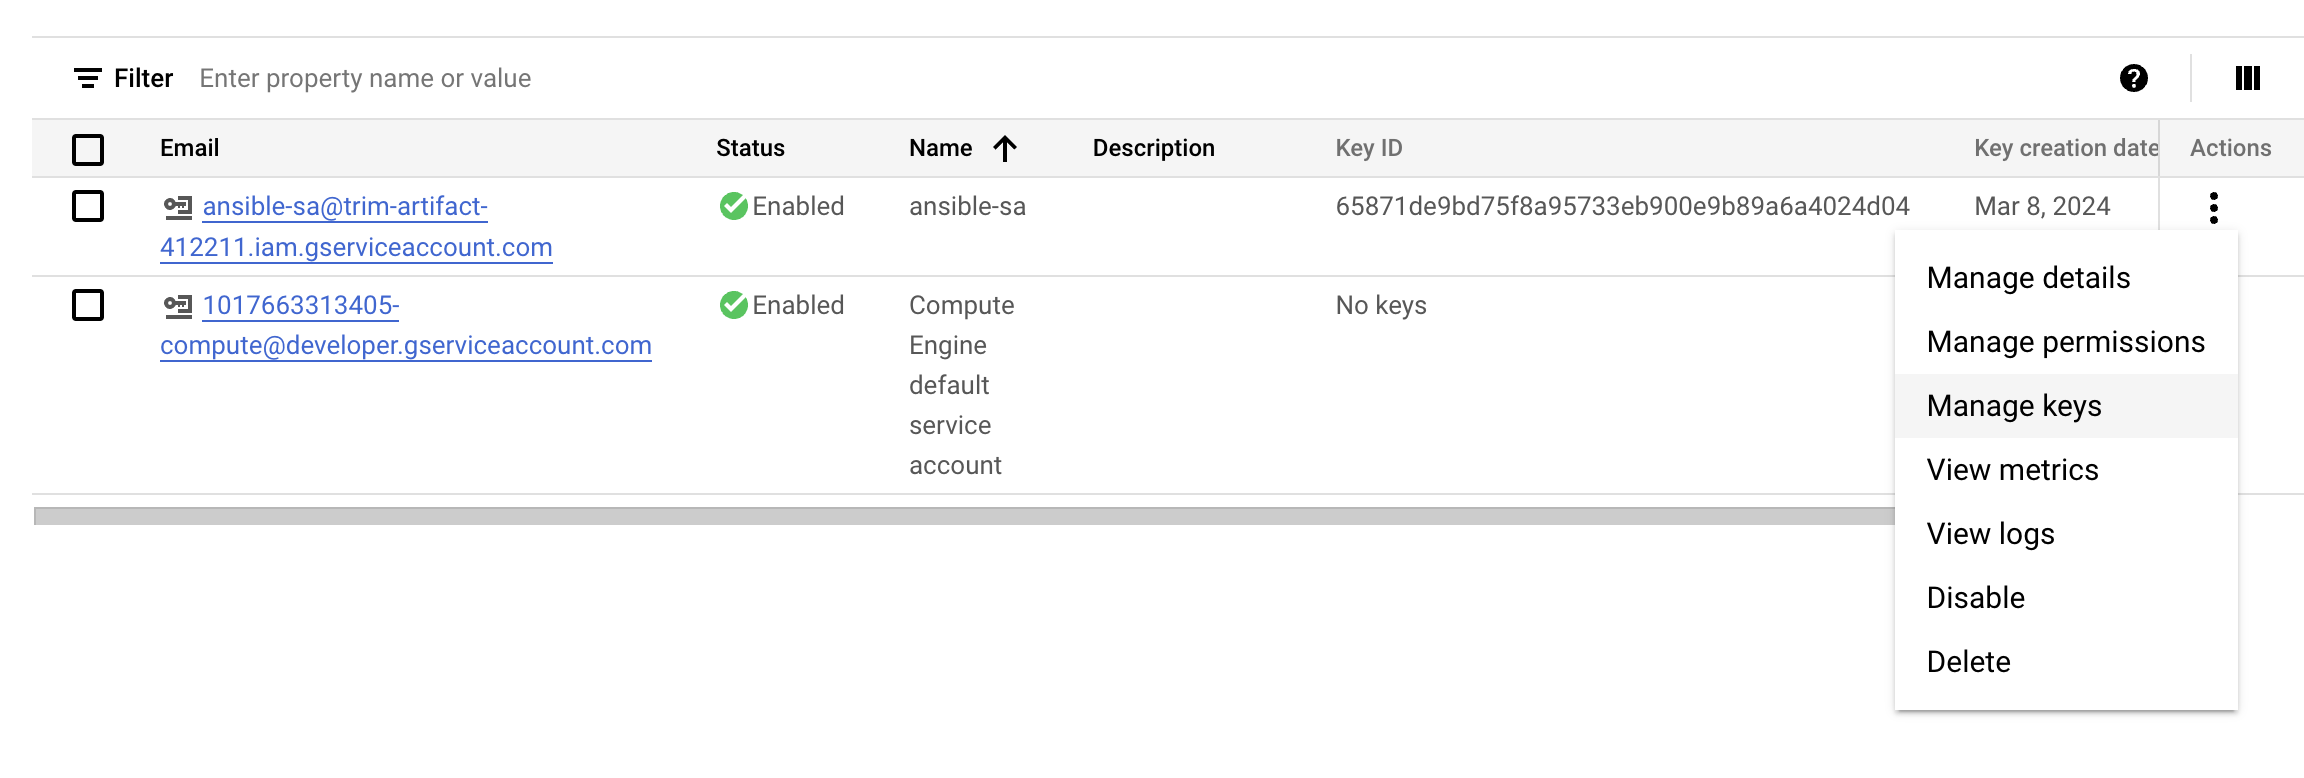
-
Create new key of the created service account and download it as JSON file.
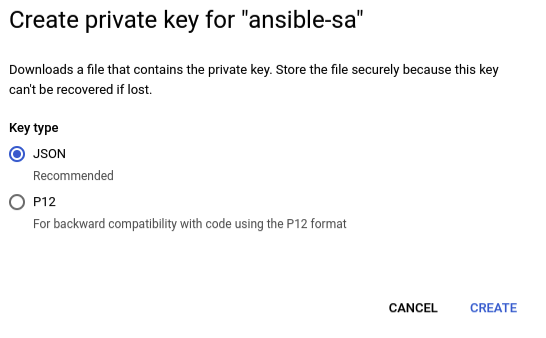
-
Save the downloaded JSON key in
ansible/secrets. -
Update the
service_account_filefield inansible/playbooks/create_compute_instance.ymlwith your new path to the new JSON key. -
Run the following command in terminal to create a Compute Instance
ansible-playbook ansible/playbooks/create_compute_instance.yml
-
After few moments, you should see your instance is successfully created with the name
vm-jenkins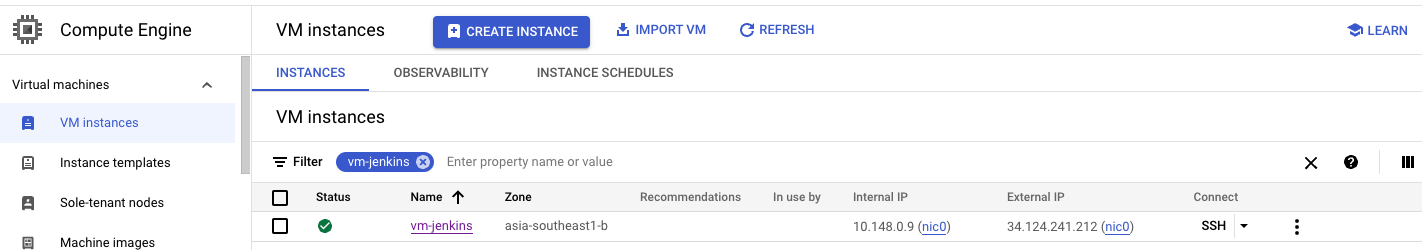


- Generate a new SSH key using
ssh-keygenin the terminal of your local machine. - Navigate to section Settings/Metadata and select tab SSH KEYS.
- Select EDIT and copy your public key that is just created (.pub file).
- Update the external IP of your VM and the path to private key in
ansible/inventory. - Run the following command in terminal to deploy Jenkins on the VM
ansible-playbook --inventory-file ansible/inventory ansible/playbooks/deploy_jenkins.yml
-
Connect to Jenkins UI
-
Checking Jenkins installed successfully on GCE
- Access the GCE instance
ssh YOUR_USERNAME@INSTANCE_EXTERNAL_IP -i PATH_TO_PRIVATE_SSH_KEY - Verify if Jenkins is running in the Compute Engine instance
sudo docker ps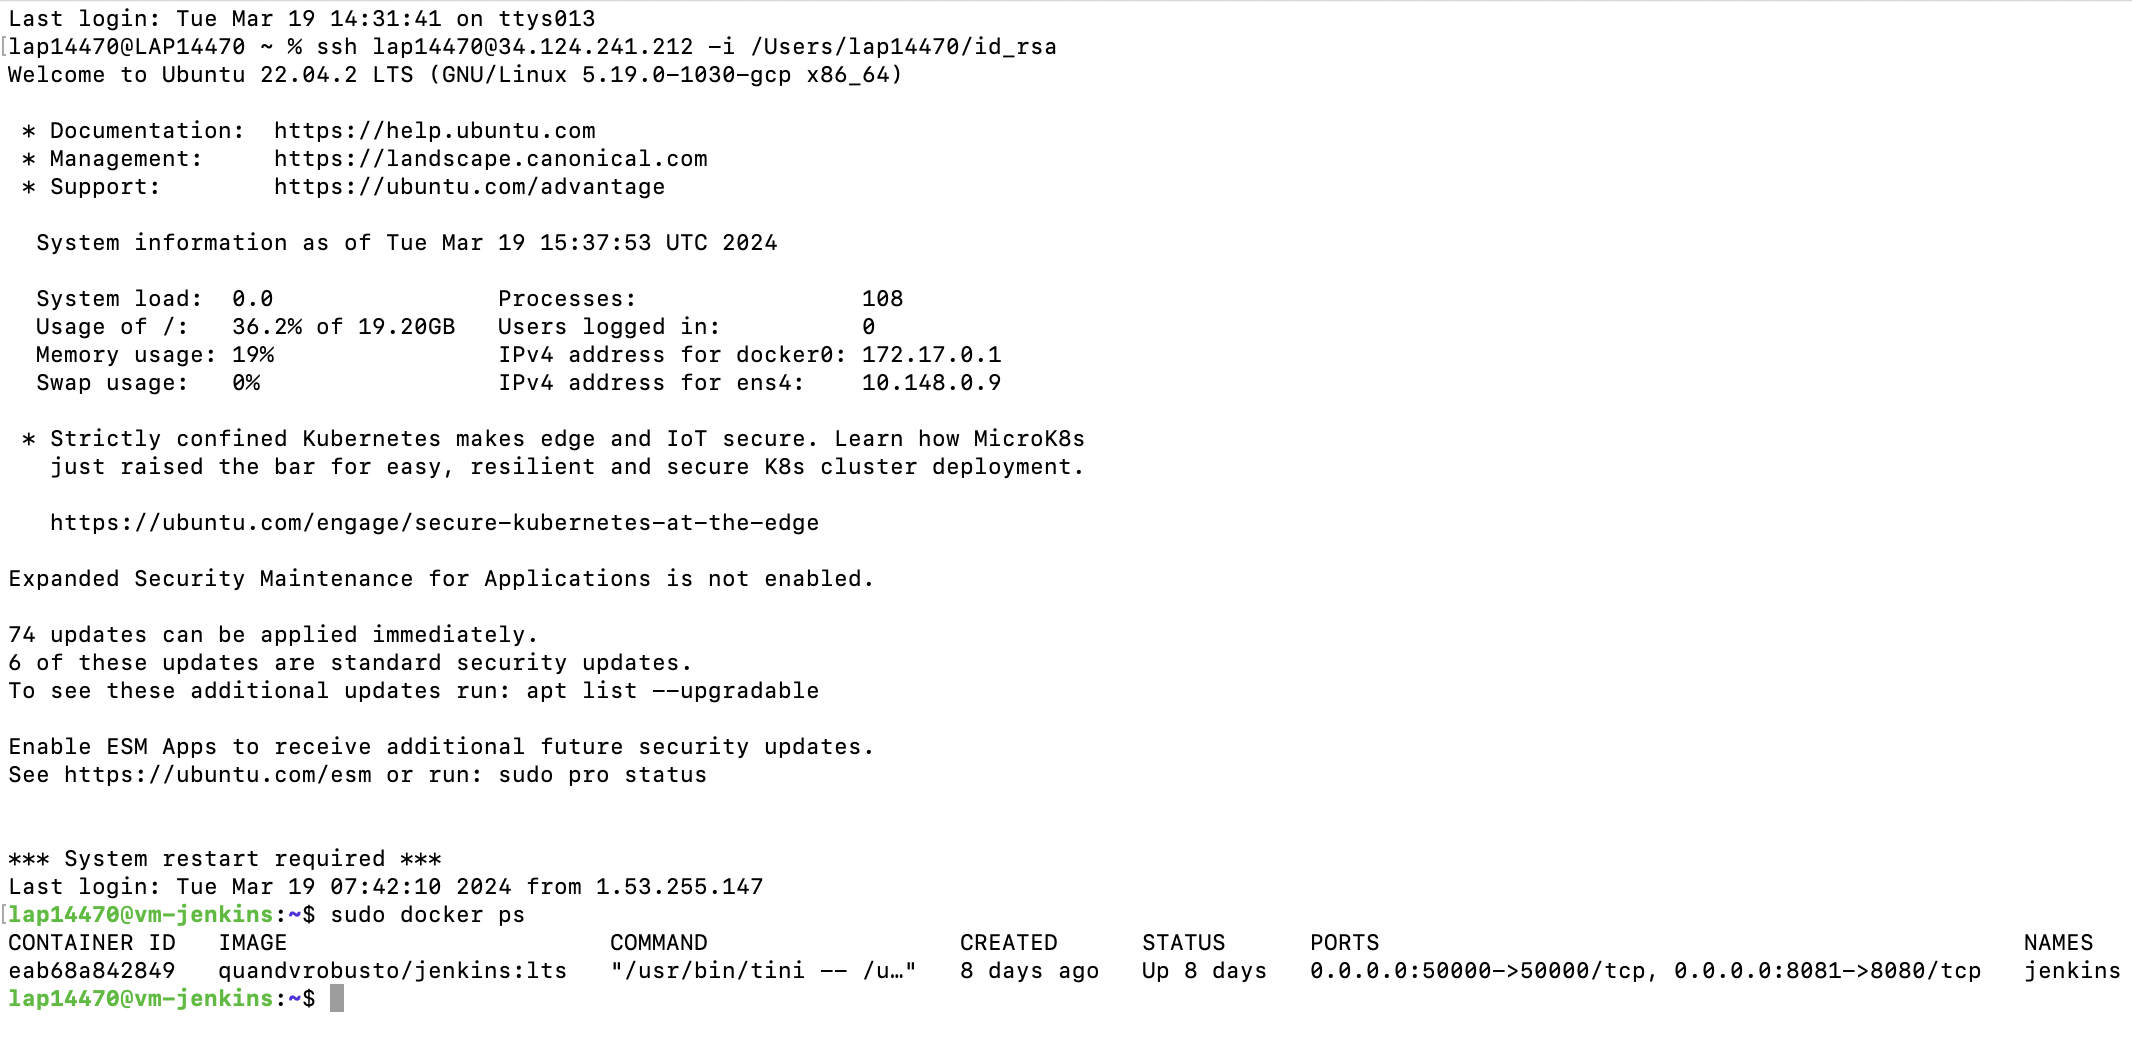
- Access the GCE instance
-
Access Jenkins UI via
INSTANCE_EXTERNAL_IP:8081. -
Follow the instruction to log in into Jenkins.
-
The password can be retrieved by
# inside GCE instance
sudo docker exec -ti jenkins bash
cat /var/jenkins_home/secrets/initialAdminPassword
-
-
Connect Jenkins to GitHub Repo
- Add Jenkins to Repo Webhook
-
Payload URL would
http://INSTANCE_EXTERNAL_IP:8081/github-webhook/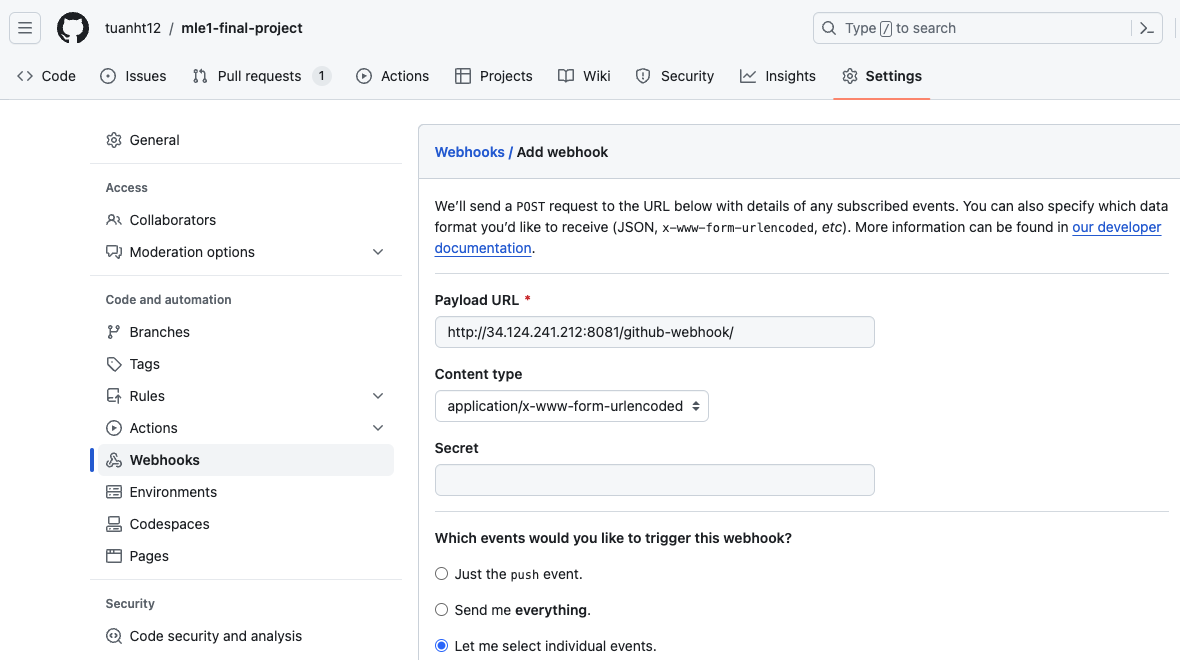
-
Event Trigger can be set to: Pushes and Pull Requests
-
- Add GitHub Repo to Jenkins
- Create new Multibranch Item in Jenkins
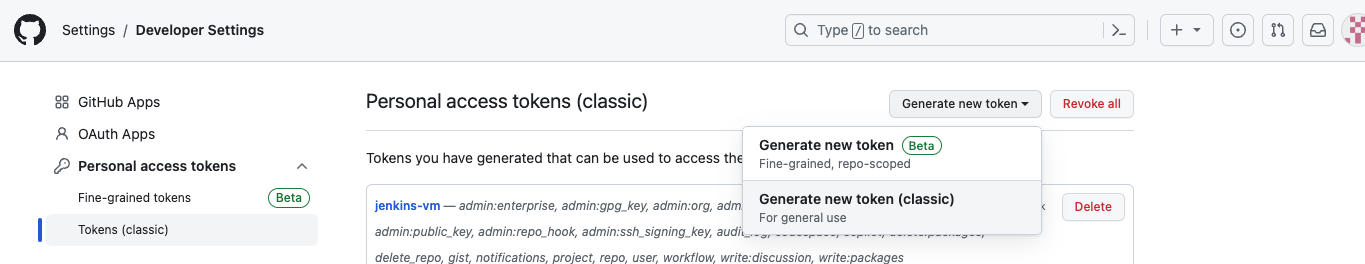
- Create a new Personal Access Token. In this project we will generate a classic token.
- Connect Repo to Jenkins
- Add credentials with your Github
usernameand password is just-createdPersonal Access Token - Copy the URL to your Github repo.
- Click
Validateto see whether Jenkins successfully connect to your Github repo or not.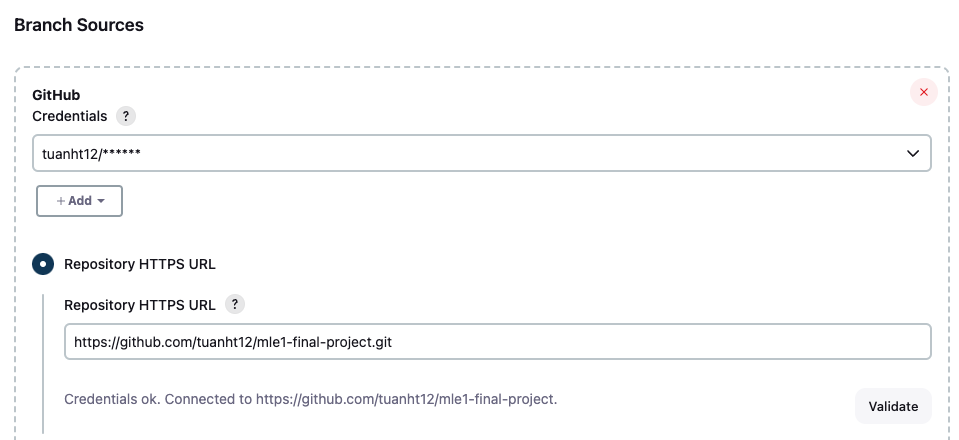
- Add credentials with your Github
- Add Jenkins to Repo Webhook
-
Add DockerHub Token to Jenkins Credential
- Create a new DockerHub Token
- Add the token to Jenkins' Credentials
- Note: ID must be
dockerhubto match theregistryCredentialinJenkinsfile.
- Note: ID must be
-
Setup Cloud Connection
- Create
clusterrolebinding
kubectl create clusterrolebinding cluster-admin-binding --clusterrole=cluster-admin --user=system:anonymous kubectl create clusterrolebinding cluster-admin-default-binding --clusterrole=cluster-admin --user=system:serviceaccount:model-serving:default- Configure clouds at
http://INSTANCE_EXTERNAL_IP:8081/manage/configureClouds/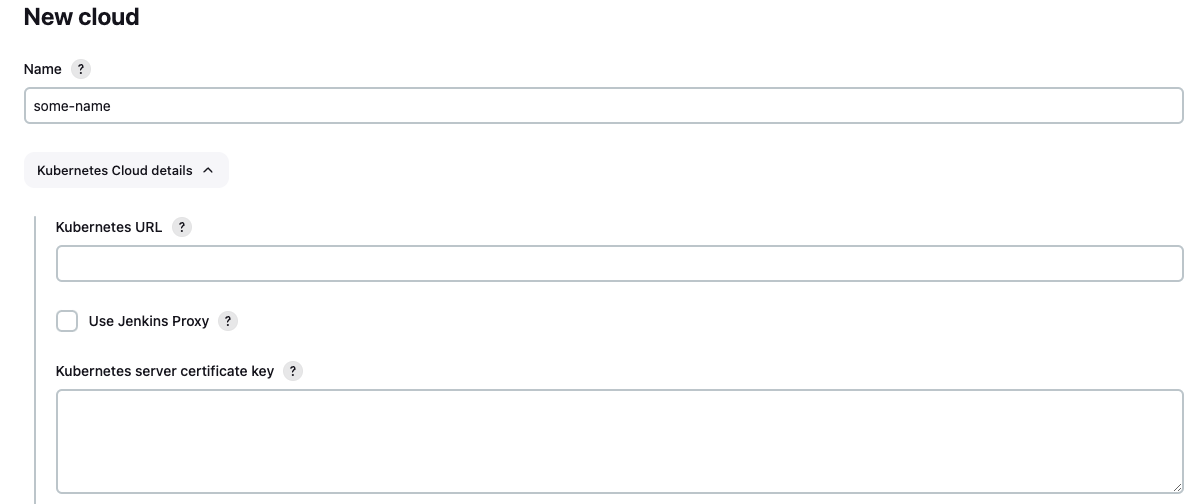
-
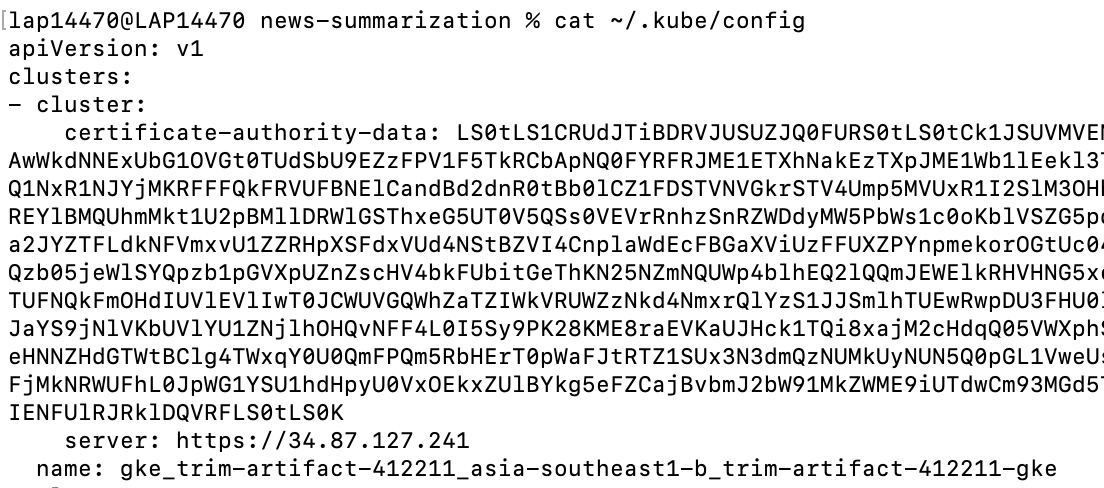
Get
Kubernetes URLandKubernetes server certificate keyby running the following in terminal of your local machine.cat ~/.kube/configKubernetes URLisserverKubernetes server certificate keyiscertificate-authority-data
-
- Create
-
Build
- When there is a new push of new changes to a branch, the test pipeline will run.
- When there are changes merged to
main, the Deploy pipeline will run, build and push the latest image to DockerHub. - After that, the pipeline will use Helm to pull and deploy the latest image in GKE cluster automatically.


-
Create and switch to namespace
monitoringkubectl create ns monitoring kubens monitoring
-
Get dependencies to build
kube-prometheus-stackcd helm-charts/k8s-monitoring/kube-prometheus-stack helm dependency build -
Deploy
kube-prometheus-stackusinghelmcd helm-charts/k8s-monitoring helm install -f kube-prometheus-stack.expanded.yaml kube-prometheus-stack kube-prometheus-stack -n monitoring -
Edit hosts
- Add 2 hosts of
grafanaandprometheusat the end of/ect/hostssudo vim /ect/hostsNGINX_EXTERNAL_IP prometheus.newssum.monitor.com NGINX_EXTERNAL_IP grafana.newssum.monitor.com
- Add 2 hosts of
-
Grafana can be accessed at
http://grafana.newssum.monitor.com/login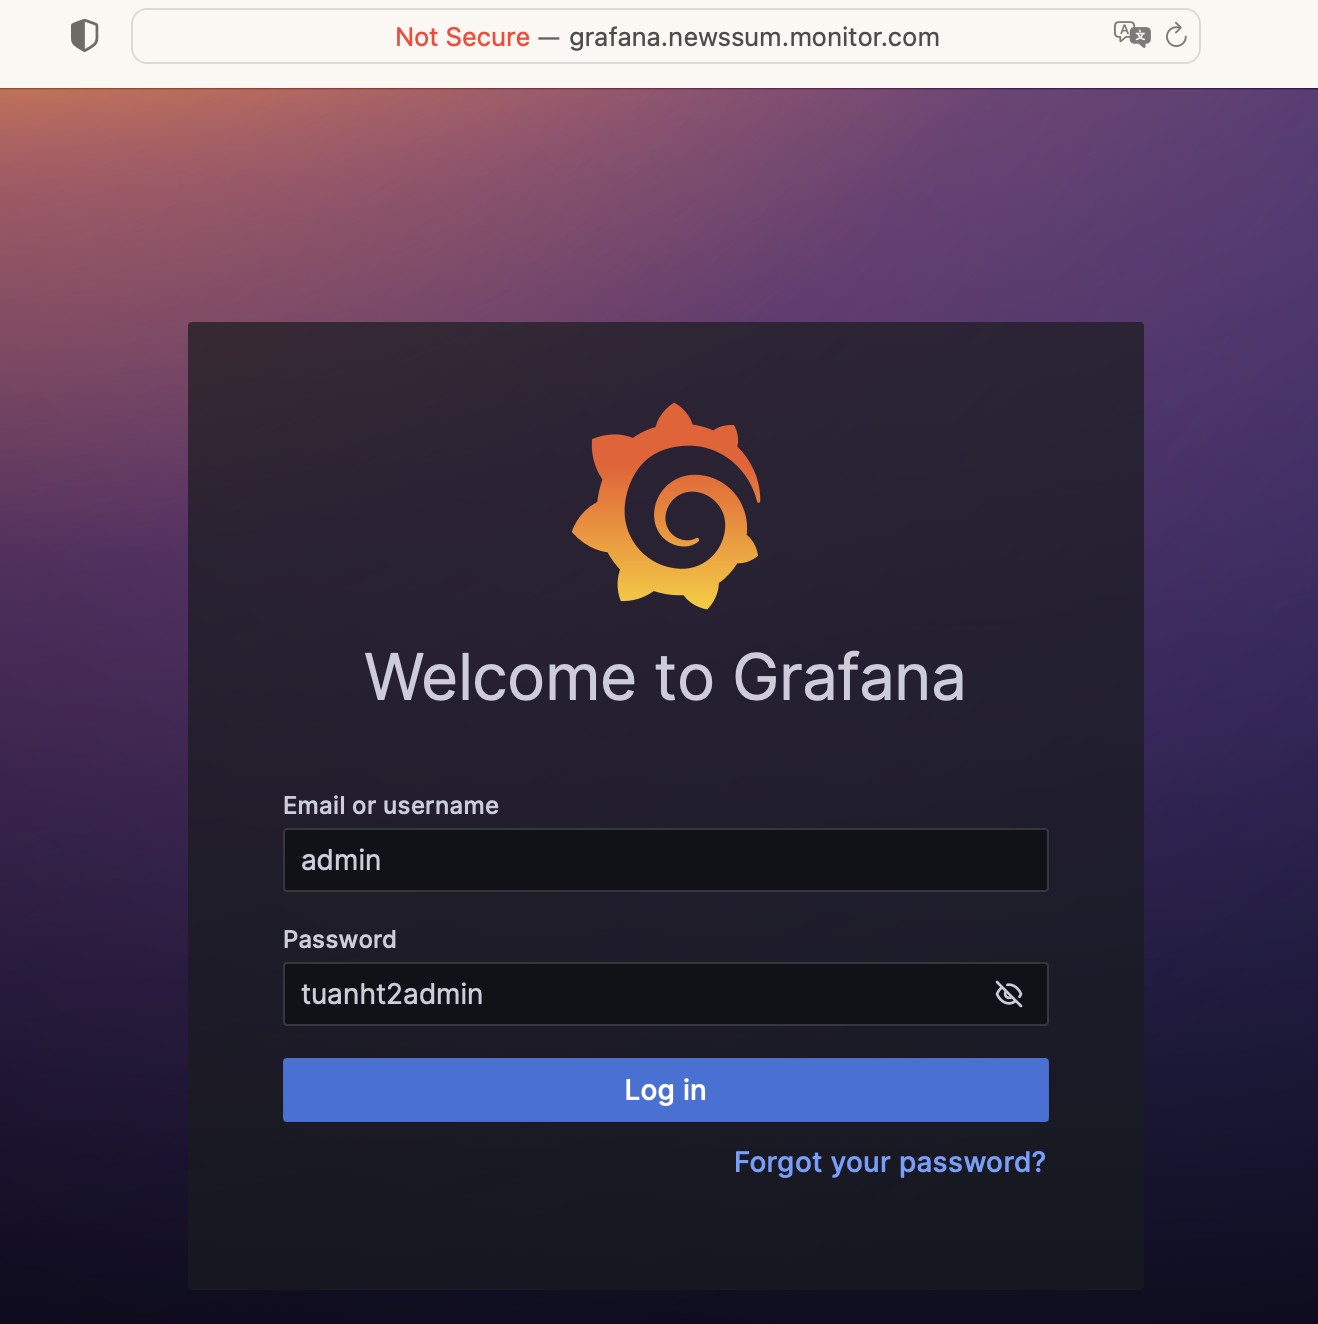
-
Prometheus can be accessed at
http://prometheus.newssum.monitor.com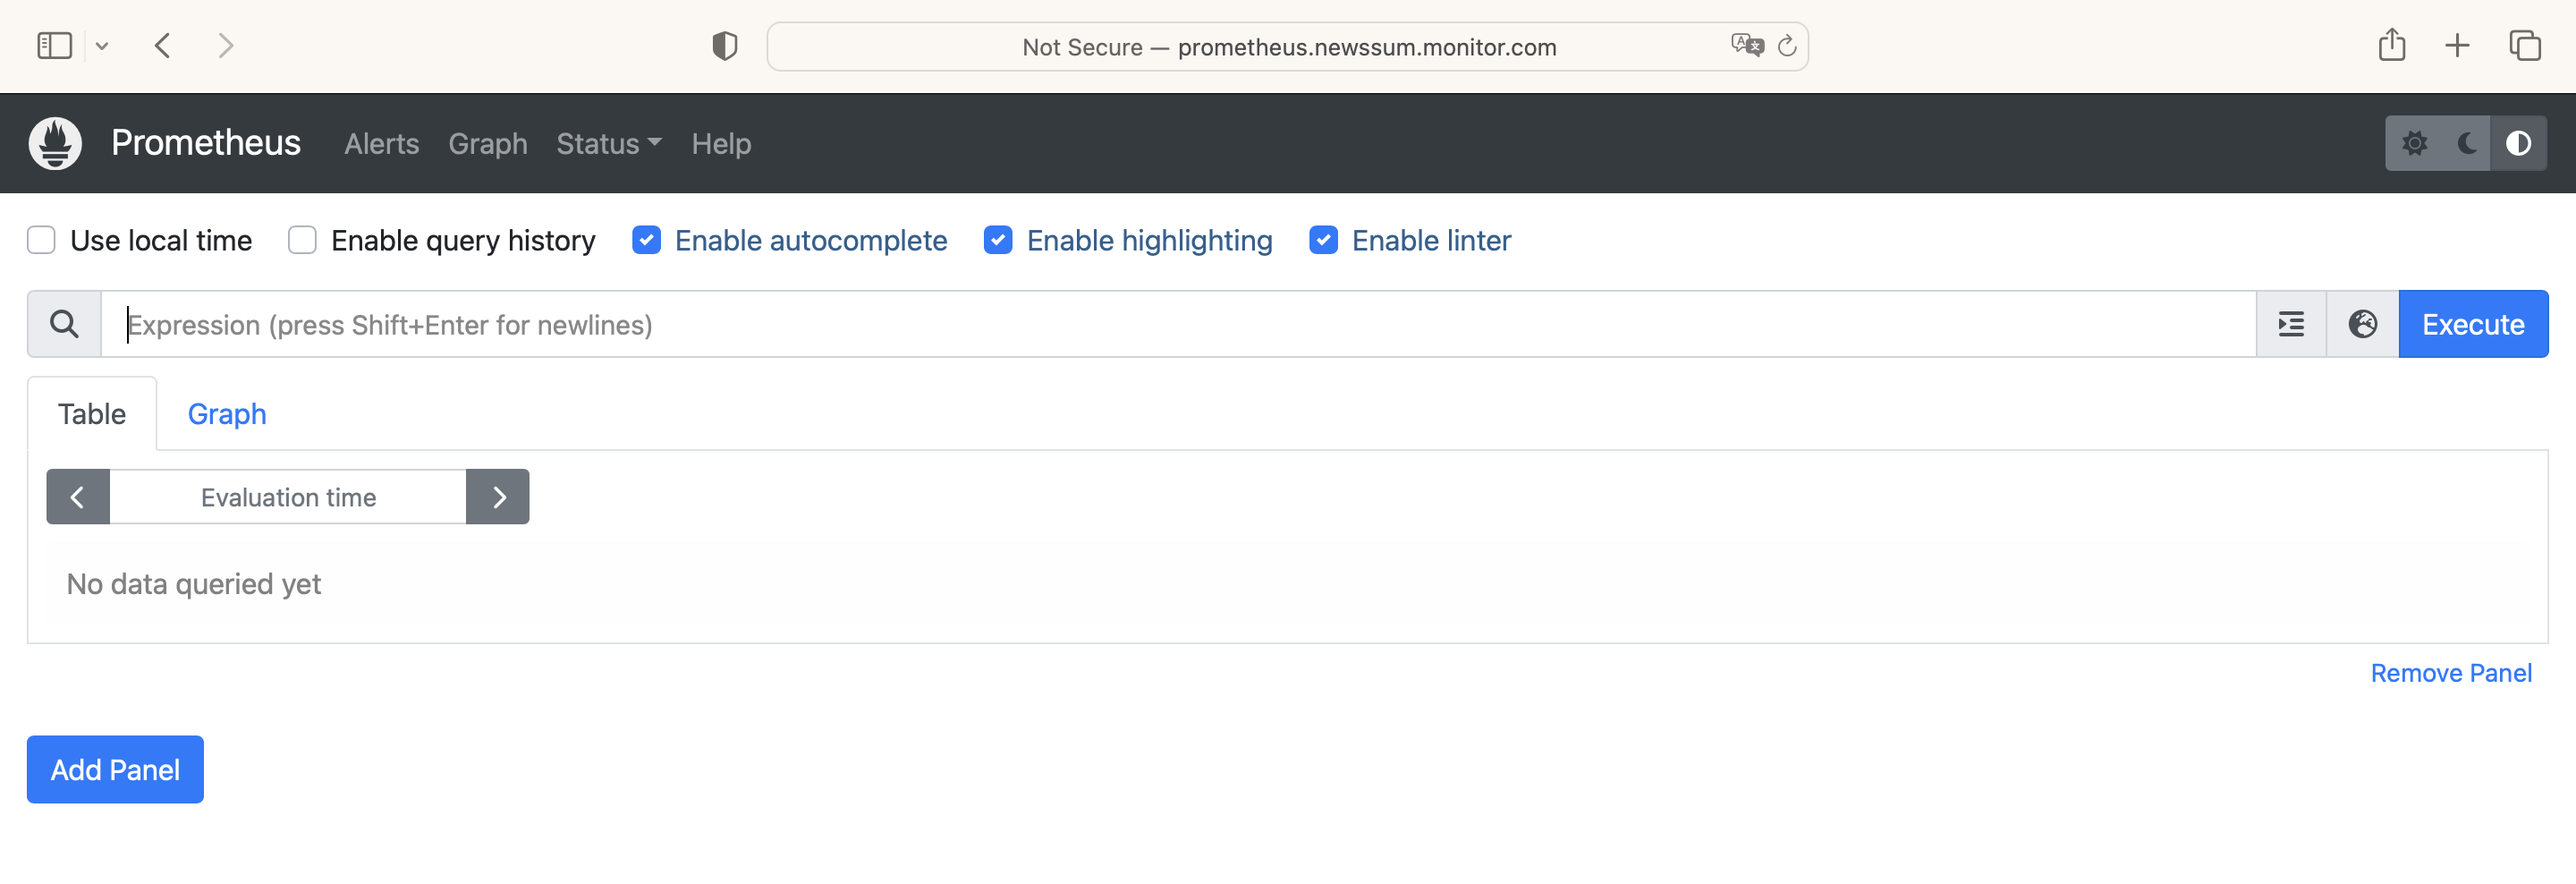


- Add Model Performance Measurement: metrics and visualization
- Add Logs and Traces Storage: The application integrates with a logging and tracing system to capture and store logs and traces for troubleshooting and analysis. Elasticsearch and Jaeger are used for log storage and distributed tracing, respectively.