Multivariate colormaps for use in matplotlib. The colorbars are designed to combine well in sRGB when used to plot multivariate data, and be perceptually linear.
This repository generates _cm_listed_multivar.py which is designed to incorporate directly into the source code of matplotlib in a future PR. If you wish to use these colormaps immediately, or in some other application, the same colormaps can be found in all_multivariate_cmaps.pickle which contains a dictionary with the names of the colormaps as keys, and the variables are numpy arrays of size 256×3.
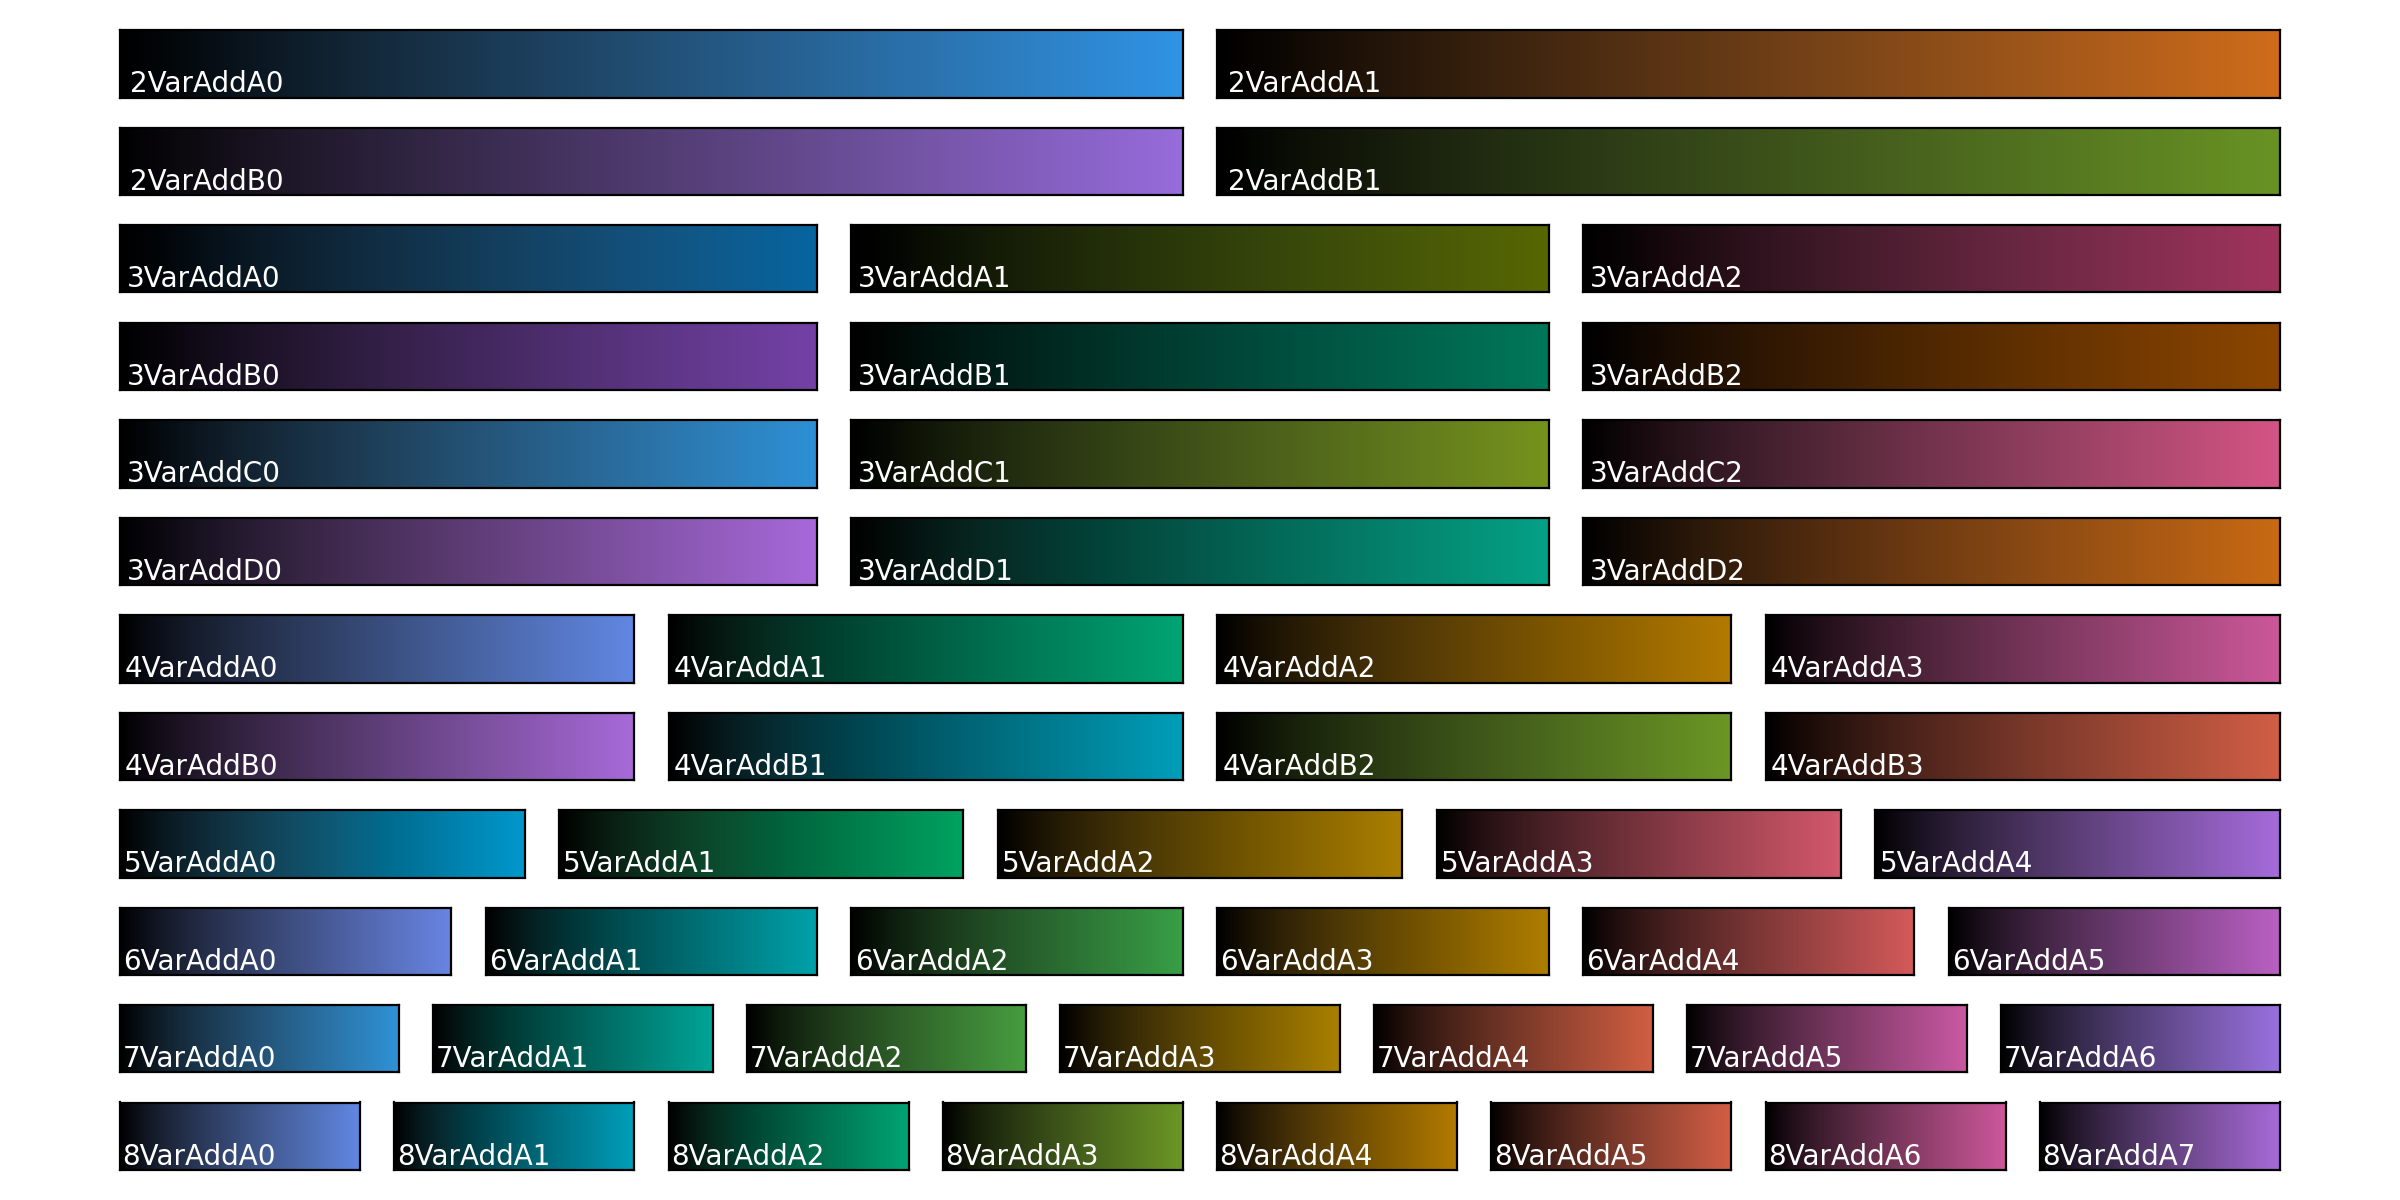
The colorbars exist in additive:
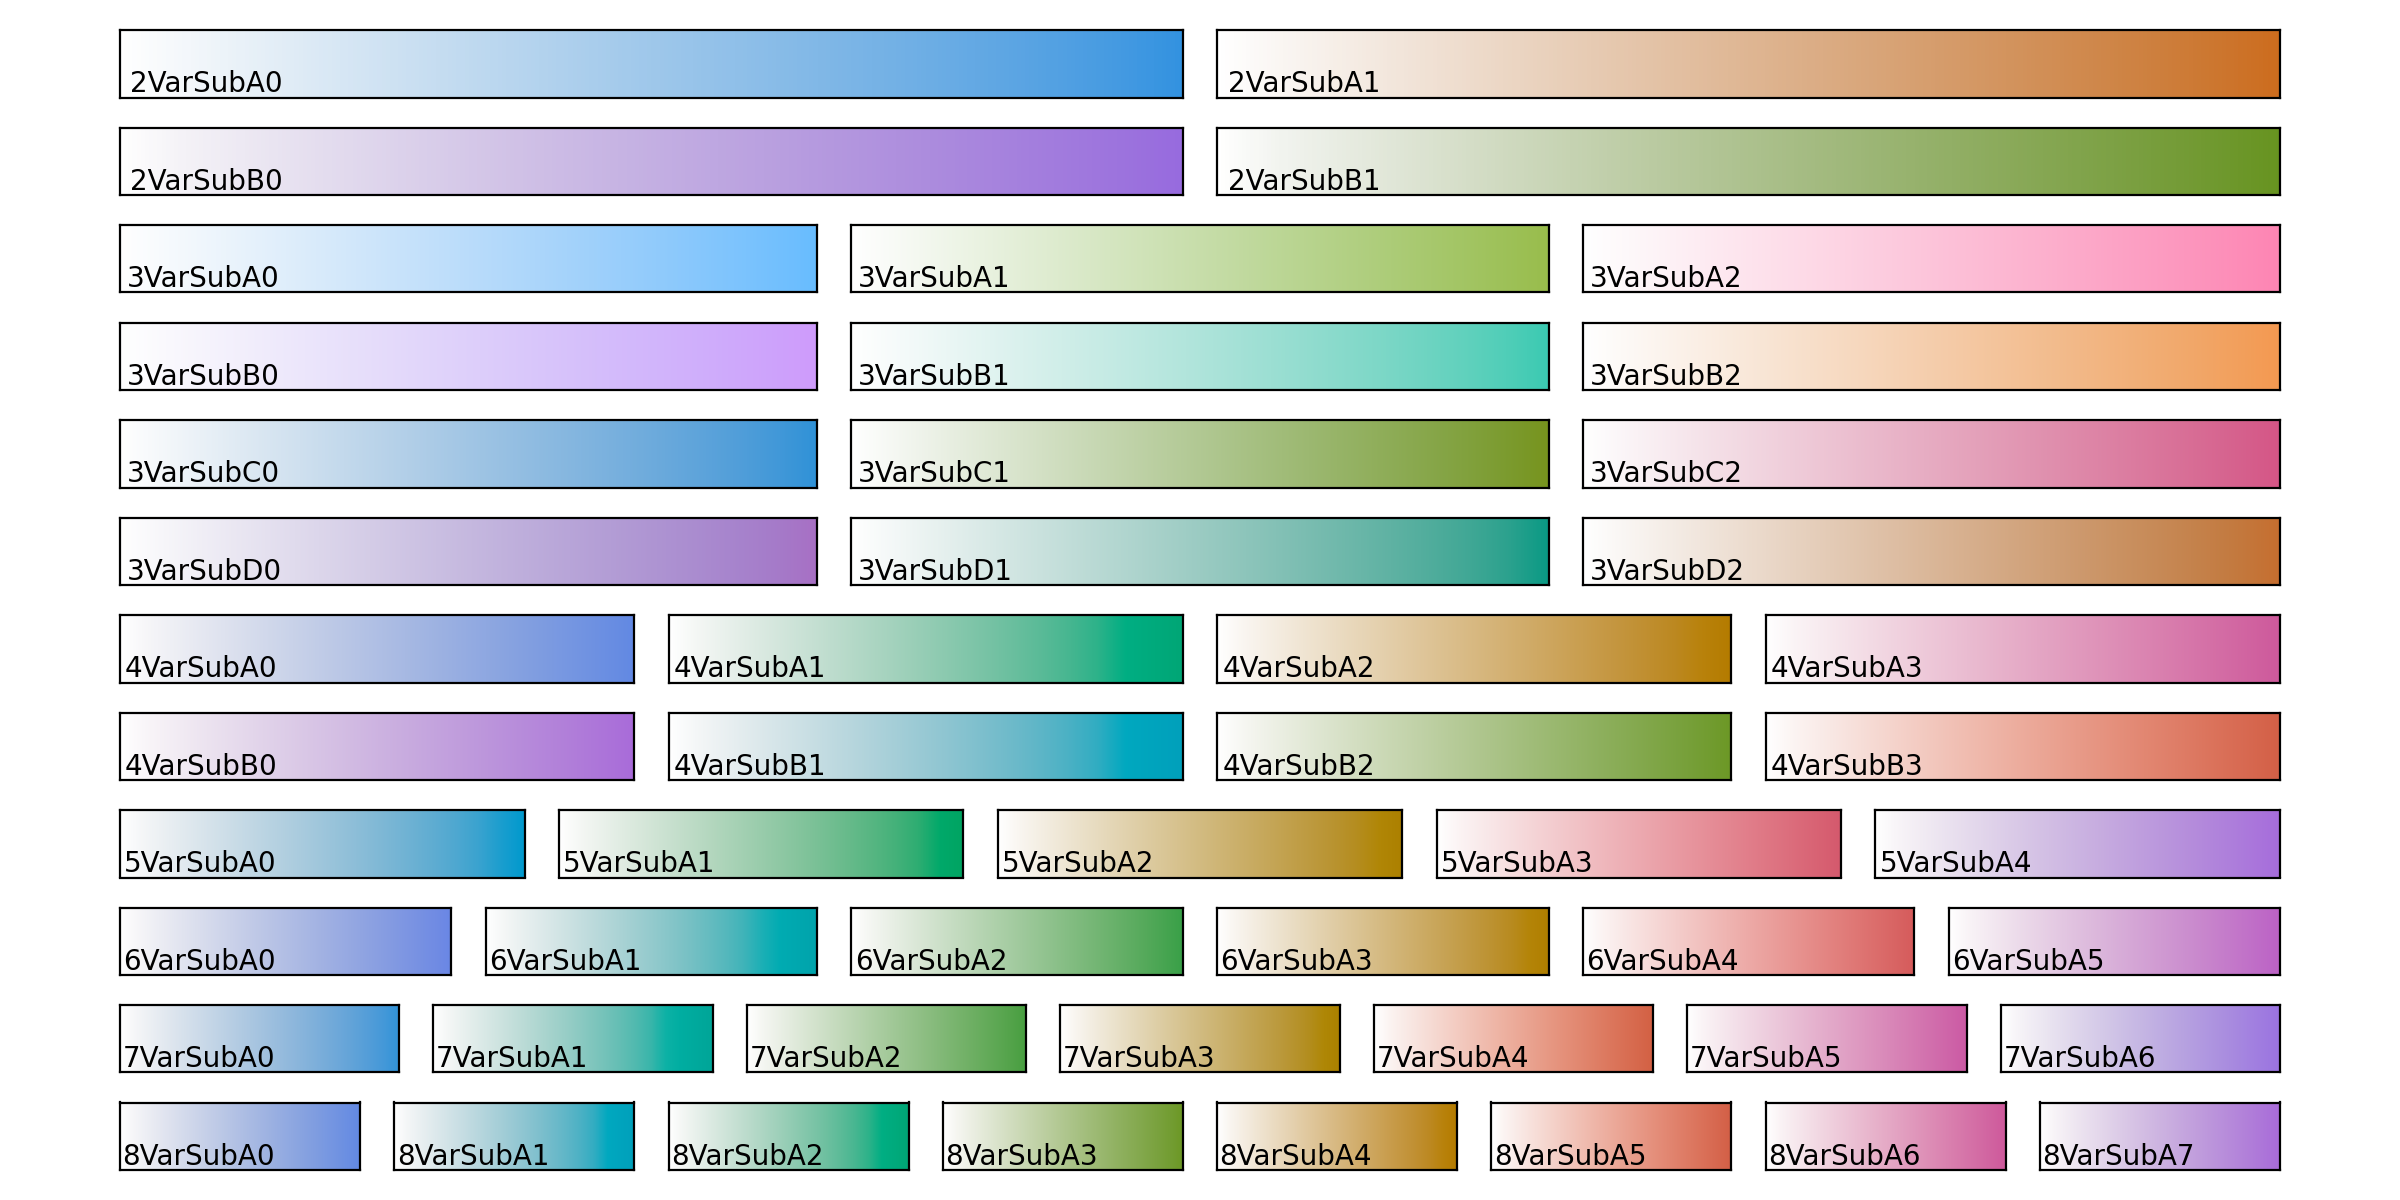
 and subtractive versions:
The design criteria for these are as follows:
- The colormaps must originate in a perceptually uniform colorspace*
- The colormaps must be evenly spaced in colorspace
- The orientation of the colormaps in the colorspace should be done to accomodate users with reduced color vision to the best extent possible**
- When two opposing colormaps are combined, they should form a greyscale in sRGB space***
Variant A and B have different orientation in the colorspace. Variants C and D are brighter versions of A and B.
For the binary and trinary A and B variants, there is an additional requirement that they should form white (or black) when combined in full.
*The colormaps are generated from the ‘CAM02-LCD’ colorspace as defined in the package colorspacious (https://pypi.org/project/colorspacious/)
**The folder comlormap_plots contain visualizations of how the individual colormaps are percieved by users with reduced color vision, i.e. below for 3VarAddC
Note that deuteranomaly and protanomaly are relatively common while tritanomaly is relatively rare. See also: https://colorspacious.readthedocs.io/en/latest/tutorial.html#simulating-colorblindness
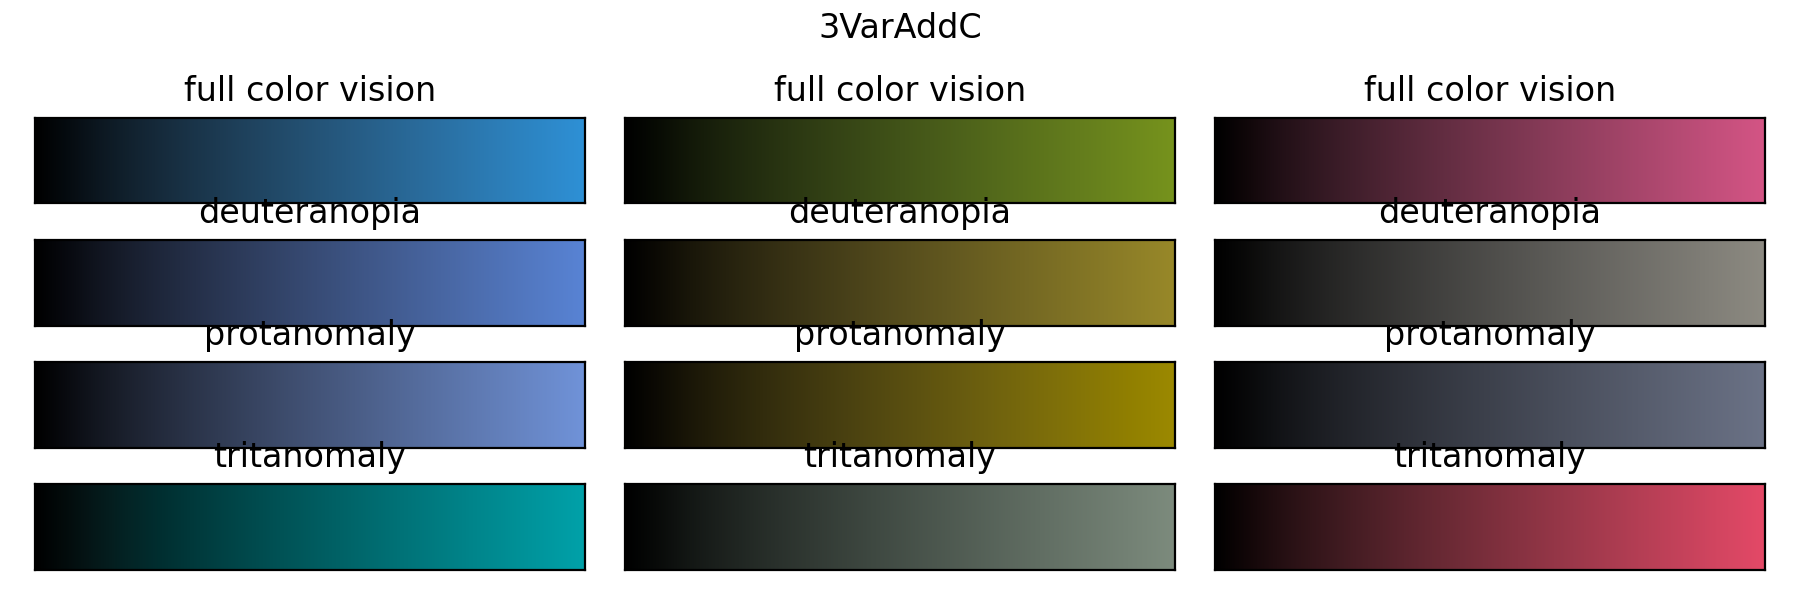
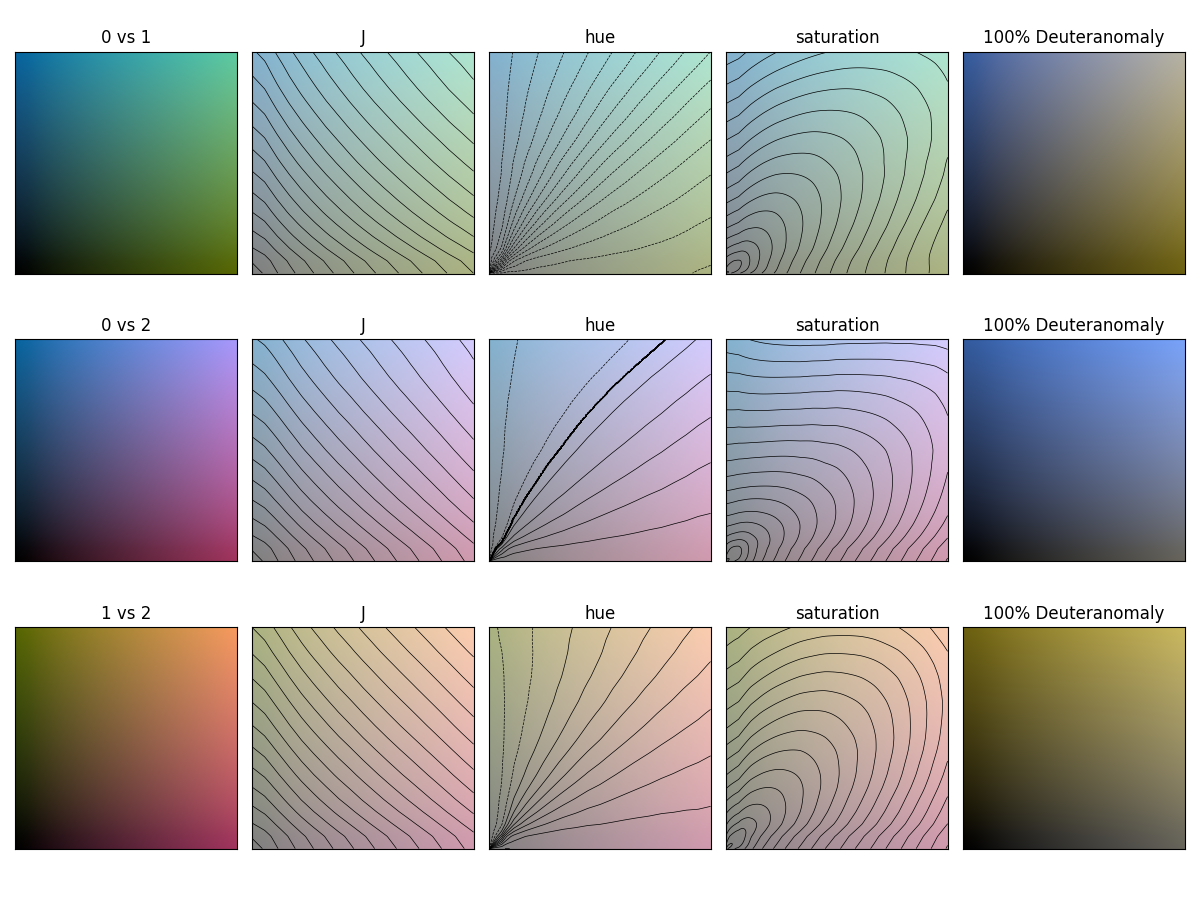
***The folder comlormap_plots also contain evaluations of how the colormaps combine, below for 3VarAddC.
This is the C version, and therefore has excessive saturation. i.e. when the ends of two colormaps are combined, the corresponding hue cannot be represented in sRGB space.
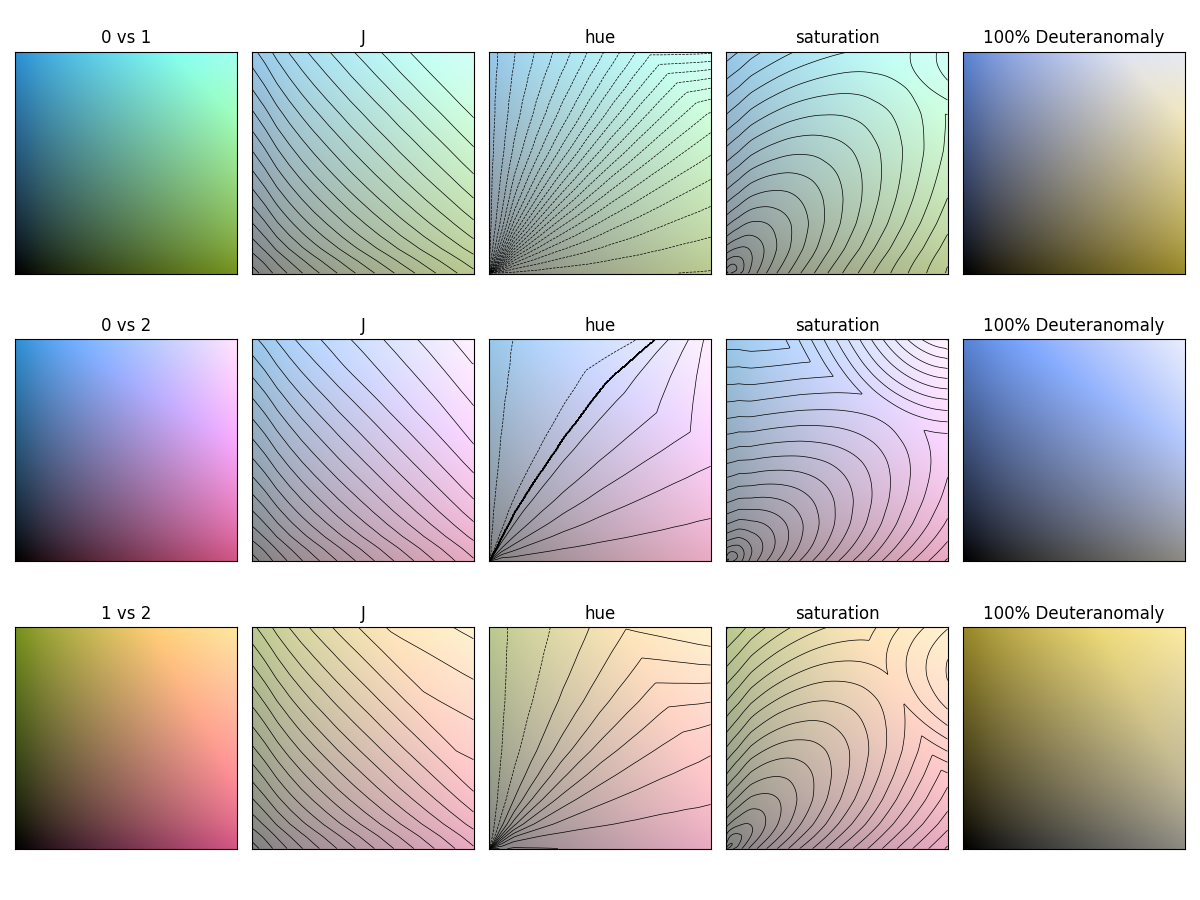 The A version (3VarAddA) does not exceed sRGB for any combination of the colormaps:
- run 2-variate.ipynb this will generate 2vars.pickle
- run 3-variate.ipynb this will generate 3vars.pickle
- run n-variate.ipynb this will generate nmultivariate_cmaps.pickle
- run make source file.ipynb this will generate _cm_listed_multivar.py and all_multivariate_cmaps.pickle
- optional: run visualize together.ipynb to generate the plots in the readme (and all the other corresponding variants)